Fig. 9
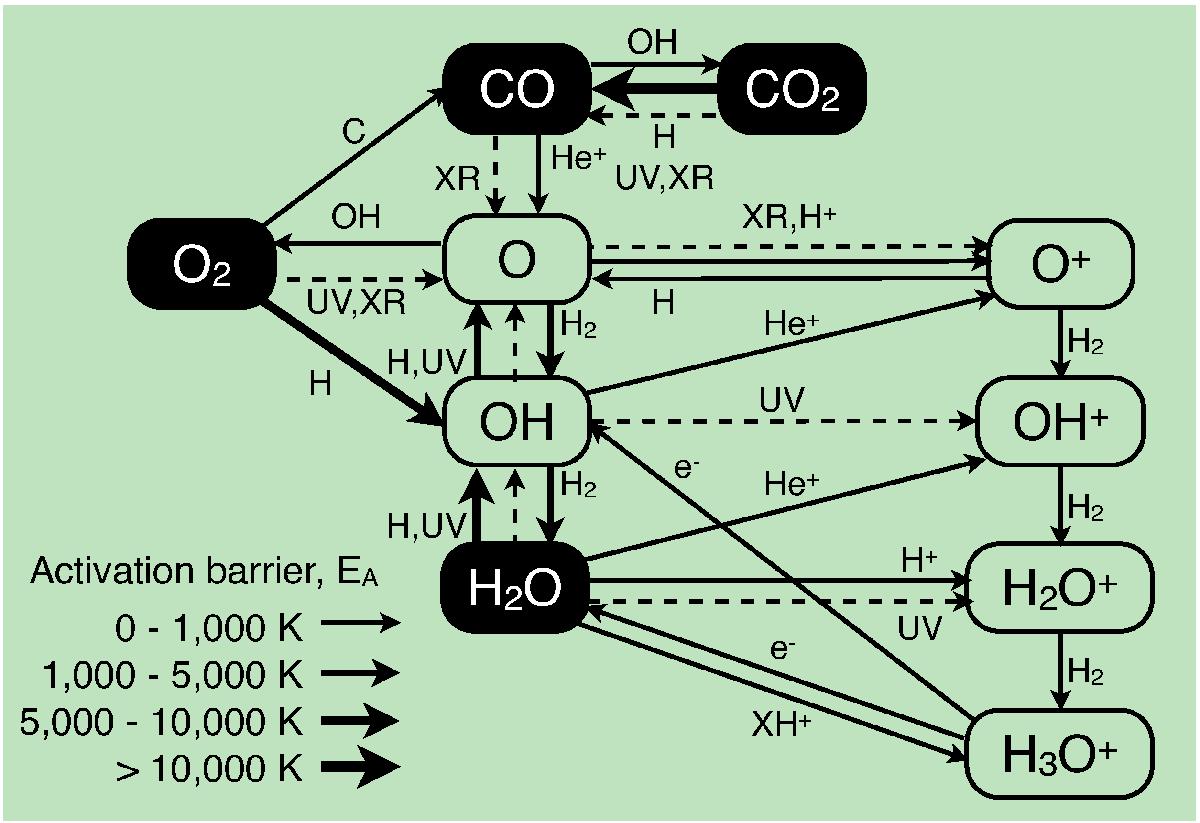
Dominant reactions controlling the abundance of OH and H2O and related species at the position of peak fractional abundance in the disk atmospheres at a radius of 1 AU. The solid lines indicate gas-phase two-body reactions and the dotted lines indicate UV or X-ray-induced reactions. The width of the arrows for the gas-phase reactions shows the magnitude of the activation barrier.
Current usage metrics show cumulative count of Article Views (full-text article views including HTML views, PDF and ePub downloads, according to the available data) and Abstracts Views on Vision4Press platform.
Data correspond to usage on the plateform after 2015. The current usage metrics is available 48-96 hours after online publication and is updated daily on week days.
Initial download of the metrics may take a while.