Fig. 10
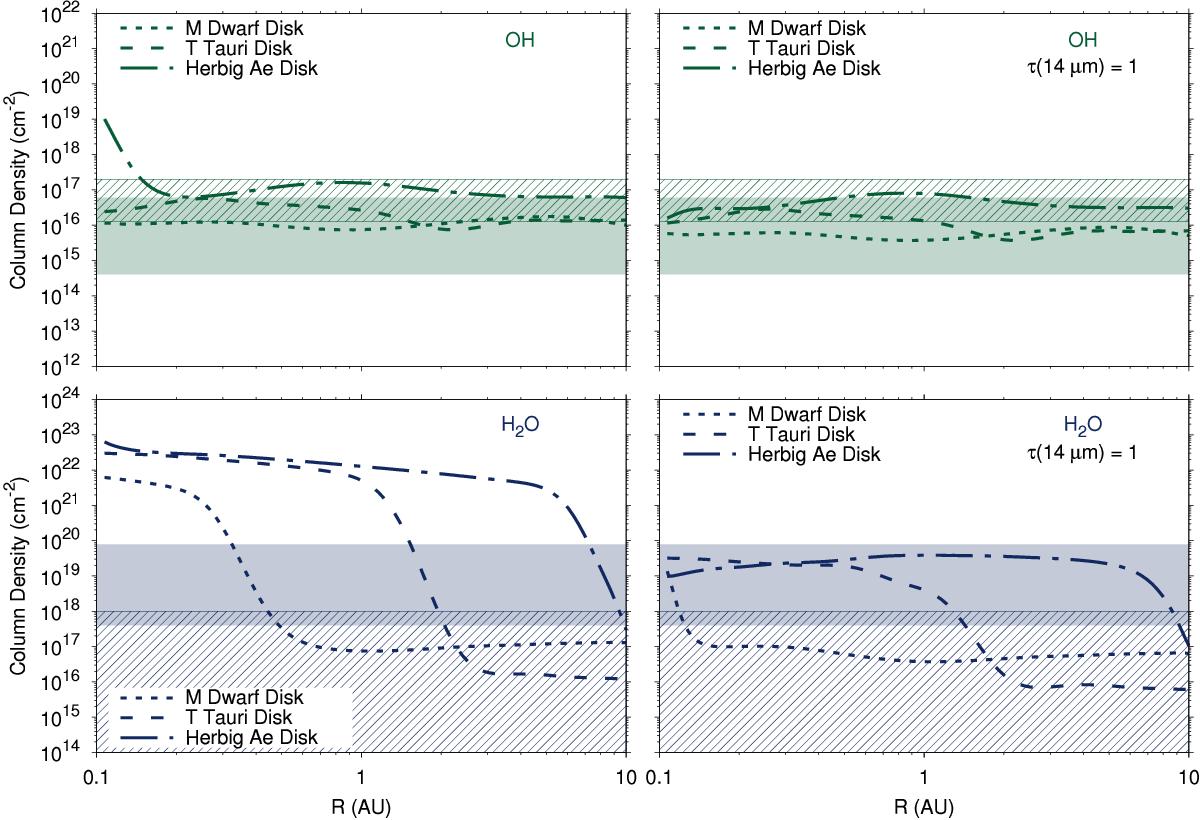
Column density of OH (top row) and H2O (bottom row) as a function of radius for each disk model for the entire vertical extent of the disk (left-hand column) and down to the τ = 1 surface at 14 μm (right-hand column). The solid coloured and striped regions indicate the range of observed values for the T Tauri (Carr & Najita 2011; Salyk et al. 2011) and Herbig Ae (Fedele et al. 2011; Salyk et al. 2011) disks, respectively.
Current usage metrics show cumulative count of Article Views (full-text article views including HTML views, PDF and ePub downloads, according to the available data) and Abstracts Views on Vision4Press platform.
Data correspond to usage on the plateform after 2015. The current usage metrics is available 48-96 hours after online publication and is updated daily on week days.
Initial download of the metrics may take a while.