Fig. 11
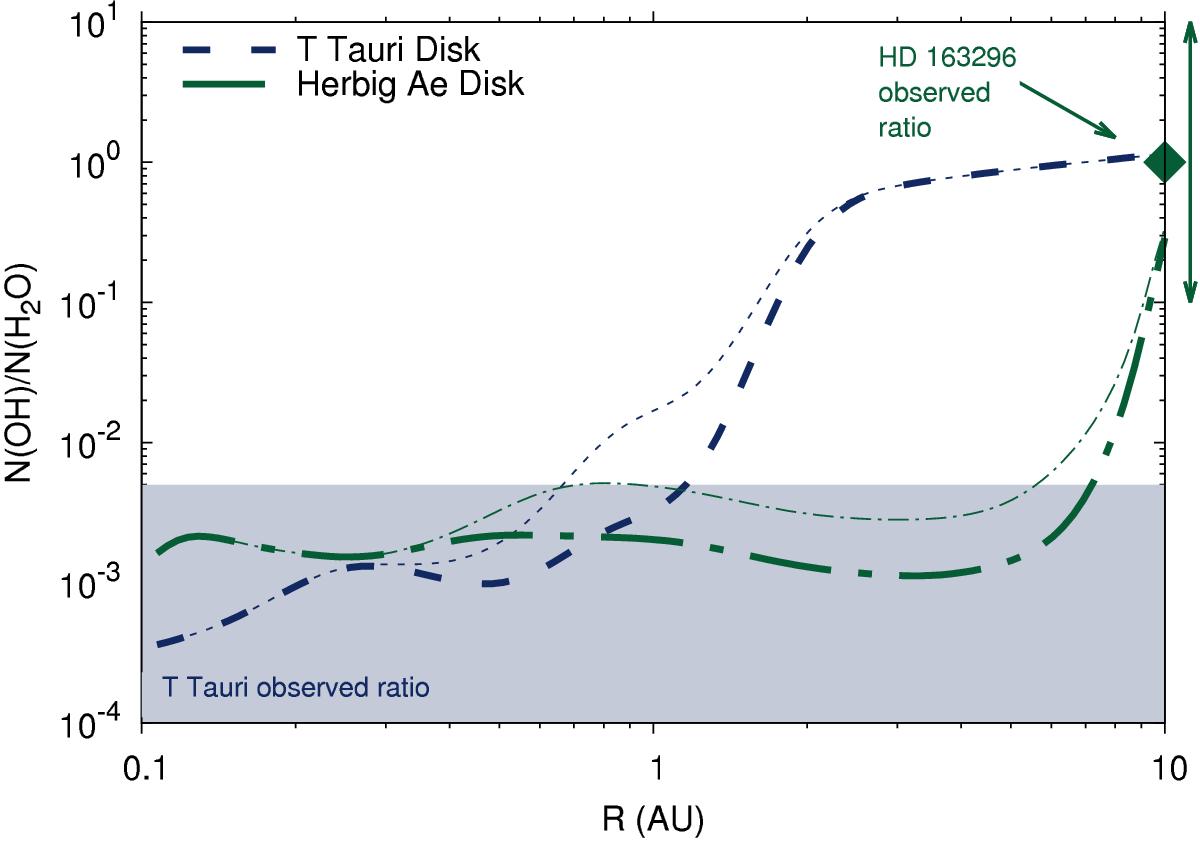
Ratio of OH and H2O column densities in the disk atmosphere as a function of radius for the T Tauri disk (blue dashed lines) and Herbig Ae disk (green dot-dashed lines). The solid coloured region corresponds to the range of observed values for T Tauri disks (Carr & Najita 2011; Salyk et al. 2011) and the green diamond and arrow indicates the ratio range observed for HD 163296 (Fedele et al. 2012). The thick and fine lines represent the ratios down to the τ = 1 surface at 14 and 3 μm.
Current usage metrics show cumulative count of Article Views (full-text article views including HTML views, PDF and ePub downloads, according to the available data) and Abstracts Views on Vision4Press platform.
Data correspond to usage on the plateform after 2015. The current usage metrics is available 48-96 hours after online publication and is updated daily on week days.
Initial download of the metrics may take a while.