| Issue |
A&A
Volume 580, August 2015
|
|
|---|---|---|
| Article Number | A52 | |
| Number of page(s) | 14 | |
| Section | Extragalactic astronomy | |
| DOI | https://doi.org/10.1051/0004-6361/201526114 | |
| Published online | 30 July 2015 | |
Herschel spectroscopic observations of the compact obscured nucleus in Zw 049.057⋆
1 Department of Earth and Space Sciences, Chalmers University of Technology, Onsala Space Observatory, 439 92 Onsala, Sweden
e-mail: niklas.falstad@chalmers.se
2 Universidad de Alcalá de Henares, Departamento de Física, Campus Universitario, 28871 Alcalá de Henares, Madrid, Spain
3 Leiden Observatory, Leiden University, PO Box 9513, 2300 RA Leiden, The Netherlands
4 Naval Research Laboratory, Remote Sensing Division, 4555 Overlook Ave SW, Washington, DC 20375, USA
5 Department of Astronomy, University of Maryland, College Park, MD 20742, USA
6 Department of Physics, Virginia Tech, Blacksburg, VA 24061, USA
7 Harvard-Smithsonian Center for Astrophysics, 60 Garden Street, Cambridge, MA 02138, USA
Received: 17 March 2015
Accepted: 21 May 2015
Context. The luminous infrared galaxy Zw 049.057 contains a compact obscured nucleus where a considerable amount of the galaxy’s luminosity is generated. This nucleus contains a dusty environment that is rich in molecular gas. One approach to probing this kind of environment and to revealing what is hidden behind the dust is to study the rotational lines of molecules that couple well with the infrared radiation emitted by the dust.
Aims. We probe the physical conditions in the core of Zw 049.057 and establish the nature of its nuclear power source (starburst or active galactic nucleus).
Methods. We observed Zw 049.057 with the Photodetector Array Camera and Spectrometer (PACS) and the Spectral and Photometric Imaging Receiver (SPIRE) onboard the Herschel Space Observatory in rotational lines of H2O, H218O, OH, 18OH, and [O I]. We modeled the unresolved core of the galaxy using a spherically symmetric radiative transfer code. To account for the different excitation requirements of the various molecular transitions, we use multiple components and different physical conditions.
Results. We present the full high-resolution SPIRE FTS spectrum of Zw 049.057, along with relevant spectral scans in the PACS range. We find that a minimum of two different components (nuclear and extended) are required in order to account for the rich molecular line spectrum of Zw 049.057. The nuclear component has a radius of 10−30 pc, a very high infrared surface brightness (~1014L⊙kpc-2), warm dust (Td > 100 K), and a very large H2 column density (NH2 = 1024−1025 cm-2). The modeling also indicates high nuclear H2O (~5 × 10⁻⁶) and OH (~4 × 10⁻⁶) abundances relative to H2 as well as a low 16O/18O-ratio of 50−100. We also find a prominent infall signature in the [O I] line. We tentatively detect a 500 km s-1 outflow in the H2O 313 → 202 line.
Conclusions. The high surface brightness of the core indicates the presence of either a buried active galactic nucleus or a very dense nuclear starburst. The estimated column density towards the core of Zw 049.057 indicates that it is Compton-thick, making a buried X-ray source difficult to detect even in hard X-rays. We discuss the elevated H2O abundance in the nucleus in the context of warm grain and gas-phase chemistry. The H2O abundance is comparable to that of other compact (ultra-)luminous infrared galaxies such as NGC 4418 and Arp 220 – and also to hot cores in the Milky Way. The enhancement of 18O is a possible indicator that the nucleus of Zw 049.057 is in a similar evolutionary stage as the nuclei of Arp 220 – and more advanced than NGC 4418. We discuss the origin of the extreme nuclear gas concentration and note that the infalling gas detected in [O I] implies that the gas reservoir in the central region of Zw 049.057 is being replenished. If confirmed, the H2O outflow suggests that the nucleus is in a stage of rapid evolution.
Key words: ISM: molecules / galaxies: ISM / galaxies: individual: Zw 049.057 / line: formation / infrared: galaxies / submillimeter: galaxies
© ESO, 2015
1. Introduction
Many luminous infrared galaxies (LIRGs) host compact obscured nuclei (CONs) where a bolometric luminosity Lbol > 109L⊙ emerges from inside a core of diameter d < 100 pc that is obscured by dust corresponding to a high visual extinction Av > 1000 mag. The nature of the nuclear power source is thus hidden from examination with conventional methods like optical and infrared (IR) lines and the Compton-thick shroud may render even X-rays unusable. It is important to determine if it is an accreting black hole or a compact starburst that powers the nuclear activity since this greatly affects our understanding of galaxy evolution. It has been suggested that a large portion of highly obscured Compton-thick active galactic nuclei (AGN) are missed by X-ray surveys, a problem that may be even worse for low-luminosity AGN (e.g., Lusso et al. 2013).
Furthermore, more than 50% of the star formation at high redshifts may be obscured (Chapman et al. 2005; Wardlow et al. 2011). Obscured star formation can be linked to the assembly of stellar mass, with deeper potential wells in massive galaxies providing dense, heavily obscured environments resulting in rapid star formation (e.g., Ibar et al. 2013).
The dust in obscured galaxies may have a high optical depth for a wide span of wavelengths. To study their nuclear structure, dynamics, and physical conditions, we thus need a tracer that can probe deep into the dust shroud. Molecules like water (H2O) and hydroxyl (OH) couple very well with the IR-field and can reach high abundances in warm embedded regions, making them ideal probes of physical conditions in dust-enshrouded galaxies as shown in previous studies of Mrk 231, Arp 220, and NGC 4418, among others (Fischer et al. 2010, 2014; González-Alfonso et al. 2004, 2008, 2010, 2012, 2014a,b). The OH molecule has also been proven to trace massive molecular outflows in ultraluminous infrared galaxies (ULIRGs) (Fischer et al. 2010; Sturm et al. 2011; Veilleux et al. 2013; Spoon et al. 2013; González-Alfonso et al. 2014b). Recent studies have found H2O in high-redshift sources (Impellizzeri et al. 2008; Omont et al. 2011; van der Werf et al. 2011; Bradford et al. 2011). Understanding the role of H2O in the local Universe will thus aid any interpretation of such high-redshift observations.
In the near Universe, a small sample of CONs have been identified with deep mid-IR silicate absorption and hot optically thick dust cores (e.g., Aalto et al. 2012; Costagliola & Aalto 2010; Costagliola et al. 2013; González-Alfonso et al. 2015; Sakamoto et al. 2010, 2013). We have used the Photodetector Array Camera and Spectrometer (PACS; Poglitsch et al. 2010) and the Spectral and Photometric Imaging Receiver (SPIRE; Griffin et al. 2010) onboard the Herschel Space Observatory (Pilbratt et al. 2010) to observe H2O and OH in the CON Zw 049.057, which is an OH megamaser (Baan et al. 1987) and has moderate IR-luminosity (LIR ≈ 1.8 × 10¹¹L⊙Sanders et al. 2003), a very rich molecular spectrum in the far-IR and submillimeter, and a compact molecular distribution (Planesas et al. 1991). Its NICMOS image (Scoville et al. 2000) reveals a narrow dust feature emerging along the minor axis from the obscured nucleus. Scoville et al. (2000) also suggest that the feature might be due to a nuclear absorbing cloud that blocks the light along the minor axis. Based on radio observations, Baan & Klöckner (2006) classified Zw 049.057 as an AGN, but it is only weakly detected in X-rays (Lehmer et al. 2010). Mid-infrared observations with Spitzer have revealed strong silicate absorption (Pereira-Santaella et al. 2010) and far-IR ISO observations indicated that the LIRGs Zw 049.057, NGC 4418, and IC 860 are all [C II] deficient (Malhotra et al. 1997).
Our interest in this galaxy was originally sparked by the SPIRE FTS observations (see Sect. 2.4), which revealed a rich molecular spectrum with H2O rotational lines that are comparable in strength to and, in some cases, stronger than the CO rotational lines. Modeling then raised the possibility that Zw 049.057 has an extremely obscured nucleus with an embedded power source, possibly a young AGN. Very little is known about the obscured growth of AGNs, so that finding and identifying such objects is an important step in our understanding of galaxy evolution.
The Herschel observations are described in Sect. 2, and our models are shown in Sect. 3. The model results are discussed in Sect. 4, and our main conclusions are summarized in Sect. 5.
2. Observations and results
Zw 049.057 was observed using the PACS and SPIRE spectrometers onboard the Herschel Space Observatory. The PACS observations1 were conducted as part of the Hermolirg OT2 project (PI: González-Alfonso) on 2012 July 20 in high spectral sampling range spectroscopy mode using first and second orders of the grating. The data reduction was done with the Herschel interactive processing environment (HIPE; Ott 2010) version 12.1.0 using the PACS background normalization pipeline for short range scans. At a distance of 56 Mpc, the far-IR nuclear emission of Zw 049.057 is spatially unresolved in the central 9.1′′ (~2.5 kpc) spaxel of the 5 × 5 spaxel integral field array. Since the point spread function (PSF) is larger than the central spaxel, to obtain the full flux we extracted the central spectrum using the point source correction task in HIPE 12.1.0. In each spectral range scan the continuum was then subtracted using polynomials of third order or lower and the lines were fitted with Gaussian profiles. Line fluxes, measured and inferred intrinsic Gaussian line widths, and continuum levels for the PACS observations are listed in Table 1.
H2O, OH, and 18OH lines detected with PACS.
The corresponding SPIRE observations2 were conducted as part of the OT key program Hercules (PI: van der Werf) on 2011 January 6 in high spectral resolution, single pointing, and sparse image sampling mode. A total of 108 repetitions (216 FTS scans) were carried out, giving an on-source integration time of 14 386 s. The data were processed using the standard point-source pipeline in HIPE 12.1.0. After subtracting the continuum with a third order polynomial in each of the two bands, we measured the fluxes of the identified (≥3σ level) lines by simultaneously fitting the lines with line profiles consisting of a convolution of the FTS full resolution instrumental response (a sinc function) with the best fit Gaussian line profile of the emission from the galaxy. The full SPIRE FTS spectrum is presented in Sect. 2.4. Line fluxes and continuum levels for the H2O lines observed with SPIRE are listed in Table 2. In addition to the SPIRE observations, the Hercules program also included PACS observations of the [O I] 63μm line3. These observations were conducted on 2010 February 11.
The spectral energy distribution (SED) of the source is shown in Fig. 1, including the Spitzer/IRS spectrum (Armus et al. 2009), and photometric data points from IRAS (Sanders et al. 2003) and SCUBA (Dunne et al. 2000). Note the strong silicate absorption at 9.7 and 18μm reported by Pereira-Santaella et al. (2010).
H2O and H O lines detected with SPIRE.
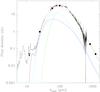 |
Fig. 1 Spectral energy distribution of Zw 049.057 from mid-IR to millimeter wavelengths. Data from Herschel/PACS, Herschel/SPIRE, and Spitzer/IRS are shown. The IRAS data points at 25, 60, and 100μm as well as the upper limit at 12μm come from Sanders et al. (2003), the (sub)millimeter points at 850 and 1250μm are from Dunne et al. (2000) and Carico et al. (1992), respectively. The models discussed in Sect. 3 are included where the blue and light blue curves represent the core and outer components, respectively. The green curve is an extra component to fit the continuum. Red is the total model. |
Spectroscopic parameters for OH and H2O (both ortho and para) used for line identification and radiative transfer modeling were taken from the JPL (Pickett et al. 1998) and CDMS (Müller et al. 2001, 2005) catalogs. Energy level diagrams for the three species are shown in Fig. 2, where the transitions that were detected are indicated by blue and green arrows for PACS and SPIRE respectively. The detected transitions include H2O lines in absorption with lower level energies Elower> 600 K (H2O 707 → 616 and 717 → 606), in emission with upper level energies also above 600 K (H2O 523 → 514), and OH lines with lower level energy Elower> 400 K (OH  ), indicating extreme excitation similar to that in Arp 220 (González-Alfonso et al. 2012). Observations of highly excited H2O over the broad spectral range provided by the combination of PACS and SPIRE give us an unique opportunity to constrain the parameters of the underlying continuum source with unprecedented accuracy. Note that the lines in the PACS range are all detected primarily in absorption while the lines detected with SPIRE are mainly observed in emission, indicating that the rotational levels are pumped at far-IR wavelengths and then relaxed by emission in the submillimeter (González-Alfonso et al. 2010, 2014a). The analysis performed by González-Alfonso et al. (2014a) further indicates that the absorptions are most efficiently produced close to the continuum source while the low-excitation (Eupper< 400 K) emission lines are formed in regions further away with less dust extinction, and as a result the combination of these wavelength ranges provides us with information on the source structure.
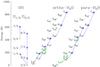 |
Fig. 2 Energy level diagrams of OH and H2O (ortho and para). Blue arrows indicate lines observed with PACS and green arrows denote lines observed with SPIRE. |
2.1. H2O
Ten transitions of H2O with lower level energies up to ~650 K, were detected with PACS as summarized in Table 1. The high excitation in the lines indicates that they might be radiatively excited (e.g., González-Alfonso et al. 2004, 2008, 2012) and can be used to constrain the properties of the underlying continuum source. The spectral scans of the H2O lines are shown in Fig. 3. The absorption is not as strong as in NGC 4418, but is comparable to that of Arp 220 (González-Alfonso et al. 2012). In addition, nine transitions with upper level energies up to ~650 K were detected primarily in emission with SPIRE as summarized in Table 2. The spectral line energy distribution of the submillimeter lines is shown in Fig. 4. As mentioned earlier, the emission lines with upper level energies Eupper< 400 K have been shown to trace regions with low dust extinction, while the two detected emission lines with higher Eupper are found to form in very warm (>80 K) regions with higher dust extinction (González-Alfonso et al. 2014a). Most of the lines are uncontaminated by other species, but the H2O 312 → 221 line is blended with the CO J = 10−9 transition and is not used in the analysis of the excitation.
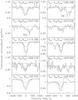 |
Fig. 3 H2O lines observed in Zw 049.057 with PACS. The black histograms are the observed, continuum-normalized, spectra. Model results from Sect. 3 are also included. The blue curve denotes the model for Ccore, which was constrained using the high-lying H2O lines detected with PACS. The light-blue curve denotes the model for Couter, which was constrained using the H2O lines detected with SPIRE. The red curve denotes the sum of these two models. |
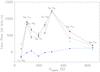 |
Fig. 4 Spectral line energy distribution of the H2O lines detected with SPIRE, the black curve represents the data. For the 111 → 000 line, only the absorption part is included. The line with upper energy level 249 K is 312 → 303. Model predictions are included, the blue and light-blue curves show the contribution from Ccore and Couter, respectively. The red curve indicates the sum of the fluxes predicted by the two models. |
2.1.1. P-Cygni profile in H2O 313 → 202
Although some lines appear shifted relative to the systemic velocity we find no systematic velocity shift, with some lines slightly shifted to the red and others to the blue. Also, within 2σ, all but two H2O lines peak at the galaxy redshift. The 313 → 202 line at 138μm does however exhibit an apparent P-Cygni profile, possibly indicating an outflow. Signatures of this are not seen in any of the other PACS lines but out of our detected H2O absorption lines, 313 → 202 is the one with the longest wavelength. It is thus the line that is least affected by dust extinction and it is possible that the redshifted emission traces an outflow in the outer component on the far side of the galaxy that cannot be seen in the lines at shorter wavelengths, including the nearby 221 → 110 line at 108μm, due to extinction. A possible explanation for the difference in character of the two nearby lines, is that the 221 → 110 line, which is lower in energy, is also tracing the infall seen in the [O I] 63μm line (see Sect. 2.3), in which case the redshifted absorption and emission could cancel. In fact, the profile of the 221 → 110 line is slightly asymmetric, with less absorption on the redshifted side. The only H2O line detected in absorption in SPIRE (H2O 111 → 000, see insert in Fig. 8) tentatively exhibits a profile similar to the H2O 313 → 202 line, with absorption at zero velocity and a redshifted emission component.
2.1.2. H O
O
Two transitions in the isotopologue HO were also detected with SPIRE: 220 → 211 and 321 → 312 with upper level energies of 194 and 303 K, respectively. While the 321 → 312 line seems to be uncontaminated by other species, the 220 → 211 is likely to be affected by the sinc profile of the nearby H2O 422 → 413 line.
2.2. OH
Five OH doublets with lower level energies up to >400 K were detected with PACS, they are summarized in Table 1. The spectral scans of these lines are shown in Fig. 5, together with that of the undetected Π1/2 3/2 → 1/2 doublet at 163 μm. Again, the absorptions are not as strong as in NGC 4418, but in the most excited lines they are almost comparable to those in Arp 220 (González-Alfonso et al. 2012).
The doublet at 65 μm might have weak contamination by H2O 625 → 514 in the blue Λ-component and the 84 μm doublet might be weakly contaminated by NH3(6,4)a → (5,4)s and (6,5)a → (5,5)sin the red Λ-component.
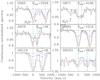 |
Fig. 5 OH lines observed in Zw 049.057 with PACS. The black histograms are the observed, continuum-normalized, spectra. Model results from Sect. 3 are also included. The blue curve denotes the model for Ccore, which was first constrained using the high-lying H2O lines detected with PACS, but with an added OH column that was varied in order to also fit the high-lying OH lines. The light-blue curve denotes the model for Couter, which was first constrained using the H2O lines detected with SPIRE, but with an added OH column that was varied in order to also account for the residual flux in the low-lying OH lines. The red curve denotes the sum of these two models. |
18OH
Two doublets of the isotopologue 18OH were also detected: Π1/2 7/2 → 5/2 at 85 μm and Π3/2 5/2 → 3/2 at 120 μm. The spectral scans of these lines are shown in Fig. 6, together with that of the undetected Π3/2 9/2 → 7/2 doublet at 65 μm. The blue Λ-component of the 120 μm doublet is strongly contaminated by CH+ 3–2. Although the absorption in the main isotopologue generally seems to be weaker than observed in NGC 4418 by González-Alfonso et al. (2012), the 18OH absorption is stronger in Zw 049.057. This is the same situation as González-Alfonso et al. (2012) found in Arp 220, likely indicating enhancement of 18O in Zw 049.057 as was inferred for Arp 220.
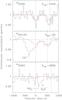 |
Fig. 6 18OH lines observed in Zw 049.057 with PACS. The black histograms are the observed, continuum-normalized, spectra. Model results from Sect. 3 are also included. The red curve denotes the model for Ccore, which was first constrained using the high-lying H2O lines detected with PACS, but with an added 18OH column that was varied in order to fit the 18OH lines. |
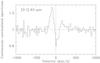 |
Fig. 7 Line profile of the [O I] 63 μm line detected with PACS. The reversed P-Cygni profile in this line is a typical signature of infalling gas. |
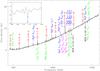 |
Fig. 8 Full SPIRE FTS spectrum of Zw 049.057. Line identifications for ≥3σ detections are given in red for CO lines, in blue for H2O, in magenta for H |
2.3. [O I] 63 μm
The spectral scan of the [O I] 63μm line is shown in Fig. 7, note the prominent reversed P-Cygni profile, a typical signature of infalling gas. We do not attempt to model this line, but it provides important information about the kinematics on scales larger than the molecular components in our models.
2.4. Full SPIRE FTS spectrum
The full SPIRE FTS spectrum of Zw 049.057 is shown in Fig. 8. Because of the excellent match in the overlap region of the two spectrometer bands (~950–1020 GHz), they were simply averaged in this region. The spectrum shows at least 30 lines detected at a 3σ level or higher. Most of the CO ladder is detected with nine lines from CO J = 4−3 to J = 12−11 (Greve et al. 2014; Rosenberg et al. 2015). In addition, nine rotational lines of H2O are detected together with two rotational lines of HO. The two [C i] fine structure lines and the [N ii] fine structure line as well as two rotational transitions of HCN are also detected. Finally, one rotational transition of NH3 as well as one of HF, and at least three transitions of NH2 are detected. There are hints of absorption accompanied with redshifted emission at the positions of the two OH+ lines at 972 and 1033 GHz, but the noise in this region is too high for an unambiguous detection. Much stronger OH+ lines have been observed in emission in Mrk 231 (van der Werf et al. 2010) and with P-Cygni profiles in Arp 220 (Rangwala et al. 2011). The relative strength of the H2O lines with respect to the CO lines is greater in Zw 049.057 than in Mrk 231 and comparable to that seen in Arp 220. The lines are detected superposed on a continuum that drops towards the long wavelength side, and represents the Rayleigh-Jeans tail of the dust emission in Zw 049.057.
Parameters of the continuum models.
Derived H2O column densities and abundances, and column density ratios.
3. Models
As shown by the data presented in Sect. 2 the far-IR PACS spectra of Zw 049.057 are dominated by molecular absorption, with only a few emission features, while the opposite is true for the submillimeter SPIRE spectrum. Because the absorption and emission lines of H2O require different physical conditions to form (González-Alfonso et al. 2014a), the galaxy must contain regions of different interstellar medium (ISM) parameters to produce these rich line spectra and their associated dust continua. We attempt to model these regions using the smallest possible number of parameterized components. In doing so, we use the spherically symmetric radiative transfer code described in González-Alfonso & Cernicharo (1997, 1999), including line overlaps between between the Λ-components of the OH doublets in calculations for OH. Dust emission is simulated by using a mixture of silicate and amorphous carbon grains with optical constants from Draine (1985) and Preibisch et al. (1993), the adopted mass absorption coefficient as a function of wavelength is described in González-Alfonso et al. (2014a). Rates for collisional excitation of H2O are taken from Dubernet et al. (2009) and Daniel et al. (2011) while the rates for OH were taken from Offer et al. (1994). Note that the modeled regions are spatially unresolved by the Herschel beams.
We find that at least two components are needed to fit the line absorption/emission and the continuum at wavelengths ≲60 μm. Depicted for the continuum in Fig. 1: a compact warm component (blue curve, hereafter Ccore) to account for the high-lying H2O lines and a larger cool component (light blue curve, Couter) to account for the low-lying OH lines as well as most of the flux in the submillimeter emission lines. The two components that account for all H2O and OH absorption/emission lines cannot, however, reproduce the observed continuum at λ > 60μm, so that an additional cold (Td = 30 K) continuum component is added in Fig. 1 (green curve) to fit the whole SED. This extra component has no associated H2O/OH spectrum, which is expected given the relatively high Td required to excite these species. The parameters inferred for the two H2O/OH components are listed in Tables 3 and 4. In addition to these components, an even hotter and more compact component would be needed to fit the emission at wavelengths shorter than ~10 μm as was also found for NGC 4418 and Arp 220 by González-Alfonso et al. (2012).
3.1. Outline of the modeling
In the following models we have assumed a standard gas-to-dust ratio of ~100 as found in the central regions of other LIRGs by Wilson et al. (2008). The high excitation in the molecular lines detected in absorption towards the nucleus cannot be accounted for by collisions alone, strongly suggesting that the dominant excitation mechanism is absorption of radiation emitted by warm dust as in the nuclear regions of Mrk 231, Arp 220, and NGC 4418 (González-Alfonso et al. 2004, 2008, 2010, 2012). Our models indeed indicate that collisional excitation in the core component described below is negligible in comparison with radiative excitation for reasonable densities and gas temperatures (nH2 ≲ 5 × 106 cm-3, Tgas ≲ 500 K), and thus our model results are insensitive to Tgas. In the outer component, where the radiation field is weaker, collisional excitation is expected to have some impact on the low-lying submillimeter H2O lines (Sect. 3.3 below), but the excitation of the high-lying lines is dominated by radiative pumping. The excitation thus provides important clues about the properties of the continuum source and about the column densities of H2O and OH. In all models the molecules are mixed with the dust, but as in Arp 220 (González-Alfonso et al. 2012) the models indicate that most of the absorption is formed in the outer layers of the far-IR source where the continuum optical depth is ≲1. The molecular column densities are therefore given for the outermost region in which τ50 = 1, where τ50 is the dust opacity at 50μm as measured from the observer. In case a model over predicts the flux density at 25μm, it is attenuated by a foreground absorbing shell parameterized by its dust opacity at 25μm. Evidence for such an absorbing layer comes from the strong silicate absorption at 9.7μm (Pereira-Santaella et al. 2010) as well as from the absorption in the [O I] 63μm line (see Fig. 7). The total attenuated luminosity is however never allowed to exceed 1011.27L⊙, which is the total IR-luminosity of the galaxy (Sanders et al. 2003). Details of the modeling are discussed in Sects. 3.2 and 3.3.
In the models for the Ccore component, where collisional excitation is negligible, the line ratios depend on the following free model parameters: the dust temperature (Td), the column of dust (parameterized by the continuum optical depth at 100 μm, τ100), the column density of H2O per unit of τ50 (NH2O/τ50), and the velocity dispersion (ΔV, which is fixed, and derived from the observed line widths). In addition, absolute line and continuum fluxes depend on the size of the component (parameterized by the radius R, see Tables 3 and 4). As pointed out above, results of the models for the Couter component are also sensitive to the collisional excitation, and thus also depend on nH2 and Tgas. For these latter parameters, we adopt the results by Mangum et al. (2013a,b, Tgas = 200 K and nH2 = 105 cm-3.
Our fitting strategy was the following: we developed a grid of models for H2O in both the Ccore and Couter components (some illustrative results are shown in Figs. 9 and 10) by varying Td, τ100, and NH2O/τ50. Since both the Ccore and Couter components generally contribute to the flux of a given H2O line, we fitted all far-IR and submillimeter H2O lines simultaneously by combining different parameters for Ccore and Couter. Once the best model fit for Ccore and Couter was obtained from all H2O lines, the same components were applied to OH by varying only the OH column in both components.
3.2. The core component
The best constraints on the dust temperature (Td) and column density (NH2O) come from the high-lying lines of H2O, which are expected to be radiatively excited. In Fig. 9 we compare the observed and modeled fluxes of some of the highly excited lines, normalized to the flux in the 423 → 312 line. This line is chosen as the normalization because it is detected with high signal-to-noise and its lower level is high enough in energy for the line to remain relatively unaffected by extended low-excitation H2O. The modeled ratios are plotted as a function of Td and NH2O/τ50. We ran the models in Fig. 9 both with and without collisions included and found that the line ratios are unaffected by collisional excitation for nH2 ≲ 5 × 106 cm-3 and Tgas ≲ 500 K. For higher densities and gas temperatures the submillimeter H2O 111 → 000 line will go into strong emission, which is not seen in the SPIRE spectrum. Line broadening is modeled by microturbulence with vtur = 60 km s-1.
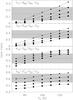 |
Fig. 9 Modeled H2O line ratios in Ccore as a function of dust temperature. Triangles, squares, pentagons, and circles show results for H2O columns per unit of τ50 of 2 × 10¹⁸, 1 × 10¹⁸, 5 × 10¹⁷, and 2.5 × 1017 cm-2, respectively. Dashed lines indicate the observed ratios and the dotted lines are their 1σ uncertainties. |
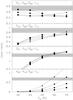 |
Fig. 10 Modeled H2O line ratios in Couter as a function of dust temperature. Triangles, squares, pentagons, and circles show results for H2O columns per unit τ50 of 8 × 10¹⁷, 4 × 10¹⁷, 2 × 10¹⁷, and 1 × 10¹⁷, respectively. In all models τ100 = 1. Dashed lines indicate the observed ratios and the dotted lines are their 1σ uncertainties. The contribution from Ccore is not included in this figure, but it is expected to slightly raise the 211 → 202/ 202 → 111 and 422 → 413/ 202 → 111 ratios. The overall best fit, including the core contribution, is shown in Fig. 4 |
The relative fluxes of the high-lying lines can be well fitted with dust temperatures between Td = 90 and 130 K and column densities per τ50 between NH2O/τ50 = 2 × 10¹⁸ and 5 × 1017 cm-2, although not all combinations of Td and NH2O/τ50 in this range produce a good fit. A lower dust temperature could also be used to fit the absorptions if a higher column density is used, but then the submillimeter emission lines 422 → 413 and 523 → 514 would be over predicted. In order to fit the absolute line fluxes the modeled region must have a radius between 32 and 12 pc. At these temperatures and radii, a foreground absorbing shell with an opacity between τ25 = 2.1 and τ25 = 2.4 is required in order to fit the flux density at 25μm.
The dust opacity is best constrained by the high-lying submillimeter emission lines. With the column densities and temperatures required to fit the absorptions in the far-IR the emission line with the highest upper level energy, 523 → 514, would be over predicted for τ100 ≲ 5 and under predicted for τ100 ≳ 15. In order to fit the low-lying submillimeter lines of H2O an additional, less optically thick component is required, which is discussed in Sect. 3.3.
To fit the high-lying OH lines we used the model parameters derived for H2O and varied the column density of OH to fit the observed line fluxes. We find the best fit for OH/H2O ratios of 0.4−0.8, higher OH column densities over predict the  doublet at 71μm while lower column densities do not produce enough absorption in the
  doublet at 65μm. To fit the low-lying OH lines another component, which is discussed in Sect. 3.3, is required. The doublets of the isotopologue 18OH require high column densities in order to obtain a good fit. We find that an 16OH/18OH ratio of 50−100 is required to reproduce the absorption doublet at 120μm while the one at 85μm is slightly under predicted.
The contribution of the core component to the total model is shown in blue in Figs. 1 and 3–6. In this reference model we have used Td = 120 K, NH2O/τ50 = 1 × 1018 cm-2, τ100 = 10, R = 14 pc, OH/H2O = 0.75, and 16OH/18OH = 75.
3.3. The outer component
To adequately fit the emission in the submillimeter H2O lines and the absorption in the low-lying OH lines another, less excited, component is required. This component also accounts for the remaining flux in the lower-lying H2O absorption lines, which are under predicted by the core component alone. In Fig. 10 we compare the observed and modeled fluxes of some of the submillimeter lines, normalized to the flux of the 202 → 111 line. The core component is expected to provide extra emission in the 211 → 202 and 422 → 413 lines. Some of the submillimeter lines, for example H2O 422 → 413, are however still not reproduced, probably indicating a transition region between the two components where the emission in these lines is still significant. In this component we find that the ratios of the lowest lying lines are significantly altered by collisional excitation, in the models shown here we have adopted a gas temperature Tg = 200 K and a density nH2 = 105 cm-3 as derived by Mangum et al. (2013a,b) based on observations of formaldehyde and ammonia. A potential caveat is that they did not consider IR pumping when estimating their temperatures. The main effect of increasing the density is to strengthen the low-lying H2O 111 → 000 and 202 → 111 lines at the expense of the H2O 321 → 312 line. With a higher density the two lower lines would be over predicted while a lower density produces too much emission in the H2O 321 → 312 line.
In order to reproduce the line ratios, we find that a dust temperature between Td = 45 and 60 K and column densities per τ50 between NH2O/τ50 = 2 × 10¹⁷ and 8 × 1017 cm-2 are required. The line ratios are also sensitive to the dust opacity, we find that the ratios can be reproduced with τ100 from 0.5 to 2. In order to reproduce the absolute fluxes the component must have a radius of 90 to 50 pc. The line widths are still best reproduced using vtur = 60 km s-1.
The submillimeter HO 321 → 312 line is mainly formed in the outer component, requiring an abundance ratio 16O/18O ≲ 50 in water. With this ratio for OH, the 18OH 120μm doublet would be overestimated by a factor ~2, but the 18OH 85μm doublet would be better reproduced than in our reference model (Fig. 6). We thus favor a range 16O/18O = 50−100, with enhanced 18O abundance in both the core and outer components.
The OH lines are again fitted with the model derived for the H2O excitation. In this component a OH/H2O ratio of 0.1 to 0.4 is required to fit the low-lying OH lines. With higher OH column densities the undetected doublet at 163μm is over predicted.
The contribution of the outer component to the total model is shown in light blue in Figs. 1 and 3–6. In this reference model we have used Td = 55 K, NH2O/τ50 = 4 × 1017 cm-2, τ100 = 1, R = 60 pc, and OH/H2O = 0.2.
3.4. Model uncertainties
We have ignored all inner structure in the modeled components by adopting uniform densities and dust temperatures throughout the models. The approximation of spherical symmetry is also clearly inaccurate, the NICMOS image of Zw 049.057, for example, exhibits a linear structure extending for hundreds of parsecs (Scoville et al. 2000). For the absorption lines, geometry should however be secondary as the important property is the projected surface of the underlying optically thick far-IR source. Our models should nevertheless be considered as very simplified versions of the real structures.
The dust temperature in Ccore is well constrained as high temperatures are required for the radiatively excited high-lying lines to form. In Couter we expect that collisional excitation is also important and Td is here less certain than in Ccore. Due to dust extinction, the absorption lines are sensitive to the molecular column densities only in the outer layers of the core where τ50 ≲ 1. In these layers they are however fairly certain and present robust lower limits to the total column densities of the source. The conversion of τ100 to a column density of H2 depends on the adopted gas-to-dust ratio as well as the dust properties. This uncertainty is propagated to the molecular abundances, which of course depend on the column of H2. Abundance ratios between different species are more certain as the various abundances are calculated in the same way.
4. Discussion
Physical conditions in other objects for comparison.
4.1. The dust and gas components of Zw 049.057
As described in Sect. 3 above we can fit the spectral line data with two components whose properties are summarized in Tables 3 and 4. For comparison, Table 5 contains a summary of physical conditions in some other galaxies as well as in some Galactic regions.
Compared to giant molecular clouds (GMCs) in the Galaxy, Ccore is comparable in size but significantly hotter as well as more massive and luminous (Scoville & Good 1989). Although cooler and less dense, it shows strong similarity to the compact hot core found in the LIRG NGC 4418 (González-Alfonso et al. 2012). The physical conditions are also very similar to those in the western nucleus of the ULIRG Arp 220, which is a few times as big as Ccore (González-Alfonso et al. 2012).
The outer component is larger than a typical GMC and is (again) significantly more massive and luminous, its dust temperature is however comparable to the peak temperature found in H II-region GMCs (Scoville & Good 1989). An interesting comparison is with the Galactic Center – where a mass of a few times 107M⊙ of molecular gas is distributed on a scale of 200−500 pc (Scoville & Sanders 1987; Cox & Laureijs 1989; Morris & Serabyn 1996; Dahmen et al. 1998; Ferrière et al. 2007). Thus the nuclear region of Zw 049.057 appears to be dramatically different from the center of our own galaxy, with an order of magnitude more molecular gas concentrated on scales comparable to a large GMC.
4.2. Abundances and column densities toward Zw 049.057
All abundances derived for Zw 049.057 are summarized in Table 4. For comparison, a summary of abundance estimates in other galaxies and selected Galactic regions is tabulated in Table 5.
4.2.1. H2O abundances
We find high abundances of H2O in Ccore – lower in Couter. In the compact inner component the H2O abundance is similar to those found in the core component of NGC 4418 and the western nucleus of Arp 220 (González-Alfonso et al. 2012). There are no regions in the Galaxy where an H2O abundance this high has been found over comparable scales. On smaller scales abundances comparable to, and higher than, that in Ccore have been found in hot cores and shocked regions (e.g., Melnick et al. 2010; Emprechtinger et al. 2013; Visser et al. 2013; Busquet et al. 2014). Comparing it to more extreme objects further out in the Universe we see that Zw 049.057 has a H2O abundance exceeding that of the H2O rich z = 3.91 quasar APM 08279+5255 (Bradford et al. 2011).
In the outer component, Couter, we find H2O abundances on the order of 10-6. This is similar to the abundances found by González-Alfonso et al. (2010, 2012) in the warm component of Mrk 231 and the eastern nucleus of Arp 220, respectively. In the Galaxy, similar H2O abundances have been found, for example, in the denser regions of Sgr B2 by Cernicharo et al. (2006) and the warm shocked region of L1157-B1 by Busquet et al. (2014).
4.2.2. Why is there so much water in Zw 049.057?
The high H2O abundance in the core component is a robust result so we will focus our discussion here. There are three main scenarios which can explain H2O abundances this high: ion-neutral reactions starting with cosmic-ray (or X-ray) ionization of H2 (van Dishoeck et al. 2013), neutral-neutral reactions in warm (T ≳ 250 K) gas (Neufeld et al. 1995; Ceccarelli et al. 1996; van Dishoeck et al. 2013), and sublimation of H2O from dust grains as the dust temperature rises above ~100 K (Sandford & Allamandola 1990; Fraser et al. 2001; van Dishoeck et al. 2013). If the high H2O abundance is due to the first of these processes it can persist as long as the temperature of the gas remains high enough. If it is due to sublimation from dust grains however, the abundance will eventually decrease unless there is an efficient formation process to counter H2O destruction by, for example, ion-neutral reactions.
The model of Ccore indicates that the dust temperature is slightly higher than that required for rapid sublimation to occur while the gas temperature (189 ± 57 K) as estimated by Mangum et al. (2013b) is somewhat lower than that needed for neutral-neutral reactions to be effective. Also, we know that an additional, hotter, component is needed to model the continuum at wavelengths <10 μm. Formation of H2O via ion-neutral reactions may contribute to the high abundances, but the branching ratios in the dissociative recombination of H3O+ favor OH (Herd et al. 1990; Jensen et al. 2000; Neufeld et al. 2002) while we infer more H2O than OH in both components.
In view of the uncertainties above, we are unable to determine which one of the processes is responsible for the high H2O abundance, and a combination is most likely. One way to test the grain chemistry would be to search for CH3OH, which seems to be mainly formed through hydrogenation of CO on grain surfaces (Wirström et al. 2011).
4.2.3. OH abundances
The OH abundance found in Ccore is, like the H2O abundance, similar to those found in the core of NGC 4418 and the western nucleus of Arp 220 by González-Alfonso et al. (2012). We also find that the abundance of OH seems to vary less than the H2O abundance between Ccore and Couter. For Galactic sources we found fewer estimates of OH abundances, but there are regions around Sgr B2 and the Orion nebula that have abundances that are comparable to those in Ccore and Couter (Goicoechea & Cernicharo 2002; Goicoechea et al. 2006).
4.3. A Compton-thick nucleus in Zw 049.057?
A source is, by definition, Compton-thick if the column density of the obscuring matter is equal to or greater than the inverse of the Thomson cross-section, i.e., if  cm-2. The column density that we find in Ccore is thus enough to make the nucleus Compton-thick and a buried X-ray source would be difficult to detect. In order to penetrate the obscuring layers and probe the nuclear energy source in Zw 049.057 observations in hard X-rays or even soft gamma rays are therefore needed.
The highly obscured nature of Zw 049.057 makes it difficult to unambiguously determine the source of its nuclear luminosity. Below we investigate two possible scenarios.
4.3.1. Obscured AGN
A possible AGN in Zw 049.057 was indicated by Baan & Klöckner (2006) based on radio observations and their nuclear classification code. With the extreme column density indicated by our model a hidden AGN is also allowed despite the relatively weak X-ray luminosity observed by Lehmer et al. (2010) with Chandra. A way to keep a high covering factor for the obscuring matter has been proposed by Fabian et al. (1998). They suggested a model in which a nuclear starburst both feeds the central black hole and hides it by injecting the energy needed to keep the obscuring matter in a highly turbulent and space-covering state. In this scenario the nucleus stays in the obscured state until the accreting black hole has grown to a certain limit were the accretion rate approaches the Eddington limit and the obscuring matter is blown away from the nucleus.
If all of the luminosity in Ccore comes from an accreting black hole we can derive a lower limit to its mass of ~ 3.8–5.6 × 10⁶M⊙ by assuming that it radiates at its Eddington limit. In reality, due to the high optical depth of the dust continuum the limit on the mass can actually be up to 500 times higher (Fabian et al. 2008).
The similarity with the western nucleus of Arp 220, suggested by some authors to harbor a hidden AGN, warrants a detailed comparison. A central concentration of hard X-ray emission in the western nucleus of Arp 220 was found by Clements et al. (2002) using Chandra X-ray imaging. Several possible scenarios for this emission are offered, including a weak AGN contributing less than 1% to the bolometric luminosity of the galaxy. They also state that they cannot rule out the possibility that they are just seeing a small fraction of the emission from an obscured AGN and refer to the hard X-ray BeppoSAX observations by Iwasawa et al. (2001) who found that a column higher than ~1025 cm-2 is required if a large fraction of the bolometric luminosity comes from an AGN. Based partly on the very high surface brightness of 5 × 10¹⁴L⊙ kpc-2 on a scale of 35 pc found in their millimeter interferometer observation, Downes & Eckart (2007) concluded that the source of the luminosity in the western nucleus of Arp 220 can only be a black hole accretion disk. They also estimated that the total proton column density towards the western nucleus is ~1.3 × 1025 cm-2, enough to hide the hard X-rays from an energetically important AGN. In addition, Takano et al. (2005) found absorption lines of NH3 with full widths at zero intensity of up to 1800 km s-1 possibly due to rotating gas in an AGN. Sakamoto et al. (2008), however, do not exclude that the luminosity is primarily powered by a young starburst equivalent to hundreds of super star clusters.
Zw 049.057, on the other hand, was undetected in hard X-rays in the Chandra observations by Lehmer et al. (2010). However, as already stated, our models indicate that the column density towards the center of Zw 049.057 may be as high as 1025 cm-2, comparable to that in Arp 220. Observations by Mangum et al. (2013b) reveals that Zw 049.057 also has NH3 absorption lines. These are however not nearly as wide as those seen in Arp 220. High spatial resolution observations at millimeter wavelengths, like those of Downes & Eckart (2007), has not been carried out for Zw 049.057. Doing this would be one way to truly test how much it actually resembles the western nucleus of Arp 220, and possibly also to determine if it is powered by an AGN or a central starburst.
4.3.2. Starburst
Another possible candidate for the nuclear power source is a compact starburst. Veilleux et al. (1995) classified Zw 049.057 as an H ii galaxy based on optical emission line ratios in the nucleus of the galaxy. Based on mid-IR observations (Stierwalt et al. 2013; Inami et al. 2013) it is also located in the starburst region in the diagnostic diagram by Spoon et al. (2007) as well as in mid-IR emission line diagrams (Meléndez et al. 2014).
The core component has a luminosity of 0.7−1.2 × 10¹¹L⊙ and a radius of 12−32 pc. To put these numbers into context we can use Sgr B2(M) with its luminosity of 6.3 × 10⁶L⊙ (Goldsmith et al. 1992) and radius of ~0.6 pc (Rolffs et al. 2011) as a template. To generate the luminosity of Ccore, ~(1−2) × 104 Sgr B2(M)-like sources would be required to be packed into a volume between 0.13 and 1.25 times that of Ccore.
The surface brightness of the core component is very high, 0.4−1.5 × 10¹⁴L⊙ kpc-2. This is up to one order of magnitude higher than the limiting surface brightness in nuclear starbursts around AGN seen by Davies et al. (2007). For dust temperatures below 200 K this apparent limit for starbursts can be explained by a theoretical model in which stellar radiation pressure provides the majority of pressure support in the gas disk (Thompson et al. 2005). For hot starburst (Td> 200 K) this limit does not apply and the surface brightness can be higher than ~1013L⊙ kpc-2 (Andrews & Thompson 2011). The core component is not hot enough for this to happen, but our models do not reproduce the continuum at wavelengths <10 μm and it is possible that a hot nuclear component, which we do not model, has a dust temperature >200 K. In any case, Andrews & Thompson (2011) further state that the conditions necessary to enter this regime may only be attained in the parsec-scale star formation surrounding AGN.
Taking only the gas mass into account, our model for Ccore implies a luminosity-to-mass ratio of ~200–2000  , largely compatible with the limit of
  for a dust-embedded starburst supported by radiation pressure (Scoville 2003; Thompson et al. 2005).
4.4. In- and outflowing gas
We find a strong inverse P-Cygni profile in the [O I] 63μm line, indicating inflowing gas. No obvious evidence for such inflow is however seen in the molecular lines so the infall might take place on scales larger than the ~100 pc molecular structure. There is however a possibility that the H2O 221 → 110 line is actually tracing both infalling and outflowing gas, see the discussion in Sect. 2.1.1. The estimated 60 micron source size is ~100 pc, so the red-shifted gas motions have to occur on these (projected) scales.
A possible source of infall could be tidal debris or interactions where a galaxy accretes gas from a companion (as is the case for NGC 4418, for example; Klöckner, priv. comm.). There are several galaxies in the same field as Zw 049.057, but they seem to belong to a background cluster and are not companions of Zw 049.057. Another possibility is gas streaming in from a cooling flow similar to those seen in elliptical galaxies (Bregman & Athey 2004). Bar instabilities that acts to drive gas into the nucleus is a possible scenario but it seems unlikely since it would require rather a precise geometry.
We also find a normal P-Cygni profile in the H2O 313 → 202 line, indicative of outflowing gas. We do not see any outflow signatures in the other molecular lines however, and if the feature is real it probably traces gas outflowing on the far side of the galaxy as discussed in Sect. 2.1.1. Compared to the fastest molecular outflows seen in Herschel studies of LIRGs (e.g., Fischer et al. 2010; Sturm et al. 2011; Veilleux et al. 2013; González-Alfonso et al. 2014b) the potential outflow velocities here are moderate, with the redshifted velocity component extending to ~500 km s-1.
4.5. The 16O/18O isotopic ratio
18O is a so called secondary nuclide, produced by He burning (Maeder 1983) in massive stars and may enrich the ISM by winds and/or supernova ejecta. Hence the 16O/18O isotopic abundance ratio may reflect the stellar initial mass function (IMF) as well as the age of a burst of star formation. Low 16O/18O abundance ratios are taken to indicate the enrichment of the ISM by massive stars in a starburst. González-Alfonso et al. (2012) use this ratio to place LIRGs/ULIRGs in an evolutionary scenario where the dust enshrouded LIRG NGC 4418 (with an estimated 16O/18O ratio of 500) is placed in an early evolutionary phase, the ULIRG Arp 220 (with an estimated 16O/18O ratio of 70) is more evolved according to this scheme. The ULIRG quasar Mrk 231 has an extreme 16O/18O ratio of ≲30 (Fischer et al. 2010; González-Alfonso et al. 2014b) and hence has the most evolved starburst of the three. A caveat here is that it is assumed that all three galaxies have starbursts of a similar IMF with the same impact and ISM mixing. Note that a large 16O/18O ratio may also be a signature of a very evolved starburst where the 16O has caught up with the 18O enrichment.
We estimate a 16O/18O abundance in Zw 049.057 that is similar to or slightly higher than that in Arp 220, and this would therefore suggest that its starburst is in an evolutionary stage between NGC 4418 and Arp 220. This is difficult to validate since the nuclei are so deeply obscured that standard tracers of starburst evolution do not work. A possibility is to use the q-factor (i.e., the ratio between radio and far-IR intensity Helou et al. 1985) – but this is aggravated by the fact that Mrk 231 is a quasar so its radio emission is dominated by the jet. However, if we take the 16O/18O ratios as tracing starburst evolution and compare the “younger” NGC 4418 with the “older” Zw 049.057 we find interesting similarities between them. Both have strong infall signatures in the [O I] 63μm line suggesting that the central region of the galaxies are being replenished with new material that can feed the activity. NGC 4418 is interacting while this is not clear for Zw 049.057. Both galaxies are early type spirals where Zw 049.057 is showing evidence also of star formation on somewhat larger scales than NGC 4418. No outflow signatures are found in the gas of NGC 4418 (even though there are some hints in the dust Sakamoto et al. 2013) while Zw 049.057 is showing tentative outflow signatures.
5. Conclusions
The following results were obtained from the observations of Zw 049.057 presented in this paper:
-
PACS spectroscopy reveals absorption in highly excited states ofH2O and OH as well as in their 18O isotopologues. In total, ten H2O lines and five OH doublets with lower level energies up to Elower 600 K and Elower 400 K, respectively, were detected in absorption. Two 18OH doublets were also detected in absorption.
-
The [O I] 63 μm line exhibits an inverse P-Cygni profile indicative of infalling gas with a velocity of 30 km s-1. A P-Cygni profile in the H2O 313 → 202 line with the redshifted emission extending to 500 km s-1 was also detected.
-
SPIRE spectroscopy reveals a submillimeter spectrum that is rich in H2O. Eight H2O lines in emission and one in absorption were detected along with two H
O lines in emission. The H2O lines had upper state energies up to Elower 600 K.
We have used multicomponent radiative transfer modeling to analyze the absorption-dominated PACS spectra together with the emission-dominated SPIRE spectrum and the continuum levels. The important conclusions from this work are:
-
Very high H2 column density ((0.3−1.0) × 1025 cm-2) towards the core of Zw 049.057 indicates that it is Compton-thick. This thick nuclear medium is also responsible for the frequency degradation of the intrinsic luminosity as high energy photons are absorbed and re-emitted at longer wavelengths.
-
High H2O column density per unit of continuum optical depth at 50μm of ~1018 cm-2, an OH/H2O ratio of 0.4−0.8, and a dust temperature of 100−130 K are derived towards the same nuclear region. The molecular abundance relative to H2 in this region is also estimated to be high, χH2O ~ 5 × 10⁻⁶.
-
The high surface brightness of (0.4−1.5) × 1014L⊙ kpc-2 on a spatial scale of 10−30 pc is indicative of either a buried AGN or a very dense nuclear starburst.
-
The absorption in the 18O isotopologue of OH indicates enhancement of 18O with a low 16O/18O ratio of 50−100. If this ratio is a tracer of starburst evolution it would place the galaxy in the same phase as Arp 220, in between the less evolved NGC 4418 and the more evolved Mrk 231.
Acknowledgments
We thank the anonymous referee for a thorough and constructive report that helped improve the paper. N.F. and S.A. thank the Swedish National Space Board for generous grant support (grant numbers 145/11:1B, 285/12 and 145/11:1-3). Basic research in IR astronomy at NRL is funded by the US-ONR; J.F. acknowledges support from NHSC/ JPL subcontract 1456609.
References
- Aalto, S., Muller, S., Sakamoto, K., et al. 2012, A&A, 546, A68 [NASA ADS] [CrossRef] [EDP Sciences] [Google Scholar]
- Andrews, B. H., & Thompson, T. A. 2011, ApJ, 727, 97 [NASA ADS] [CrossRef] [Google Scholar]
- Armus, L., Mazzarella, J. M., Evans, A. S., et al. 2009, PASP, 121, 559 [NASA ADS] [CrossRef] [Google Scholar]
- Baan, W. A., & Klöckner, H.-R. 2006, A&A, 449, 559 [NASA ADS] [CrossRef] [EDP Sciences] [Google Scholar]
- Baan, W. A., Henkel, C., & Haschick, A. D. 1987, ApJ, 320, 154 [NASA ADS] [CrossRef] [Google Scholar]
- Bradford, C. M., Bolatto, A. D., Maloney, P. R., et al. 2011, ApJ, 741, L37 [NASA ADS] [CrossRef] [Google Scholar]
- Bregman, J. N., & Athey, A. E. 2004, Proc. of The Riddle of Cooling Flows in Galaxies and Clusters of galaxies, eds. T. Reiprich, J. Kempner, & N. Soker, 219 [Google Scholar]
- Busquet, G., Lefloch, B., Benedettini, M., et al. 2014, A&A, 561, A120 [NASA ADS] [CrossRef] [EDP Sciences] [Google Scholar]
- Carico, D. P., Keene, J., Soifer, B. T., & Neugebauer, G. 1992, PASP, 104, 1086 [NASA ADS] [CrossRef] [Google Scholar]
- Ceccarelli, C., Hollenbach, D. J., & Tielens, A. G. G. M. 1996, ApJ, 471, 400 [Google Scholar]
- Cernicharo, J., Goicoechea, J. R., Pardo, J. R., & Asensio-Ramos, A. 2006, ApJ, 642, 940 [NASA ADS] [CrossRef] [Google Scholar]
- Chapman, S. C., Blain, A. W., Smail, I., & Ivison, R. J. 2005, ApJ, 622, 772 [NASA ADS] [CrossRef] [Google Scholar]
- Clements, D. L., McDowell, J. C., Shaked, S., et al. 2002, ApJ, 581, 974 [NASA ADS] [CrossRef] [Google Scholar]
- Costagliola, F., & Aalto, S. 2010, A&A, 515, A71 [NASA ADS] [CrossRef] [EDP Sciences] [Google Scholar]
- Costagliola, F., Aalto, S., Sakamoto, K., et al. 2013, A&A, 556, A66 [Google Scholar]
- Cox, P., & Laureijs, R. 1989, in The Center of the Galaxy, ed. M. Morris, IAU Symp., 136, 121 [NASA ADS] [Google Scholar]
- Dahmen, G., Huttemeister, S., Wilson, T. L., & Mauersberger, R. 1998, A&A, 331, 959 [NASA ADS] [Google Scholar]
- Daniel, F., Dubernet, M.-L., & Grosjean, A. 2011, A&A, 536, A76 [NASA ADS] [CrossRef] [EDP Sciences] [Google Scholar]
- Davies, R. I., Müller Sánchez, F., Genzel, R., et al. 2007, ApJ, 671, 1388 [NASA ADS] [CrossRef] [Google Scholar]
- Downes, D., & Eckart, A. 2007, A&A, 468, L57 [NASA ADS] [CrossRef] [EDP Sciences] [Google Scholar]
- Draine, B. T. 1985, ApJS, 57, 587 [NASA ADS] [CrossRef] [Google Scholar]
- Dubernet, M.-L., Daniel, F., Grosjean, A., & Lin, C. Y. 2009, A&A, 497, 911 [NASA ADS] [CrossRef] [EDP Sciences] [Google Scholar]
- Dunne, L., Eales, S., Edmunds, M., et al. 2000, MNRAS, 315, 115 [NASA ADS] [CrossRef] [Google Scholar]
- Emprechtinger, M., Lis, D. C., Rolffs, R., et al. 2013, ApJ, 765, 61 [NASA ADS] [CrossRef] [Google Scholar]
- Fabian, A. C., Barcons, X., Almaini, O., & Iwasawa, K. 1998, MNRAS, 297, L11 [NASA ADS] [CrossRef] [Google Scholar]
- Fabian, A. C., Vasudevan, R. V., & Gandhi, P. 2008, MNRAS, 385, L43 [NASA ADS] [CrossRef] [Google Scholar]
- Ferrière, K., Gillard, W., & Jean, P. 2007, A&A, 467, 611 [NASA ADS] [CrossRef] [EDP Sciences] [Google Scholar]
- Fischer, J., Sturm, E., González-Alfonso, E., et al. 2010, A&A, 518, L41 [NASA ADS] [CrossRef] [EDP Sciences] [Google Scholar]
- Fischer, J., Abel, N. P., González-Alfonso, E., et al. 2014, ApJ, 795, 117 [NASA ADS] [CrossRef] [Google Scholar]
- Fraser, H. J., Collings, M. P., McCoustra, M. R. S., & Williams, D. A. 2001, MNRAS, 327, 1165 [NASA ADS] [CrossRef] [Google Scholar]
- Goicoechea, J. R., & Cernicharo, J. 2002, ApJ, 576, L77 [NASA ADS] [CrossRef] [Google Scholar]
- Goicoechea, J. R., Cernicharo, J., Lerate, M. R., et al. 2006, ApJ, 641, L49 [NASA ADS] [CrossRef] [Google Scholar]
- Goldsmith, P. F., Lis, D. C., Lester, D. F., & Harvey, P. M. 1992, ApJ, 389, 338 [NASA ADS] [CrossRef] [Google Scholar]
- González-Alfonso, E., & Cernicharo, J. 1997, A&A, 322, 938 [NASA ADS] [Google Scholar]
- González-Alfonso, E., & Cernicharo, J. 1999, ApJ, 525, 845 [NASA ADS] [CrossRef] [Google Scholar]
- González-Alfonso, E., Smith, H. A., Fischer, J., & Cernicharo, J. 2004, ApJ, 613, 247 [NASA ADS] [CrossRef] [Google Scholar]
- González-Alfonso, E., Smith, H. A., Ashby, M. L. N., et al. 2008, ApJ, 675, 303 [NASA ADS] [CrossRef] [Google Scholar]
- González-Alfonso, E., Fischer, J., Isaak, K., et al. 2010, A&A, 518, L43 [NASA ADS] [CrossRef] [EDP Sciences] [Google Scholar]
- González-Alfonso, E., Fischer, J., Graciá-Carpio, J., et al. 2012, A&A, 541, A4 [NASA ADS] [CrossRef] [EDP Sciences] [Google Scholar]
- González-Alfonso, E., Fischer, J., Aalto, S., & Falstad, N. 2014a, A&A, 567, A91 [NASA ADS] [CrossRef] [EDP Sciences] [Google Scholar]
- González-Alfonso, E., Fischer, J., Graciá-Carpio, J., et al. 2014b, A&A, 561, A27 [NASA ADS] [CrossRef] [EDP Sciences] [Google Scholar]
- González-Alfonso, E., Fischer, J., Sturm, E., et al. 2015, ApJ, 800, 69 [NASA ADS] [CrossRef] [Google Scholar]
- Greve, T. R., Leonidaki, I., Xilouris, E. M., et al. 2014, ApJ, 794, 142 [NASA ADS] [CrossRef] [Google Scholar]
- Griffin, M. J., Abergel, A., Abreu, A., et al. 2010, A&A, 518, L3 [Google Scholar]
- Helou, G., Soifer, B. T., & Rowan-Robinson, M. 1985, ApJ, 298, L7 [Google Scholar]
- Herd, C. R., Adams, N. G., & Smith, D. 1990, ApJ, 349, 388 [NASA ADS] [CrossRef] [Google Scholar]
- Herpin, F., Chavarría, L., van der Tak, F., et al. 2012, A&A, 542, A76 [NASA ADS] [CrossRef] [EDP Sciences] [Google Scholar]
- Ibar, E., Sobral, D., Best, P. N., et al. 2013, MNRAS, 434, 3218 [NASA ADS] [CrossRef] [Google Scholar]
- Impellizzeri, C. M. V., McKean, J. P., Castangia, P., et al. 2008, Nature, 456, 927 [NASA ADS] [CrossRef] [PubMed] [Google Scholar]
- Inami, H., Armus, L., Charmandaris, V., et al. 2013, ApJ, 777, 156 [NASA ADS] [CrossRef] [Google Scholar]
- Iwasawa, K., Matt, G., Guainazzi, M., & Fabian, A. C. 2001, MNRAS, 326, 894 [NASA ADS] [CrossRef] [Google Scholar]
- Jensen, M. J., Bilodeau, R. C., Safvan, C. P., et al. 2000, ApJ, 543, 764 [NASA ADS] [CrossRef] [Google Scholar]
- Lehmer, B. D., Alexander, D. M., Bauer, F. E., et al. 2010, ApJ, 724, 559 [NASA ADS] [CrossRef] [Google Scholar]
- Lusso, E., Hennawi, J. F., Comastri, A., et al. 2013, ApJ, 777, 86 [NASA ADS] [CrossRef] [Google Scholar]
- Maeder, A. 1983, A&A, 120, 113 [NASA ADS] [Google Scholar]
- Malhotra, S., Helou, G., Stacey, G., et al. 1997, ApJ, 491, L27 [NASA ADS] [CrossRef] [Google Scholar]
- Mangum, J. G., Darling, J., Henkel, C., & Menten, K. M. 2013a, ApJ, 766, 108 [NASA ADS] [CrossRef] [Google Scholar]
- Mangum, J. G., Darling, J., Henkel, C., et al. 2013b, ApJ, 779, 33 [NASA ADS] [CrossRef] [Google Scholar]
- Meléndez, M., Heckman, T. M., Martínez-Paredes, M., Kraemer, S. B., & Mendoza, C. 2014, MNRAS, 443, 1358 [NASA ADS] [CrossRef] [Google Scholar]
- Melnick, G. J., Tolls, V., Neufeld, D. A., et al. 2010, A&A, 521, L27 [NASA ADS] [CrossRef] [EDP Sciences] [Google Scholar]
- Morris, M., & Serabyn, E. 1996, ARA&A, 34, 645 [NASA ADS] [CrossRef] [Google Scholar]
- Müller, H. S. P., Thorwirth, S., Roth, D. A., & Winnewisser, G. 2001, A&A, 370, L49 [NASA ADS] [CrossRef] [EDP Sciences] [Google Scholar]
- Müller, H. S. P., Schlöder, F., Stutzki, J., & Winnewisser, G. 2005, J. Molecular Structure, 742, 215 [CrossRef] [Google Scholar]
- Neufeld, D. A., Lepp, S., & Melnick, G. J. 1995, ApJS, 100, 132 [NASA ADS] [CrossRef] [Google Scholar]
- Neufeld, D. A., Kaufman, M. J., Goldsmith, P. F., Hollenbach, D. J., & Plume, R. 2002, ApJ, 580, 278 [NASA ADS] [CrossRef] [Google Scholar]
- Offer, A. R., van Hemert, M. C., & van Dishoeck, E. F. 1994, J. Chem. Phys., 100, 362 [NASA ADS] [CrossRef] [Google Scholar]
- Omont, A., Neri, R., Cox, P., et al. 2011, A&A, 530, L3 [NASA ADS] [CrossRef] [EDP Sciences] [Google Scholar]
- Ott, S. 2010, in Astronomical Data Analysis Software and Systems XIX, eds. Y. Mizumoto, K.-I. Morita, & M. Ohishi, ASP Conf. Ser., 434, 139 [Google Scholar]
- Pereira-Santaella, M., Alonso-Herrero, A., Rieke, G. H., et al. 2010, ApJS, 188, 447 [NASA ADS] [CrossRef] [Google Scholar]
- Pickett, H. M., Poynter, R. L., Cohen, E. A., et al. 1998, J. Quant. Spectr. Rad. Transf., 60, 883 [NASA ADS] [CrossRef] [Google Scholar]
- Pilbratt, G. L., Riedinger, J. R., Passvogel, T., et al. 2010, A&A, 518, L1 [CrossRef] [EDP Sciences] [Google Scholar]
- Planesas, P., Mirabel, I. F., & Sanders, D. B. 1991, ApJ, 370, 172 [NASA ADS] [CrossRef] [Google Scholar]
- Poglitsch, A., Waelkens, C., Geis, N., et al. 2010, A&A, 518, L2 [NASA ADS] [CrossRef] [EDP Sciences] [Google Scholar]
- Preibisch, T., Ossenkopf, V., Yorke, H. W., & Henning, T. 1993, A&A, 279, 577 [NASA ADS] [Google Scholar]
- Rangwala, N., Maloney, P. R., Glenn, J., et al. 2011, ApJ, 743, 94 [NASA ADS] [CrossRef] [Google Scholar]
- Rolffs, R., Schilke, P., Wyrowski, F., et al. 2011, A&A, 527, A68 [NASA ADS] [CrossRef] [EDP Sciences] [Google Scholar]
- Rosenberg, M. J. F., van der Werf, P. P., Aalto, S., et al. 2015, ApJ, 801, 72 [NASA ADS] [CrossRef] [Google Scholar]
- Sakamoto, K., Wang, J., Wiedner, M. C., et al. 2008, ApJ, 684, 957 [NASA ADS] [CrossRef] [Google Scholar]
- Sakamoto, K., Aalto, S., Evans, A. S., Wiedner, M. C., & Wilner, D. J. 2010, ApJ, 725, L228 [NASA ADS] [CrossRef] [Google Scholar]
- Sakamoto, K., Aalto, S., Costagliola, F., et al. 2013, ApJ, 764, 42 [NASA ADS] [CrossRef] [Google Scholar]
- Sanders, D. B., Mazzarella, J. M., Kim, D.-C., Surace, J. A., & Soifer, B. T. 2003, AJ, 126, 1607 [Google Scholar]
- Sandford, S. A., & Allamandola, L. J. 1990, Icarus, 87, 188 [NASA ADS] [CrossRef] [PubMed] [Google Scholar]
- Scoville, N. 2003, J. Korean Astron. Soc., 36, 167 [NASA ADS] [CrossRef] [Google Scholar]
- Scoville, N. Z., & Good, J. C. 1989, ApJ, 339, 149 [NASA ADS] [CrossRef] [Google Scholar]
- Scoville, N. Z., & Sanders, D. B. 1987, in Interstellar Processes, eds. D. J. Hollenbach, & H. A. Thronson, Jr., Astrophys. Space Sci. Lib., 134, 21 [Google Scholar]
- Scoville, N. Z., Evans, A. S., Thompson, R., et al. 2000, AJ, 119, 991 [NASA ADS] [CrossRef] [Google Scholar]
- Spoon, H. W. W., Marshall, J. A., Houck, J. R., et al. 2007, ApJ, 654, L49 [NASA ADS] [CrossRef] [Google Scholar]
- Spoon, H. W. W., Farrah, D., Lebouteiller, V., et al. 2013, ApJ, 775, 127 [NASA ADS] [CrossRef] [Google Scholar]
- Stierwalt, S., Armus, L., Surace, J. A., et al. 2013, ApJS, 206, 1 [NASA ADS] [CrossRef] [Google Scholar]
- Sturm, E., González-Alfonso, E., Veilleux, S., et al. 2011, ApJ, 733, L16 [NASA ADS] [CrossRef] [Google Scholar]
- Takano, S., Nakanishi, K., Nakai, N., & Takano, T. 2005, PASJ, 57, L29 [NASA ADS] [Google Scholar]
- Thompson, T. A., Quataert, E., & Murray, N. 2005, ApJ, 630, 167 [NASA ADS] [CrossRef] [Google Scholar]
- van der Werf, P. P., Isaak, K. G., Meijerink, R., et al. 2010, A&A, 518, L42 [NASA ADS] [CrossRef] [EDP Sciences] [Google Scholar]
- van der Werf, P. P., Berciano Alba, A., Spaans, M., et al. 2011, ApJ, 741, L38 [NASA ADS] [CrossRef] [Google Scholar]
- van Dishoeck, E. F., Herbst, E., & Neufeld, D. A. 2013, Chem. Rev., 113, 9043 [NASA ADS] [CrossRef] [PubMed] [Google Scholar]
- Veilleux, S., Kim, D.-C., Sanders, D. B., Mazzarella, J. M., & Soifer, B. T. 1995, ApJS, 98, 171 [NASA ADS] [CrossRef] [Google Scholar]
- Veilleux, S., Meléndez, M., Sturm, E., et al. 2013, ApJ, 776, 27 [NASA ADS] [CrossRef] [Google Scholar]
- Visser, R., Jørgensen, J. K., Kristensen, L. E., van Dishoeck, E. F., & Bergin, E. A. 2013, ApJ, 769, 19 [NASA ADS] [CrossRef] [Google Scholar]
- Wardlow, J. L., Smail, I., Coppin, K. E. K., et al. 2011, MNRAS, 415, 1479 [NASA ADS] [CrossRef] [Google Scholar]
- Wilson, C. D., Petitpas, G. R., Iono, D., et al. 2008, ApJS, 178, 189 [NASA ADS] [CrossRef] [Google Scholar]
- Wirström, E. S., Geppert, W. D., Hjalmarson, Å., et al. 2011, A&A, 533, A24 [NASA ADS] [CrossRef] [EDP Sciences] [Google Scholar]
- Wright, C. M., van Dishoeck, E. F., Black, J. H., et al. 2000, A&A, 358, 689 [NASA ADS] [Google Scholar]
All Tables
All Figures
|
Fig. 1 Spectral energy distribution of Zw 049.057 from mid-IR to millimeter wavelengths. Data from Herschel/PACS, Herschel/SPIRE, and Spitzer/IRS are shown. The IRAS data points at 25, 60, and 100μm as well as the upper limit at 12μm come from Sanders et al. (2003), the (sub)millimeter points at 850 and 1250μm are from Dunne et al. (2000) and Carico et al. (1992), respectively. The models discussed in Sect. 3 are included where the blue and light blue curves represent the core and outer components, respectively. The green curve is an extra component to fit the continuum. Red is the total model. |
| In the text | |
|
Fig. 2 Energy level diagrams of OH and H2O (ortho and para). Blue arrows indicate lines observed with PACS and green arrows denote lines observed with SPIRE. |
| In the text | |
|
Fig. 3 H2O lines observed in Zw 049.057 with PACS. The black histograms are the observed, continuum-normalized, spectra. Model results from Sect. 3 are also included. The blue curve denotes the model for Ccore, which was constrained using the high-lying H2O lines detected with PACS. The light-blue curve denotes the model for Couter, which was constrained using the H2O lines detected with SPIRE. The red curve denotes the sum of these two models. |
| In the text | |
|
Fig. 4 Spectral line energy distribution of the H2O lines detected with SPIRE, the black curve represents the data. For the 111 → 000 line, only the absorption part is included. The line with upper energy level 249 K is 312 → 303. Model predictions are included, the blue and light-blue curves show the contribution from Ccore and Couter, respectively. The red curve indicates the sum of the fluxes predicted by the two models. |
| In the text | |
|
Fig. 5 OH lines observed in Zw 049.057 with PACS. The black histograms are the observed, continuum-normalized, spectra. Model results from Sect. 3 are also included. The blue curve denotes the model for Ccore, which was first constrained using the high-lying H2O lines detected with PACS, but with an added OH column that was varied in order to also fit the high-lying OH lines. The light-blue curve denotes the model for Couter, which was first constrained using the H2O lines detected with SPIRE, but with an added OH column that was varied in order to also account for the residual flux in the low-lying OH lines. The red curve denotes the sum of these two models. |
| In the text | |
|
Fig. 6 18OH lines observed in Zw 049.057 with PACS. The black histograms are the observed, continuum-normalized, spectra. Model results from Sect. 3 are also included. The red curve denotes the model for Ccore, which was first constrained using the high-lying H2O lines detected with PACS, but with an added 18OH column that was varied in order to fit the 18OH lines. |
| In the text | |
|
Fig. 7 Line profile of the [O I] 63 μm line detected with PACS. The reversed P-Cygni profile in this line is a typical signature of infalling gas. |
| In the text | |
|
Fig. 8 Full SPIRE FTS spectrum of Zw 049.057. Line identifications for ≥3σ detections are given in red for CO lines, in blue for H2O, in magenta for H |
| In the text | |
|
Fig. 9 Modeled H2O line ratios in Ccore as a function of dust temperature. Triangles, squares, pentagons, and circles show results for H2O columns per unit of τ50 of 2 × 10¹⁸, 1 × 10¹⁸, 5 × 10¹⁷, and 2.5 × 1017 cm-2, respectively. Dashed lines indicate the observed ratios and the dotted lines are their 1σ uncertainties. |
| In the text | |
|
Fig. 10 Modeled H2O line ratios in Couter as a function of dust temperature. Triangles, squares, pentagons, and circles show results for H2O columns per unit τ50 of 8 × 10¹⁷, 4 × 10¹⁷, 2 × 10¹⁷, and 1 × 10¹⁷, respectively. In all models τ100 = 1. Dashed lines indicate the observed ratios and the dotted lines are their 1σ uncertainties. The contribution from Ccore is not included in this figure, but it is expected to slightly raise the 211 → 202/ 202 → 111 and 422 → 413/ 202 → 111 ratios. The overall best fit, including the core contribution, is shown in Fig. 4 |
| In the text | |
Current usage metrics show cumulative count of Article Views (full-text article views including HTML views, PDF and ePub downloads, according to the available data) and Abstracts Views on Vision4Press platform.
Data correspond to usage on the plateform after 2015. The current usage metrics is available 48-96 hours after online publication and is updated daily on week days.
Initial download of the metrics may take a while.