Fig. 1
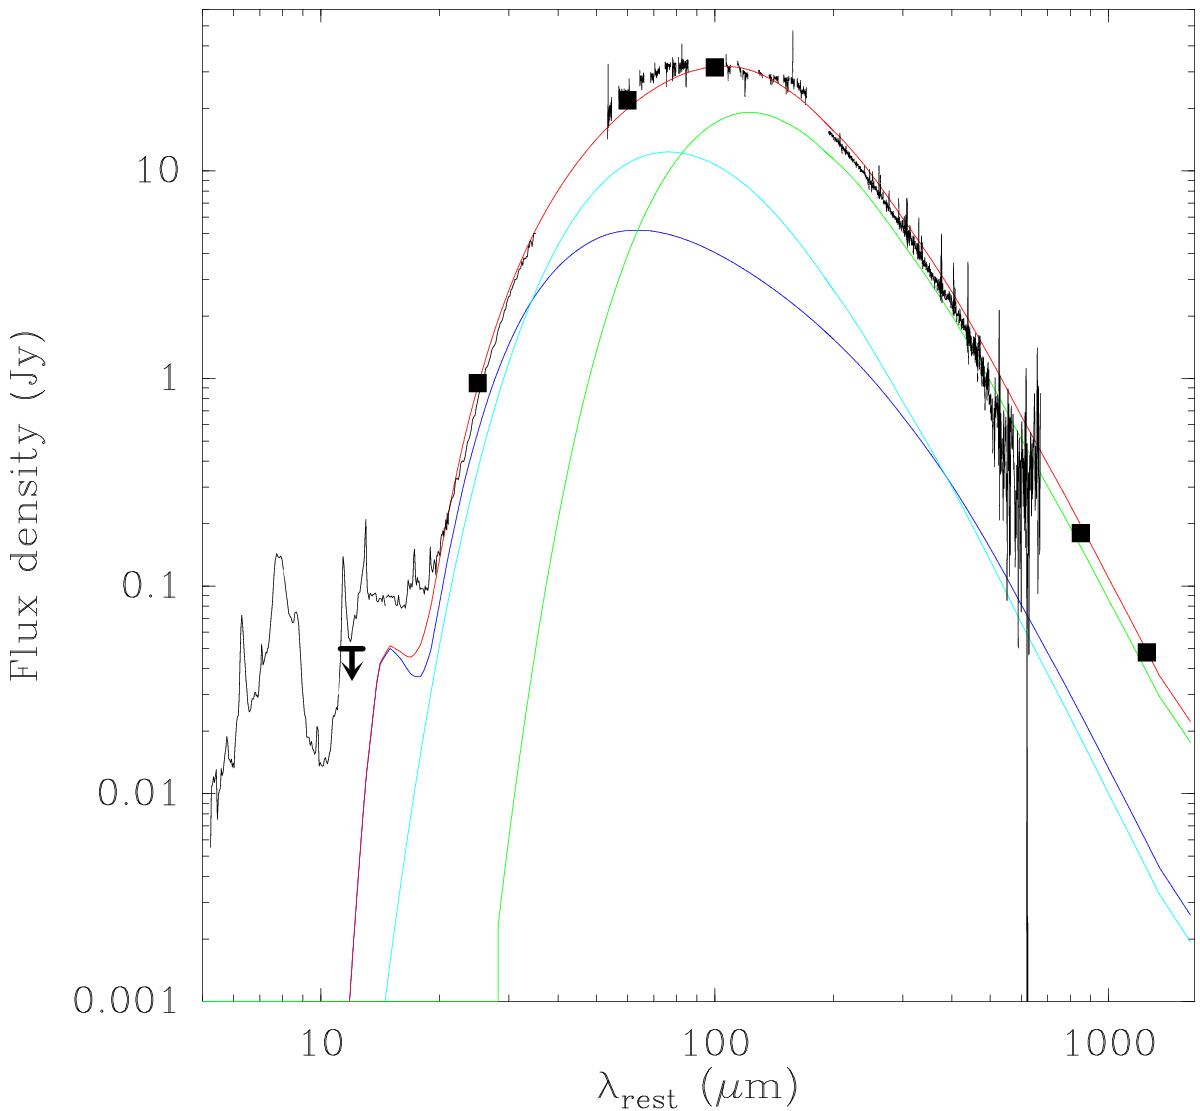
Spectral energy distribution of Zw 049.057 from mid-IR to millimeter wavelengths. Data from Herschel/PACS, Herschel/SPIRE, and Spitzer/IRS are shown. The IRAS data points at 25, 60, and 100μm as well as the upper limit at 12μm come from Sanders et al. (2003), the (sub)millimeter points at 850 and 1250μm are from Dunne et al. (2000) and Carico et al. (1992), respectively. The models discussed in Sect. 3 are included where the blue and light blue curves represent the core and outer components, respectively. The green curve is an extra component to fit the continuum. Red is the total model.
Current usage metrics show cumulative count of Article Views (full-text article views including HTML views, PDF and ePub downloads, according to the available data) and Abstracts Views on Vision4Press platform.
Data correspond to usage on the plateform after 2015. The current usage metrics is available 48-96 hours after online publication and is updated daily on week days.
Initial download of the metrics may take a while.