Fig. 6
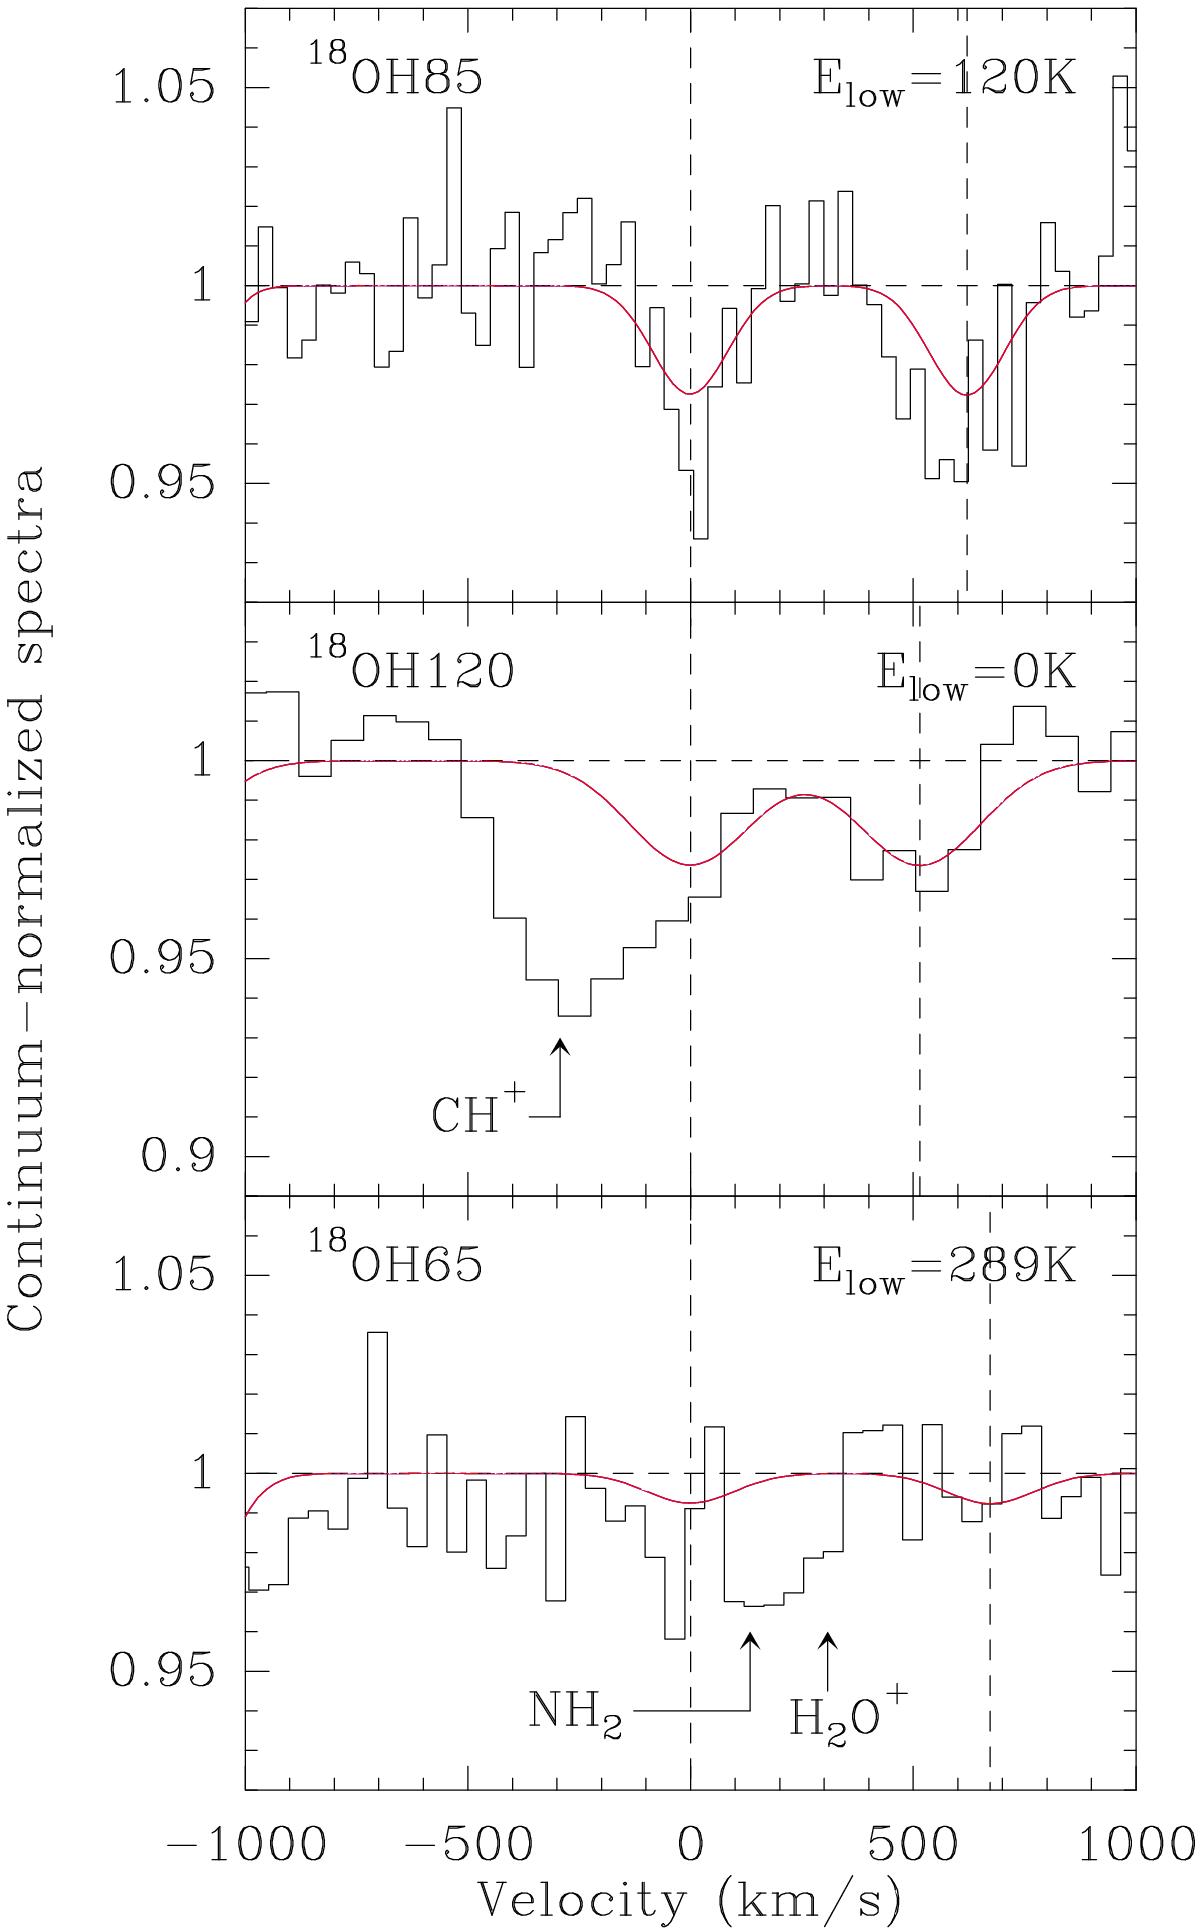
18OH lines observed in Zw 049.057 with PACS. The black histograms are the observed, continuum-normalized, spectra. Model results from Sect. 3 are also included. The red curve denotes the model for Ccore, which was first constrained using the high-lying H2O lines detected with PACS, but with an added 18OH column that was varied in order to fit the 18OH lines.
Current usage metrics show cumulative count of Article Views (full-text article views including HTML views, PDF and ePub downloads, according to the available data) and Abstracts Views on Vision4Press platform.
Data correspond to usage on the plateform after 2015. The current usage metrics is available 48-96 hours after online publication and is updated daily on week days.
Initial download of the metrics may take a while.