Fig. 4
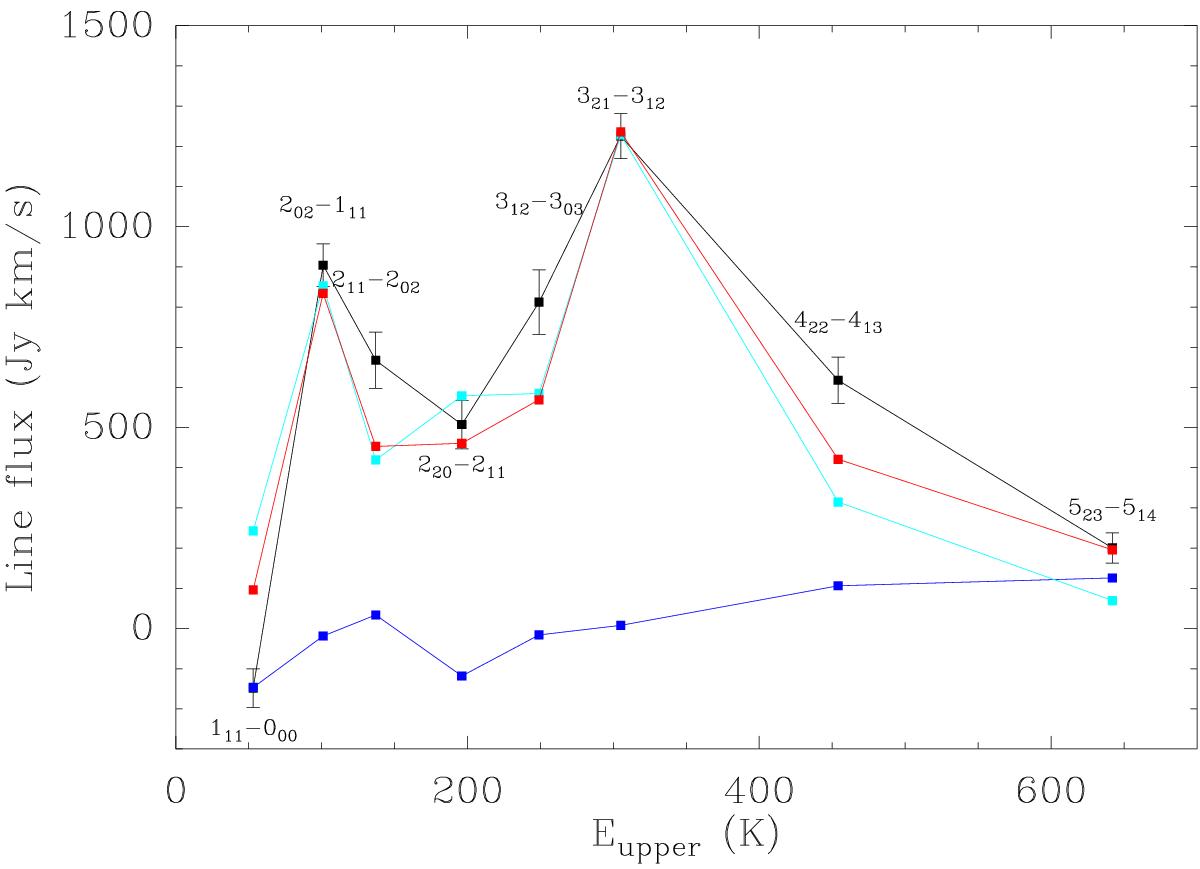
Spectral line energy distribution of the H2O lines detected with SPIRE, the black curve represents the data. For the 111 → 000 line, only the absorption part is included. The line with upper energy level 249 K is 312 → 303. Model predictions are included, the blue and light-blue curves show the contribution from Ccore and Couter, respectively. The red curve indicates the sum of the fluxes predicted by the two models.
Current usage metrics show cumulative count of Article Views (full-text article views including HTML views, PDF and ePub downloads, according to the available data) and Abstracts Views on Vision4Press platform.
Data correspond to usage on the plateform after 2015. The current usage metrics is available 48-96 hours after online publication and is updated daily on week days.
Initial download of the metrics may take a while.