| Issue |
A&A
Volume 578, June 2015
|
|
|---|---|---|
| Article Number | A53 | |
| Number of page(s) | 53 | |
| Section | Extragalactic astronomy | |
| DOI | https://doi.org/10.1051/0004-6361/201425207 | |
| Published online | 03 June 2015 | |
The Herschel Dwarf Galaxy Survey
I. Properties of the low-metallicity ISM from PACS spectroscopy⋆,⋆⋆,⋆⋆⋆
1 Institut für theoretische Astrophysik, Zentrum für Astronomie der Universität Heidelberg, Albert-Ueberle Str. 2, 69120 Heidelberg, Germany
e-mail: This email address is being protected from spambots. You need JavaScript enabled to view it.
2 Laboratoire AIM, CEA/DSM – CNRS – Université Paris Diderot, Irfu/Service d’Astrophysique, CEA Saclay, 91191 Gif-sur-Yvette, France
3 University of Cincinnati, Clermont College, Batavia, OH 45103, USA
4 Sterrenkundig Observatorium, Universiteit Gent, Krijgslaan 281 S9, 9000 Gent, Belgium
5 Laboratoire d’Astrophysique de Marseille – LAM, Université d’Aix-Marseille & CNRS, UMR 7326, 38 rue F. Joliot-Curie, 13388 Marseille Cedex 13, France
6 Department of Physics & Astronomy, University of California, Irvine, CA 92697, USA
7 Institute of Astronomy, University of Cambridge, Madingley Road, Cambridge, CB3 0HA, UK
8 Max-Planck-Institut für extraterrestrische Physik, Giessenbachstraße, 85748 Garching, Germany
9 ESO, Karl-Schwarzschild-Straße 2, 85748 Garching, Germany
10 Department of Physics and Astronomy, University of Sussex, Brighton, BN1 9QH, UK
11 Infrared Processing and Analysis Center, California Institute of Technology, MS 100-22, Pasadena, CA 91125, USA
12 Istituto di Fisica dello Spazio Interplanetario, INAF, via Fosso del Cavaliere 100, 00133 Roma, Italy
Received: 23 October 2014
Accepted: 5 February 2015
Abstract
Context. The far-infrared (FIR) lines are important tracers of the cooling and physical conditions of the interstellar medium (ISM) and are rapidly becoming workhorse diagnostics for galaxies throughout the universe. There are clear indications of a different behavior of these lines at low metallicity that needs to be explored.
Aims. Our goal is to explain the main differences and trends observed in the FIR line emission of dwarf galaxies compared to more metal-rich galaxies, and how this translates in ISM properties.
Methods. We present Herschel/PACS spectroscopic observations of the [C ii] 157 μm, [O i] 63 and 145 μm, [O iii] 88 μm, [N ii] 122 and 205 μm, and [N iii] 57 μm fine-structure cooling lines in a sample of 48 low-metallicity star-forming galaxies of the guaranteed time key program Dwarf Galaxy Survey. We correlate PACS line ratios and line-to-LTIR ratios with LTIR, LTIR/LB, metallicity, and FIR color, and interpret the observed trends in terms of ISM conditions and phase filling factors with Cloudy radiative transfer models.
Results. We find that the FIR lines together account for up to 3 percent of LTIR and that star-forming regions dominate the overall emission in dwarf galaxies. Compared to metal-rich galaxies, the ratios of [O iii]88/[N ii]122 and [N iii]57/[N ii]122 are high, indicative of hard radiation fields. In the photodissociation region (PDR), the [C ii]157/[O i]63 ratio is slightly higher than in metal-rich galaxies, with a small increase with metallicity, and the [O i]145/[O i]63 ratio is generally lower than 0.1, demonstrating that optical depth effects should be small on the scales probed. The [O iii]88/[O i]63 ratio can be used as an indicator of the ionized gas/PDR filling factor, and is found to be ~4 times higher in the dwarfs than in metal-rich galaxies. The high [C ii]/LTIR, [O i]/LTIR, and [O iii]/LTIR ratios, which decrease with increasing LTIR and LTIR/LB, are interpreted as a combination of moderate far-UV fields and a low PDR covering factor. Harboring compact phases of a low filling factor and a large volume filling factor of diffuse gas, the ISM of low-metallicity dwarf galaxies has a more porous structure than that of metal-rich galaxies.
Key words: galaxies: dwarf / infrared: ISM / photon-dominated region (PDR) / techniques: spectroscopic / radiative transfer / HII regions
Herschel is an ESA space observatory with science instruments provided by European-led Principal Investigator consortia and with important participation from NASA.
Table 4 and Appendices are available in electronic form at http://www.aanda.org
Table 4 is also available at the CDS via anonymous ftp to cdsarc.u-strasbg.fr (130.79.128.5) or via http://cdsarc.u-strasbg.fr/viz-bin/qcat?J/A+A/578/A53
© ESO, 2015
1. Introduction
Low-metallicity environments, such as nearby star-forming dwarf galaxies, are ideal laboratories for examining conditions for star formation in objects as chemically unevolved as high-redshift galaxies. They are good candidates with which to study and address fundamental questions such as: how do the physical conditions of star-forming regions vary as a function of the elemental enrichment? What controls the energy balance, heating and cooling, in the different interstellar medium (ISM) phases and shapes the morphology of dwarf galaxies? What are the roles of the different ISM phases in the integrated view of galaxies?
Spectroscopy in the far-infrared (FIR) provides a unique and unobscured view of the ISM properties and conditions for star formation. The FIR cooling lines, less affected by dust attenuation than optical lines, are powerful probes of the star formation activity, linking them directly to the surrounding medium from which these stars are born. The fine-structure lines [C ii] 157 μm, [O i] 63 μm, and [O i] 145 μm are important coolants of moderately dense (nH> 10 cm-3) warm (T ~ 100 − 300 K) neutral ISM and are among the brightest cooling lines in star-forming galaxies. The [N ii] 122 and 205 μm and [O iii] 52 and 88 μm lines are tracers of ionized gas. Together, they can be used as diagnostics of the far-UV (FUV) flux, gas density, temperature, and filling factor of the photodissociation regions (PDR) and ionized regions (e.g., Tielens & Hollenbach 1985; Wolfire et al. 1990; Kaufman et al. 2006). In combination with MIR features ([S iii] 18.71 and 33.48 μm, [Ne iii] 15.56 μm, [Ne v] 14.32 μm, [Si ii] 34.82 μm, H2, polycyclic aromatic hydrocarbons or PAHs, etc.), they provide a comprehensive view on conditions and excitation processes in star-forming regions.
The [C ii] 157 μm line has been studied in a variety of objects, such as Galactic PDRs (e.g., Bennett et al. 1994; Pineda et al. 2013), normal spiral galaxies (Stacey et al. 1991; Malhotra et al. 1997; Negishi et al. 2001; Brauher et al. 2008), low-metallicity galaxies (Poglitsch et al. 1995; Madden et al. 1997; Hunter et al. 2001; Israel & Maloney 2011; Cigan et al. 2015), ultra-luminous IR galaxies (ULIRG, Luhman et al. 1998; Farrah et al. 2013), and high-redshift galaxies (Maiolino et al. 2009; Stacey et al. 2010; Hailey-Dunsheath et al. 2010; Swinbank et al. 2012; De Breuck et al. 2014). From those studies (see Genzel & Cesarsky 2000, for a review), the [C ii] line emerges as the brightest cooling line of the ISM in star-forming galaxies and as a good tracer of the star formation activity, accounting for ~0.1–1% of the FIR luminosity (e.g., Stacey et al. 2010; Pierini et al. 2003; Boselli et al. 2002; De Looze et al. 2011, 2014a; Sargsyan et al. 2014). A deficit in the FIR line intensities is, however, found in luminous IR galaxies (e.g., Luhman et al. 2003; Graciá-Carpio et al. 2011; Croxall et al. 2012; Díaz-Santos et al. 2013). The origin of the [C ii] line has been debated in extragalactic studies as it can arise from molecular, neutral atomic, and ionized gas phases. Characterizing unambiguously the ISM conditions thus requires the use of additional FIR cooling lines (such as [N ii] or [O i]). In dwarf galaxies, the FIR lines were only detected by the KAO and ISO LWS in bright or Local Group dwarf galaxies (e.g., Poglitsch et al. 1995; Israel et al. 1996; Madden et al. 1997; Hunter et al. 2001). These studies found that the FIR lines are exceptionally bright compared to the dust emission. The brightness of the FIR lines contrasts with the faint CO emission, resulting in high [C ii]-to-CO(1–0) ratios in low-metallicity galaxies (Madden 2000; Cormier et al. 2014; Madden et al., in prep.). While CO suffers from photodissociation, large amounts of H2 can potentially be present in low-metallicity PDRs owing to self-shielding. This H2 gas not traced by CO is known as the CO-dark gas (e.g., Wolfire et al. 2010). Interpreting the FIR observations in terms of excitation led to the first evidence of such a reservoir of dark gas, not seen by CO but by C+ (Poglitsch et al. 1995; Israel et al. 1996; Madden et al. 1997). This demonstrates the potential of the FIR lines as calibrators of the dark gas at low metallicity and star formation tracers (De Looze et al. 2014a) that could be used for high-redshift studies.
The advent of the Herschel Space Observatory (Pilbratt et al. 2010) has provided a unique opportunity to study the dust and gas properties in larger samples of chemically unevolved systems. The Herschel guaranteed time key program “The Dwarf Galaxy Survey” (DGS; Madden et al. 2013) is a 230 hours project which observed 50 dwarf galaxies with the PACS (Poglitsch et al. 2010) and SPIRE (Griffin et al. 2010) instruments. Details about the program are presented in Madden et al. (2013), which also contains a list of the dwarf galaxies and their general properties. We summarize the main characteristics here. The galaxies of the sample have metallicities ranging from ~1/40 Z⊙ (I Zw 18) to near solar (He 2-10), and star formation rates ranging from ~5×10⁻⁴ M⊙ yr-1 (UGC 4483), to ~25 M⊙ yr-1 (Haro 11). They have different shapes (irregulars, spirals, etc.), and all of them are nearby galaxies, no further than 200 Mpc. The PACS (70, 100, and 160 μm) and SPIRE (250, 350, and 500 μm) photometry probe the dust emission in the FIR/submillimeter (submm). These data are essential to constrain spectral energy distribution (SED) models and investigate the dust properties. The photometry of the DGS is presented in Rémy-Ruyer et al. (2013) and has revealed, among other results, the presence of warmer dust than in metal-rich galaxies, the presence of an excess emission in the submm in several dwarf galaxies, and lower dust-to-gas mass ratios than expected at the lowest metallicities (Rémy-Ruyer et al. 2014). The PACS (55–210 μm) and SPIRE (195–670 μm) spectrometers give access to the FIR fine-structure cooling lines, the CO ladder, from J = 4 − 3 to J = 13 − 12, and fainter lines of other molecules such as H2O, HCN, OH+, etc. By probing different ISM phases, they provide information on the filling factors and physical conditions of these phases, as well as on the ISM morphology. The dust and gas observations together reveal a coherent multiphase picture of the ISM.
In this paper, we present the observations and results of the FIR lines obtained with the PACS instrument onboard Herschel in 48 galaxies of the DGS. Section 2 describes the data reduction and flux extraction. The observations are interpreted empirically with correlation diagrams and compared to the ISO-LWS work of Brauher et al. (2008) on mostly solar metallicity objects in Sect. 3. The data are further analyzed with H ii region/PDR models in Sect. 4 to contrast the physical conditions characteristic of the ISM of dwarf galaxies to those of more metal-rich galaxies. We discuss our results in terms of ISM properties and filling factors of the ionized and neutral phases in Sect. 5. More specific modeling of the PDR conditions in the dwarf galaxies will be performed in a subsequent paper that we refer to as Paper II.
2. Data
2.1. Herschel/PACS spectroscopy
2.1.1. Observing details
The PACS spectrometer observed 48 galaxies as part of the DGS and SHINING programs, in a total time of 152.7 h. Only the two, faint galaxies Tol 0618-402 and UGCA 20, which are part of the DGS sample (50 galaxies), were dropped from the PACS spectroscopy program because of time constraints. The PACS array consists or 5×5 spatial pixels (or spaxels) covering a total field of view of 47′′× 47′′. The beam size is ~9′′ and 12′′ and the spectral resolution 90 km s-1 and 240 km s-1 at 60 μm and 160 μm, respectively (Poglitsch et al. 2010). We obtained pointed observations for the most compact objects, small mappings for more extended galaxies, and partial mappings of specific star-forming regions for the most extended galaxies (d25> 6′typically), such as the Magellanic Clouds. We define an extended source sample for the galaxies partially mapped or for which the size of the maps do not match for all observed lines. This sample comprises 4 Local Group galaxies, IC 10, NGC 6822, LMC (8 regions targeted), and SMC, and the nearby galaxy NGC 4449. The other 43 galaxies of the DGS are classified as compact (see also Sect. 2.1.7).
The dwarf galaxies were observed between November 2009 and August 2012. 46 sources were done in chop-nod mode and 6 sources in unchopped mode. The number of targeted spectral line varies from just [C ii] 157 μm, in the faintest cases, up to 7 lines, [C ii] 157 μm, [O iii] 88 μm, [O i] 63 μm, [O i] 145 μm, [N iii] 57 μm, [N ii] 122 μm, and [N ii] 205 μm, in the brightest galaxies. We provide details on the observations, such as OBSIDs, map sizes, lines observed, etc. in Appendix A.
Characteristics of the PACS FIR fine-structure cooling lines.
2.1.2. Properties of the FIR lines
General characteristics of the FIR fine-structure cooling lines observed with PACS are given in Table 1.
[C II] 157μm: The [C ii] line is one of the most important coolants of the ISM, as carbon is the fourth most abundant element. [C ii] is excited by collisions with e−, hydrogen atoms, or molecules. The ionization potential of C0 being 11.26 eV, below that of hydrogen, C+ can be found outside of H ii regions, in the neutral phase. It requires only 91.3 K to be excited hence it can cool any warm neutral phase. Thus C+ can originate from diffuse ionized gas as well as diffuse neutral gas or the surface layers of PDRs (up to AV~5 mag). The relative contribution of each medium to its observed intensity is a function of density and ionization degree (e.g., Kaufman et al. 2006).
[N II] 122 μm and [N II] 205μm: [N ii] is only found in the ionized gas. The critical densities with e− are 310 cm-3 and 50 cm-3 for [N ii] 122 μm and [N ii] 205 μm, respectively. Being in the same ionization stage, their ratio is a good electron density tracer of the low-density diffuse ionized gas. Because [C ii] can be found in the low-density ionized gas, part of its emission can correlate with the [N ii] emission. Hence the [N ii] lines can, in principle, be used to disentangle the fraction of [C ii] from the ionized gas to that from the PDR alone (Oberst et al. 2006).
[N III] 57μm: The [N iii] 57 μm emission only arises in ionized gas and is usually associated with H ii regions. Being at two different ionization stages, the ratio of [N iii]57/[N ii]122 is a measure of the effective temperature of the ionizing stars (Rubin et al. 1994).
[O I] 63 μm and [O I] 145μm: O0 has an ionization potential of 13.62 eV, just above that of hydrogen. The first two fine-structure transitions require excitation energies of 228 and 325 K above the ground state, corresponding to the [O i] 63 μm and 145 μm lines. [O i] is only found in neutral gas and usually arises from warm, dense regions. Along with [C ii], [O i] 63 μm is one of the brightest PDR cooling lines (e.g., Bernard-Salas et al. 2012). [O i] can also exist deeper in the PDR than [C ii] since the formation of CO occurs at larger AV (~10 mag) than the transition of C+ into C0 (~3 mag). The ratio of the two [O i] lines is an indicator of the gas temperature for temperatures in the vicinity of 300 K. It is a density tracer for high temperatures and high densities. The [O i] emission can be affected by optical depth effects (self-absorption, optical thickness), particularly for the lower level transition at 63 μm (Liseau et al. 2006). In the optically thin limit, the [O i] 63 μm, just above the ground state, is brighter than the 145 μm line.
[O III] 88μm: The [O iii] 88 μm line is only found in the ionized gas, and because it requires energetic photons (35 eV), it is commonly accepted that it comes from H ii regions rather than inter-clump diffuse media where radiation fields are expected to be softer. The [O iii] transition at 52 μm ( ) is at the edge of the PACS wavelength coverage and was not observed in our survey.
2.1.3. Data reduction
The data were downloaded from the Herschel Science Archive and reduced with the Herschel interactive processing environment (HIPE, Ott 2010) user release 12 and the PACS calibration tree v65. We reprocessed the observations from the raw data (level 0) to spectral data cubes (level 2) using the standard pipeline scripts available within HIPE. We opted for the telescope background normalization calibration method for all chop-nod observations, except for the [N ii]205 observations which were processed with the de-leaked RSRF provided in HIPE1. In the first part of the pipeline (level 0 to level 0.5), the astrometry and information from the instrument are read. Masks for bad and noisy pixels, and for when the chopper and grating are moving are also applied. From level 0.5 to level 1, glitches are flagged, and the calibration is applied. In the chop-nod case, signal from the chopper position is subtracted. From level 1 to level 2, a spectral flat-field correction is applied, and outlier data points are masked by a sigma-clipping. The flat-field scaling is both multiplicative and additive for chop-nod observations, and additive only for unchopped observations. In the unchopped case, a transient correction and background subtraction are also executed. For the transient correction, we applied a multi-resolution method as described in Lebouteiller et al. (2012). For the background subtraction, we used a procedure that smoothes and averages the OFF-spectra taken before and after an ON-spectrum in time (when several OFF-frames are available), and then subtracts it from the ON-frame.
2.1.4. Spectral maps
The data are saved as spectral cubes before they are rebinned and projected onto a final spatial grid in the pipeline script. Once the spectral cubes (one cube per raster position) are exported from HIPE, we used the software PACSman version 3.57 for the analysis (Lebouteiller et al. 2012).
The first step is to fit the spectral lines and measure the line flux in all the spatial positions. A polynomial curve of order 1 or 2 is first fit to the continuum, and then a simultaneous fit to the continuum and line is performed with the IDL procedure mpfitfun (Markwardt 2009). The line profile is assumed to be Gaussian, although skewed profiles can be seen if the observed object is a point-source not centered on the array. Only UM 448 shows clear asymmetric and wider profiles in several spaxels, but since we have made mini-maps for this galaxy, the better centered spaxels are well-enough fitted by a Gaussian profile, and we can reliably recover the total flux of this galaxy. By default, the continuum is defined as the part of the spectrum within 2−6 FWHM of the line center. The width of the Gaussian is taken as the instrumental width, plus a broadening when necessary. The PACS line profiles are sometimes found larger than the instrumental profile, necessitating broadened line fits. We report on the broadening parameters of the FIR lines in Appendix E.
To estimate the uncertainty on the fit parameters, we use a Monte Carlo approach. We randomly perturb the data within their error bars, fit the line, iterate the process 100 times, and take as final fit parameters the median of the resulting values, and as error on those parameters the standard deviation. An additional 15% absolute flux calibration uncertainty is to be considered1.
For the irregular galaxy IC 10, the [C ii] spectra are contaminated by emission from the Milky Way. This emission appears at +320 km s-1 relative to IC 10, with a peak of ~1.8 Jy, and is fairly uniform across our [C ii] map. The separation between the two emission peaks is large enough to clearly identify the respective contributions. Thus to extract the flux only from IC 10, we fit simultaneously two Gaussians. We also note that OFF-spectra are not available for several observations in LMC-30 Doradus (OBSIDs 1342231280, 1342231282, 1342231283, 1342231285), LMC-N11 B (OBSIDs 1342188940, 1342188941), and NGC 4449 (OBSIDs 1342197813, 1342197814), resulting in variations across wavelength of a few Jy typically in the baselines of the ON-spectra. For NGC 4449 and LMC-N11 B, we model those variations with a sinusoidal component of low frequency to improve the baseline fit. For LMC-30 Dor, no sinusoid is required as those variations are not significant compared to the line strength and thus do not affect our line fits.
Once flux values are calculated for each spatial position, the data are projected on a new grid of sub-pixel resolution of 3.1′′ (roughly 3 times oversampled) with a drizzling scheme. When more than one spaxel falls on the same sub-pixel, a fraction of the flux from the corresponding spaxel of each raster is considered, and the uncertainties are combined quadratically. The final flux maps, with spectra and line fits are shown for each galaxy in Appendix B.
2.1.5. Flux extraction
We have explored several methods to extract accurate line fluxes. For compact objects, we consider 4 methods to measure the total line flux, as it depends on how well-centered the source is on the PACS array and on the spatial extent of the source:
-
central: we apply a point-source correction only to the central (orbrightest) spaxel. This method works only if the source is wellcentered on the spaxel.
-
psf: we fit a point spread function (PSF) to the array.
-
3× 3: we combine the inner 3 × 3 spaxels before fitting the line and apply a 3 × 3 point-source correction.
-
5× 5: we combine the 5 × 5 spaxels of the PACS array before fitting the line and apply a 5 × 5 point-source correction. For final flux, we select the method that gives the highest response with a good signal-to-noise ratio (S/N).
In the case of extended or elongated objects we simply perform an aperture extraction with sky subtraction when possible or consider the total flux in the area mapped. The errors are added quadratically from the error maps and multiplied by a factor of  to account for the number of sub-pixels per independent beam. We consider a spectral line detected if the S/N is ≥3, and upper limits are given as the 3σ level, from the method used for the detected lines or from the central method otherwise. Table 4 lists line fluxes as well as the method used for the flux extraction (aperture size when applicable). To summarize, these values are the most reliable measurements of the total line fluxes for the DGS galaxies. For the extended sample, we report peak surface brightnesses instead of total fluxes.
2.1.6. Summary of detections
The [C ii]157 line was targeted in all objects, along with the [O iii]88 and [O i]63 lines for almost all objects (~85%). For the brightest galaxies (30%), the [O i]145 and [N ii]122 lines were also observed, and in a very few cases (7%) the [N ii]205 and [N iii]57 lines as well. Figure 1 shows a histogram of how many galaxies were observed and detected (>3σ level) in each spectral line. The [C ii]157, [O iii]88, and [O i]63 lines are the brightest, detected in more than 90% of the cases, and on average are at least 10 times brighter than the other lines. The [N ii] 205 μm line has only been attempted a few times but not detected as it is located at the edge of the spectral band, suffering from leakage.
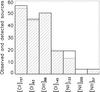 |
Fig. 1 For each PACS spectral line, the number of sources observed and detected (hashed) in the Herschel Dwarf Galaxy Survey. |
2.1.7. Additional sources of uncertainty
In addition to the measurement errors and uncertainties from the PACS calibration, there are other sources of uncertainty to consider when interpreting the data. We discuss two main factors.
Inhomogeneous line mapping: Although we have measured the total flux within each line map, the spatial coverages of those maps, in a given galaxy, may not match exactly. To estimate whether the total line fluxes can be directly compared with each other, we consider the 100 μm PACS photometry maps as a reference for the distribution of the FIR emission. For each spectral line, we measure the fraction of the 100 μm emission seen inside the map coverage. We find that this fraction does not vary by more than 15% for all galaxies, except for NGC 1140 for which we consider a correction factor of 20% because the [C ii]157 map covers a larger area than the other lines. Hence we can confidently use the total fluxes reported in Table 4 to analyze line ratios.
Incomplete mapping with PACS: For 11 galaxies of the compact sample, the [C ii]157 line is detected at a >5σ level at the edges of the PACS map. The [C ii]157 emission is extended but not fully mapped, hence we may be missing signal when reporting total fluxes. We coarsely estimate the flux loss by measuring the dust emission from the PACS 100 μm maps inside and outside of the area covered by the [C ii]157 maps. This way, we find a missing flux fraction of 15% for Mrk 153, Mrk 1089, Mrk 930, NGC 1569, and of 55%, 35%, 35%, 20%, and 60% for NGC 2366, NGC 4214, NGC 4861, NGC 625, and UM 311, respectively, and a fraction that we consider negligible (lower than 15%) for the other galaxies. Table 4 reports the uncorrected fluxes, and the correction factor to apply if one wants to compare the line fluxes to integrated quantities.
2.1.8. Comparison with ISO
Three galaxies of the DGS (Haro 11, NGC 1569, and NGC 625) were detected by ISO and reported as compact in Brauher et al. (2008). The LWS and PACS fluxes in Haro 11 agree within 20–40%, the [O i]63 and [O iii]88 fluxes in NGC 1569 agree within 10%, while the [C ii]157 fluxes are found higher with PACS by a factor of 2 and 3 in NGC 625 and NGC 1569, respectively. In those galaxies (especially NGC 1569), the PACS maps show clear extended structure, beyond the LWS beam. Since they were considered as point-sources in the LWS flux extraction and the LWS beam profile is more peaked at 160 μm than at the shorter wavelengths, this may explain why the [C ii]157 fluxes recovered by PACS are higher. Given that mini maps were performed with PACS for those three galaxies, we are confident that we have better recovered their total fluxes. More generally, no systematic differences between the LWS and PACS fluxes have been established by the PACS instrument team. Therefore in Sect. 3, we compare our PACS data with the LWS data of other galaxies as they are reported in the literature (without correction factors).
2.2. Ancillary data
2.2.1. Spitzer IRS spectroscopy
For the modeling carried out in Sect. 4, we compiled mid-IR line fluxes for the compact sources of the DGS, measured both with the low-resolution modules (R ~ 60 − 127) and with the high-resolution modules (R ≈ 600) of the IRS instrument (Houck et al. 2004). The line fits were performed assuming a Gaussian profile and constraining the line width to be the instrumental broadening since there is no evidence of lines being resolved. The IRS line fluxes are provided in Appendix C. We provide in the following some details on the spectral extraction.
The low-resolution data were retrieved from the CASSIS spectral database v6 (Lebouteiller et al. 2011). For point-sources, we used the optimal extraction spectra, which provide the best S/N. For compact sources, we used the tapered column extraction, in which the flux is integrated within a spatial window whose width scales with the source extent and with wavelength. While scaling the width to account for all the emission along the long (cross-dispersion) axis allows a better flux calibration for extended sources, it does not correct for the emission outside the slit along the short (dispersion) axis. For this reason, we have applied a custom flux calibration correction in which we have assumed that sources can be modeled as 2D Gaussians with cropped wings (representing the source function) convolved with the instrument PSF. The fraction of light falling outside the slit is then calculated for all wavelengths and for any source extent.
High resolution spectra were extracted with two methods used by the CASSIS high-resolution pipeline (Lebouteiller et al., in prep.). For point-like sources we used an optimal extraction similar to the low-resolution algorithm while for extended sources we used a full aperture extraction (integrating the flux falling inside the aperture). For the full-aperture extraction, we decided to use a point-source calibration because in all cases the source is dominated by emission that is not uniform across the slit and that is instead characterized either by a PSF profile or by a broad Gaussian-like profile. The full aperture extraction ensures that all the light entering the aperture is accounted for. While we should in principle also correct for the emission outside the aperture, like for the low-resolution data, the custom flux calibration for the high-resolution spectra of partially-extended sources is not available yet. We chose therefore a correction factor similar to what is used for point-sources in the lack of a better estimate.
Fluxes measured in the low- or high-resolution spectra can differ. While the high-resolution allows in general a more reliable determination of the line fluxes, the low-resolution module slits are better adapted for extended sources. More light enters the low-resolution long slits (SL, LL) than the high-resolution apertures (SH, LH), so when using a point-like source calibration, the high-resolution line fluxes will be smaller than the low-resolution line fluxes. The more extended the source is, the larger this effect. Since the size ratio SH/SL (0.24) is larger than LH/LL (0.14), the effect is also larger for the long-wavelength modules. In Sect. 4, we use line ratios from high-resolution data when available and from low-resolution data otherwise. Line ratios of [S iv] 10.5 μm/[S iii] 18.7 μm, [Ne iii] 15.6 μm/[Ne ii] 12.8 μm, and [S iii] 18.7 μm/[S iii] 33.5 μm agree within ~30% between the low-resolution and high-resolution data.
2.2.2. Photometry and reference sample data
In this paper, the dwarf galaxy sample is primarily compared to the ISO LWS extragalactic sample of FIR fine-structure lines from Brauher et al. (2008, hereafter B08), which is one of the most complete in the literature. The B08 sample contains a larger variety of galaxies than the DGS, with normal star-forming galaxies, starbursts, and active galactic nuclei (AGN). We only use their data for unresolved sources, and with clear detections (>3σ). The DGS sample extends the analysis of Brauher et al. (2008) to lower metallicities and less luminous galaxies, as the B08 sample is mostly composed of bright objects. Additionally, we contrast our objects with the ULIRG samples of the Herschel SHINING (Graciá-Carpio et al. 2011) and HERUS (Farrah et al. 2013) surveys.
We study the behavior of the FIR cooling lines of the dwarf galaxies as a function of four important parameters: metallicity, F60/F100, LTIR, and LTIR/LB. The broadband ratio of IRAS flux densities at 60 μm and 100 μm, denoted F60/F100, probes the peak of the SED (which is often at wavelengths shorter than 70 μm in our dwarf galaxies; Rémy-Ruyer et al. 2013), and thus the dust temperature. LTIR is the total infrared luminosity, measured from 3 to 1100 μm. It reflects a large part of a galaxy’s energy budget and is an indirect probe of the star formation activity. LTIR is commonly used as the proxy for the gas heating (e.g., Rubin et al. 2009) since LTIR includes all contributions from the dust emission, and in particular the small grains and PAHs which are the main agents of the gas photoelectric heating. The ratio of the [C ii] and [O i] lines to LTIR is a measure of the photoelectric efficiency, which we discuss in more detail in Sect. 5.2. Finally, LB is the blue band luminosity, corrected for Galactic extinction using the Schlegel et al. (1998) values provided by the NASA/IPAC Infrared Science Archive but not for internal dust attenuation, and converted from the magnitudes reported in Madden et al. (2013). LTIR/LB relates the stellar light processed by dust to that escaping, i.e. the mean extinction towards the star-forming region. The mean extinction is sensitive to the compactness of the cold surrounding medium and thus to the covering factor of PDRs. We note that we opt for the B-band luminosity rather than FUV in order to have a sufficient number of galaxies with reliable data.
For the normal galaxies (B08, SHINING, and HERUS samples), the IRAS photometry is used to compute F60/F100 and to calculate LTIR using the Dale & Helou (2002) formula. For the compact sample of the DGS, we consider SED integrated values from Rémy-Ruyer et al. (in prep.) for LTIR and observed IRAS fluxes from Engelbracht et al. (2008) for F60/F100 (when available). For the galaxies undetected or not observed by IRAS, we create synthetic IRAS fluxes based on the Herschel photometry and SED modeling of those galaxies, by convolving the SED models with the IRAS response curves. For the extended sample, we create LTIR and synthetic IRAS maps based on the model of Galliano et al. (2011) that we convolve to the largest beam (12′′, corresponding to the PACS 160 μm beam size). For the comparison to the spectral lines, we integrate those quantities over the same area mapped for each PACS line.
Although less sensitive, IRAS being an all-sky survey, we prefer to use the IRAS photometry for our analysis with FIR colors rather than the Herschel photometry to ease the comparison with the literature. We list the IRAS and Herschel/ PACS band ratios and LTIR in Appendix D. We find median ratios of IRAS60/PACS70 = 0.86 and IRAS100/PACS100 = 1.05. Because the method used to derive LTIR for the B08 galaxies and for the dwarf galaxies is not the same (IRAS formula versus SED modeling), we assess its influence by comparing the results for those galaxies where we can apply both methods (i.e. the dwarf galaxy sample). We find that the difference in the resulting LTIR is small, with a median difference of 15%.
3. Observed ISM properties
In this section, we present and analyze the correlations between several FIR tracers to identify observational trends in the sample, and link them to general parameters (e.g., metallicity, dust temperature). We focus our analysis on the integrated emission of galaxies. To quantify possible correlations, we compute the Spearman’s rank correlation with the IDL procedure r_ correlate only for the compact sample, when it contains more than 8 data pairs. We identify correlations at a significance level of 5%. The interpretation of identified trends is supported by radiative transfer modeling of the photoionized and PDR gas in Sect. 4.
3.1. Luminosity of the FIR lines
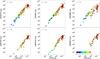 |
Fig. 2 PACS line fluxes versus LTIR. The DGS galaxies are represented by filled circles (compact sample) color-coded by metallicity. The red asterisks are the galaxies from Brauher et al. (2008) and the blue asterisks are the low-metallicity sources originally published by Hunter et al. (2001). The orange rectangles are the HERUS data from Farrah et al. (2013) and the red rectangles are the SHINING data from Graciá-Carpio et al. (2011). Spearman correlation coefficients applied to the DGS compact sample are indicated in the top left corner (when found above the chosen significance level and with more than 8 data points). |
The [O iii] 88 μm line is found to be very bright in the DGS galaxies and is the brightest line in most cases. This is true, locally in extended sources where the peaks of emission are ~10 times brighter than the [C ii] 157 μm line (e.g., LMC-30 Dor), and even on galaxy-wide scales. This is surprising, at first, as it requires 35 eV photons to create a O++ ion while the PDR lines are more easily excited. Bright [O iii] is likely related to the starbursting nature of the dwarfs, which host stars with higher effective temperatures than normal galaxies, as observed by Hunter et al. (2001). The [C ii]157 line is the second brightest FIR line and [O i]63 is the third brightest line. [O i]63 usually dominates the cooling in resolved PDRs (e.g., the Orion Bar, Bernard-Salas et al. 2012), and we find that it is often brighter than [C ii]157 on peaks of emission within extended sources (e.g., SMC-N 66), but fainter than [C ii]157 on galaxy-wide scales.
We compare the FIR line luminosities with LTIR in Fig. 2. The emission from the FIR lines is strongly correlated with LTIR (ρ ≃ 0.97 in the dwarfs), a result expected since all those quantities scale with the size, i.e. luminosity, of the galaxy. Those correlations being tight further indicates that the bulk of the FIR emission is related to star formation. Calibrating the FIR lines as star formation rate tracers is done in De Looze et al. (2014a). The dwarfs extend the relation observed, at high luminosities with the ULIRGs from HERUS and SHINING and moderate luminosities with the B08 galaxies, to much lower luminosities, thanks to the sensitivity of Herschel. The dispersion is smaller in the star-forming galaxies than in the ULIRGs, which are known to present a line deficit, especially visible in the HERUS ionic line fluxes (Graciá-Carpio et al. 2011; Farrah et al. 2013). What is striking in the figure is the offset (~1 dex) between the dwarf galaxies and the ULIRGs from HERUS and SHINING regarding their [O iii]88 emission. The B08 galaxies fill the gap between the two samples. Moreover, we notice an offset of the DGS sample relative to the B08 sample, with fainter [N ii]122 emission in the dwarfs.
3.2. Effects of metallicity
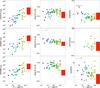 |
Fig. 3 PACS line fluxes, ratios, and line-to-LTIR ratios as a function of metallicity. The DGS galaxies are represented by filled circles (compact sample) and stars (extended sample), color-coded by metallicity. Spearman correlation coefficients applied to the DGS compact sample are indicated in the top left corner (when found above the chosen significance level and with more than 8 data points). The large red rectangles show the range of values covered by the Brauher et al. (2008) sample, at metallicity around solar. |
We correlate the FIR measurements with metallicity in Fig. 3. As expected from the metallicity-luminosity relationship, the luminosity of the FIR lines increases with metallicity (ρ ~ 0.65), with large scatter (dispersion ~0.8 dex). For reference, we measure the following slope: L(line) ∝ (12 + log O/H)2. No clear trends are observed between the FIR line ratios or line-to-LTIR ratios and metallicity, except a slight decrease of [O i]63/LTIR (ρ ≃ −0.5) and [O iii]88/[C ii]157 (ρ ≃ − 0.4) with increasing metallicity. No trend is detected if we include the regions of the LMC (orange stars). The [O i]63/[C ii]157 ratio is also found higher on average at lower metallicity (cf. I Zw 18, SBS 0335-052), but the scatter is important. To first order, variations in metal abundances (caused for example by delayed injection of carbon in the gas phase compared to oxygen) are not responsible for the trends with [O i]63 as they would affect the other lines, and in particular the [O i]145/[C ii]157 ratio, similarly. Optical depths effects on the [O i]63 line (see Sect. 2.1.2) could reduce the amount of observed [O i]63 emission and account for the trends observed with [O i]63 but not with [O i]145. However, they should also translate into a decrease of [O i]63/[C ii]157 with LTIR, which we do not observe, and we do not have enough observations of the [O i]145 line at the lower metallicities to quantify those effects. Therefore, the weak trends that we observe with metallicity are likely due to a change of cloud conditions, i.e. increased [O i]63 emission in denser/warmer clumps at lower metallicities (where cosmic rays or soft X-rays may become important heating sources; e.g., Péquignot 2008). This also agrees with the fact that the [O i]63/[C ii]157 and [O i]63/LTIR ratios are higher in the extended galaxies, particularly in the Magellanic Clouds observations that provide a zoomed in view on the star-forming regions and for which [O i]63 is the main coolant of the dense PDR. We further test those hypotheses with radiative transfer models in Paper II. Overall, this indicates that metallicity is not the only regulator of the FIR line emission.
3.3. PACS line ratios
We compare the PACS line ratios with FIR color, LTIR, and LTIR/LB for the DGS and B08 samples (Fig. 4). Median, minimum, and maximum values of the PACS line ratios are summarized in Table 2. We indicate values for the complete sample (compact and extended objects), compact sample alone, and for the B08 dataset. Overall, the data clearly indicate large real variations in the line ratios as well as systematic offsets in the ionized gas tracers. Our dwarf galaxies show weak trends within the sample, but behave differently than the more metal-rich galaxies as a group (not with respect to metallicity/abundances).
PACS line and line-to-LTIR median ratios of the DGS galaxies.
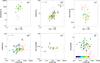 |
Fig. 4 PACS line ratios against F60/F100 and LTIR/LB. The DGS galaxies are represented by filled circles (compact sample) and stars (extended sample), color-coded by metallicity. See also the caption of Fig. 2. |
3.3.1. [O iii]88/[N ii]122
[O iii]88 and [N ii]122 are both tracers of the ionized gas, with similar critical densities (~300–500 cm-3), but different ionization potentials (35.5 and 14.5 eV, respectively). It is remarkable how the dwarf galaxies occupy a completely different parameter space in [O iii]88/[N ii]122 than the more metal-rich galaxies of the B08 sample. The [O iii]88/[N ii]122 ratio is observed to be high in the dwarfs, with a median value of 86, which is ~30 times higher than in B08. Our preferred interpretation for this high ratio is the presence of harder radiation fields in the dwarfs. This is supported by the fact that for those dwarf galaxies where we have observed [N iii], the line is also enhanced compared to [N ii]. Secondly, the harder radiation fields naturally lead to warmer FIR color (high F60/F100), as is observed. [O iii]88/[N ii]122 is also sensitive to variations in the N/O abundance ratio, which could be low at low metallicities. However, we find no trend of this ratio with metallicity (although [N ii]122 was not observed in the lowest metallicity galaxies).
We do not find any statistically significant trend within the ensemble of dwarf galaxies between [O iii]88/[N ii]122 and the parameters considered. With higher F60/F100 and lower LTIR on average, the dwarfs do not invalidate the weak trends observed in Brauher et al. (2008), of [O iii]/[N ii] increasing with FIR color (Fig. 4a) and decreasing with LTIR and LTIR/LB. The fact that the [O iii]88 and [N ii]122 trends with FIR color are weak may indicate a combined effect of harder radiation fields and lower densities, with a contribution of low-density (high and low-excitation) ionized gas to these lines, in addition to the compact H ii regions.
3.3.2. [N iii]57/[N ii]122
The [N iii] 57 μm line was observed in only four DGS sources (Haro 11, Haro 3, He 2–10, and LMC-N11B), and three of them have both [N iii] and [N ii]122 detections. The [N iii]57/[N ii]122 ratios are high, with an average value of 8.1, which is 4 times higher than in B08 (Table 2). This ratio is not sensitive to variations in elemental abundances and an indicator of the effective stellar temperature (Rubin et al. 1994), as it requires 14.5 eV to create N+, and 29.6 eV to create N++. Thus higher [N iii]57/[N ii]122 ratios show the presence of harder radiation fields and are expected in dwarfs compared to normal galaxies.
The [N iii]57/[O iii]88 ratio is on average 6 times lower in the DGS than in B08. This ratio is sensitive to ionization degree, N/O abundance ratio, and density in the range 102 − 104 cm-3 (see Table 1). Considering the high [N iii]57/[N ii]122 values, the data again suggest a high filling factor of low-density high-excitation material in dwarf galaxies.
3.3.3. [O i]63/[C ii]157
[O i]63 and [C ii]157 both trace the neutral ISM, and the ratio of [O i]63/[C ii]157 in the DGS galaxies falls in the range observed by B08, with a median value of 0.6. [O i]63/[C ii]157 is not correlated with LTIR, but we see an increase of [O i]63/[C ii]157 with FIR color (ρ = 0.68), and a weak correlation with LTIR/LB (ρ = 0.36) for the dwarfs (Figs. 4b, d). Theoretical PDR studies have demonstrated that the [O i]63/[C ii]157 ratio increases with density and radiation field strength (Kaufman et al. 2006), as the critical density and excitation energy of [O i]63 are higher than for [C ii], and therefore higher ratios are expected in compact star-forming regions (e.g., SBS 0335-052), which have higher F60/F100 and LTIR/LB (Malhotra et al. 2001).
3.3.4. [O i]145/[O i]63
The [O i] line ratio is mainly sensitive to the density and temperature of the neutral gas, and to the optical depth of the cloud (Tielens & Hollenbach 1985). The median ratio of [O i]145/[O i]63 is 0.07 in the dwarfs. The range of values is narrow and a little higher than the median value found in the more metal-rich galaxies.
We do not find statistically significant trends between the [O i]145/[O i]63 ratio and F60/F100, LTIR, or LTIR/LB (Fig. 4e), contrary to Hunter et al. (2001) who noted a slight increase with LTIR/LB (on a smaller dataset). The lack of correlation with FIR color is expected as the [O i] line ratio stays constant for a constant G0/nH (provided G0 ≤ 104). Ratios higher than 0.1 are only found in two galaxies (0.17 in VII Zw 403, at a 3σ level, and 0.11 in LMC-N159), and are usually explained by noticeable optical depth effects on the [O i] 63 μm line (Malhotra et al. 2001; Hunter et al. 2001; Röllig et al. 2006; Kaufman et al. 2006). On integrated scales, optical depths are not high in the dwarfs (AV≤ 3 mag; Abel et al. 2007).
3.3.5. [O iii]88/[O i]63
As observed in earlier studies of dwarf irregular galaxies by Hunter et al. (2001), the [O iii]88/[O i]63 ratios are high in the dwarf galaxies, with median value 3. While Brauher et al. (2008) noted a slight decrease of [O iii]88/[O i]63 with LTIR/LB, we find no correlation with FIR band ratio, LTIR, or LTIR/LB within the ensemble of dwarf galaxies. The DGS galaxies as a group occupy a different parameter space than the B08 galaxies (Fig. 4f).
The [O iii]88/[O i]63 ratio, which is insensitive to variations of elemental abundances, may be used as an indicator of the filling factor of ionized gas, traced by [O iii], relative to the filling factor of PDRs, traced by [O i]. In the extended sources, [O iii] is detected over large spatial scales (e.g., LMC-N11 B, LMC-30 Dor, NGC 4449; Lebouteiller et al. 2012; Chevance et al., in prep.; Karczewski et al., in prep.) indicating the presence of low density channels where the hard UV photons can travel far (>20 pc) to excite the gas. The dwarf galaxies are probably mostly filled, by volume, with ionized gas, with densities likely below ~510 cm-3 (ncrit of [O iii]88), and low filling factor of PDRs.
3.3.6. [N ii]122/[C ii]157
The [N ii]122/[C ii]157 ratio is on average 0.02, 5 times lower than in the B08 galaxies. This is mostly a consequence of the high ionization fractions which favor the presence of N++ rather than N+. The [N ii]122/[C ii]157 ratio seems uncorrelated with FIR color, LTIR, or LTIR/LB in the dwarfs (Fig. 4c). Brauher et al. (2008) also found an absence of correlation for all morphological types.
This ratio can be used as an indicator of the [C ii] excitation mechanism, where high [N ii]/[C ii] ratios can mean that a non-negligible fraction of the [C ii] emission originates in the ionized gas and low ratios indicate that [C ii] originates in the PDR gas. Oberst et al. (2006) show that ionized gas alone yields at least [N ii]122/[C ii]157> 0.1. The conditions for [C ii] emission to originate in the ionized gas are low densities (ncrit, e− ~ 50 cm-3) and low ionization, as carbon would otherwise be doubly ionized (I.P. 24.5 eV), i.e. the [N iii] emitting gas does not produce notable [C ii] emission. While Brauher et al. (2008) suggest that a significant fraction of the [C ii] emission in metal-rich galaxies originates in H ii regions where [N ii] comes from, our lower [N ii]122/[C ii]157 values favor a non-H ii region origin for the [C ii] line, from the neutral and/or very low-density ionized gas. From individual analyses, we have found that: (1) for Haro 11, where [N ii]122/[C ii]157= 0.05 is the highest ratio in the DGS galaxies, the low-density diffuse ionized gas contributes up to ~40% to the [C ii] emission; (2) in the LMC regions, where [N ii]122/[C ii]157≃ 0.03, [C ii] is associated with the ionized gas at ≤15% (Lebouteiller et al. 2012; Chevance et al., in prep.); (3) in NGC 4449, [N ii]122/[C ii]157≃ 0.02 and the fraction of [C ii] arising from the ionized gas is small (Karczewski et al., in prep.). Therefore we estimate that, typically, less than 15% of the [C ii] emission arises in the ionized gas. Although the ionized gas fills a large volume in the dwarf galaxies, its excitation state is too high for C+ to be present. Lower N/O abundance at lower metallicity (e.g., Liang et al. 2006) may change this estimate, but the fraction should remain low as we observe low [N ii]122/[C ii]157 ratios even at half-solar metallicity. [N ii]122 is not detected for metallicities 12 + log (O/H) < 7.8 and, where detected, [N ii]122/[C ii]157 does not show any trend with metallicity. More precise quantification of this fraction in the DGS galaxies requires multiphase modeling which is beyond the scope of this paper.
3.4. FIR fine-structure line-to-LTIR ratios
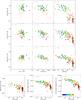 |
Fig. 5 PACS line-to-LTIR ratios as a function of F60/F100, LTIR, and LTIR/LB. Same legend as in the caption of Fig. 2. |
3.4.1. General remarks
In Fig. 5, we show ratios of PACS line-to-LTIR versus F60/F100, LTIR2, and LTIR/LB to investigate variations in the cooling by the gas and dust.
The line-to-LTIR ratios are found high in the dwarf galaxies, at least twice as high as in the B08 galaxies for [C ii]/LTIR and [O iii]/LTIR (see Table 2). Among the highest points are the extended galaxies, in which we have zoomed on the most active star-forming regions. Excitation by the young massive stars results in bright FIR lines, while the dust can still emit significantly further from the active regions. Line-to-LTIR ratios would probably be lower for the LMC in its entirety. In more quiescent regions of the extended galaxies, line-to-LTIR ratios are lower in general. This is especially the case for [O iii] and [O i], and less for [C ii] because of the contribution from diffuse emission to the total [C ii] flux. Rubin et al. (2009) estimate [C ii]/LTIR≃ 0.45% for the entire LMC, which is close to our average extended sample value. High ratios for the compact objects may therefore indicate that star-forming regions clearly dominate the overall emission of the galaxy.
3.4.2. [O iii]88/LTIR
[O iii]88/LTIR values span an order of magnitude, from 0.1 to 1.7, with average value of 0.50%. The dwarf galaxies are at the high end of the B08 sample. The dwarfs also extend the trend observed in B08 of [O iii]88/LTIR decreasing with increasing LTIR and LTIR/LB, which is weaker for the dwarfs (ρ ≃ − 0.4) than for the B08 galaxies (Fig. 5). This suggests enhanced [O iii] emitting volume when the escape fractions are high. However, there are multiple possible interpretations of those correlations. [O iii]/LTIR could also be reduced by a significant fraction of the LTIR emission unrelated to star formation. However similar behavior is observed in [O iii]/[O i] (see Fig. 4f). Because both of these lines are directly related to star formation, we rule out this interpretation. It is also possible that LTIR/LB does not directly measure the covering factor of the star-forming regions if there is a significant contribution from field stars to the B-band luminosity. We have tested this possibility by making similar diagrams for galaxies with available K-band (field star dominated) and FUV (young stars) data. We find that [O iii]/LTIR is actually more strongly correlated with LTIR/LFUV than with LTIR/LB and uncorrelated with LTIR/LK, which favors an interpretation in terms of UV escape fraction. Thus the correlations are best explained by the combination of high stellar effective temperature on galaxy-wide scales, resulting in high [O iii] emission, and enhanced ISM porosity with lower LTIR and LTIR/LB, which in turn allows UV photons to excite O++ on larger spatial scales. On the other hand, [O iii]88/LTIR is uncorrelated with FIR band ratios in the dwarfs, while B08 find an increase of [O iii]88/LTIR with F60/F100. They attribute this increase in warmer galaxies to a higher density of H ii regions. As discussed in Sect. 3.3, [O iii] may also originate from low-density ionized gas, hence flattening the relation in dwarfs.
3.4.3. [C ii]157/LTIR and [O i]63/LTIR
The ratio of [C ii]/LTIR spans more than an order of magnitude in the DGS galaxies, from 0.04 to 0.7%, with a median value of 0.25%. The ratio of [O i]63/LTIR does not vary significantly among the dwarfs, with a median value of 0.17%. Both ratios have median values slightly higher in the dwarfs than in B08. Together, the median value of ([C ii]157 +[O i]63)/LTIR is 0.47%. Since [C ii] and [O i]63 are the main coolants of the PDR, where the gas heating is dominated by photoelectric effect on dust grains, which cool through LTIR, the ([C ii] +[O i]63)/LTIR ratio is often used as a proxy for the photoelectric efficiency (e.g., Tielens & Hollenbach 1985). The larger spread in the [C ii]/LTIR values compared to [O i]63/LTIR (Fig. 5) may hint towards different origins of the [C ii] line (ionized/neutral gas) or different conditions of the [C ii]-emitting phases (as [C ii] saturates for densities ≥104 cm-3). Since the spread in ([O i]63 +[C ii])/LTIR is smaller compared to that seen in [C ii]/LTIR (0.15 dex compared to 0.26 dex), a mixture of dense and diffuse phases overall compensate for the differences in the [O i]63 and [C ii] emission.
The only, weak, trend identified in the dwarfs with FIR color is a decrease of [C ii]/LTIR (ρ = −0.47); this has been observed in the B08 galaxies, although the trend is less pronounced. This can be interpreted as a compactness effect with reduced emission in denser and/or warmer environments (e.g., Malhotra et al. 2001). Moreover, [O i]63/LTIR is weakly anti-correlated with LTIR. The dwarfs seem to extend the correlation observed in B08 of [C ii]157/LTIR and [O i]63/LTIR decreasing with increasing LTIR/LB (ρ ≃ − 0.62). The decrease in the [O i]63/LTIR values is small compared to the decrease in the [C ii]/LTIR values. As a result, ([C ii]157 +[O i]63)/LTIR also decreases with increasing LTIR (ρ ≃ − 0.52) and LTIR/LB (ρ ≃ − 0.81). We discuss those high line-to-LTIR and correlations further in Sect. 5.2.
3.4.4. [C ii] + [O i]63 + [O iii])/LTIR
The ratio of ([C ii] +[O i]63 +[O iii])/LTIR spans values from 0.4 to 2.1, with a median of 1.03. This is about 3 times higher than in the B08 sample. The sum of [C ii] +[O i]63 +[O iii] may be regarded as the budget of the gas cooling (not a proxy for the photoelectric efficiency), which is clearly enhanced in the dwarfs, and LTIR as the total dust cooling.
Following the previous remarks, this ratio is uncorrelated with FIR color, as [O iii] dominates the FIR line cooling and no relation was found for [O iii]/LTIR, but it clearly anti-correlates with LTIR and LTIR/LB (ρ ≃ −0.6, −0.7). The DGS galaxies extend the trends observed in the B08 sample.
3.5. Summary of correlation analysis
In summary, the dwarfs present high [O iii]/[N ii], [C ii]/[N ii], [O iii]/[O i], [C ii]/LTIR, [O i]/LTIR, and [O iii]/LTIR ratios, which set them apart as a group from metal-rich galaxies. Within the ensemble of dwarfs, we do not find evident correlations between their FIR emission and the considered parameters (metallicity, F60/F100, LTIR, LTIR/LB), which indicates that their observed properties are not controlled by a single parameter.
The interpretation of the observed trends is not straightforward since several factors act and compete in the emission of the cooling lines and LTIR. These factors include cloud physical conditions, mixing of ISM phases, geometry, dust properties, and photoelectric efficiency. They all play a role to some extent since the observed ratios are values integrated over full-size galaxies.
4. Trend analysis with radiative transfer models
In this section, we characterize the range of physical conditions describing the ISM, more specifically the H ii region and the PDR, of the DGS galaxies. We aim to interpret the observed group behavior in Sect. 3 with radiative transfer modeling, and in particular, to identify how the parameter space of average physical conditions change compared to metal-rich galaxies.
We note that there is no study on large samples of galaxies that self-consistently models the H ii region and the PDR, besides the work on IR luminous galaxies by Abel et al. (2009) and Graciá-Carpio et al. (2011) and on individual objects in Kaufman et al. (2006). We aim for a general comparison of the metal-rich and metal-poor datasets, and leave the detailed ISM modeling of the dwarf galaxies for Paper II.
4.1. Line ratios and typical conditions in metal-rich galaxies
For the PDR properties of “normal” metal-rich galaxies, we only use entries from Brauher et al. (2008) that have LTIR between 109 and 1012 L⊙ (~130 galaxies) to exclude extreme sources. More than half of that sample, comprising normal, starburst, and AGN galaxies was analyzed by Malhotra et al. (2001) and Negishi et al. (2001), who constrained the physical conditions in the PDR using the Kaufman et al. (1999) models and found nH ≃ 102 − 4.5 cm-3 and G0 ≃ 102 − 4.5. In the comparison to PDR models, Malhotra et al. (2001) and Negishi et al. (2001) correct for a non-PDR contribution to the [C ii] emission which is on the order of 50%. In the dwarfs, we have estimated in Sect. 3.3.6 that this fraction is likely <15%. We apply a correction of 10% for non-PDR [C ii] emission to our sample.
For the H ii region properties of metal-rich galaxies, we refer to the studies on MIR ionic lines of the Spitzer Infrared Nearby Galaxies Survey (SINGS; Dale et al. 2009) and of the luminous IR galaxies from GOALS (Inami et al. 2013). We consider neon and sulphur measurements for the galaxies in the luminosity range LTIR≃ 109−1012 L⊙ (~190 sources). The [S iii]18/[S iii]33 ratio is traditionally used as a tracer of the electron density (e.g., Dudik et al. 2007), and the [Ne iii]15/[Ne ii]12 and [S iv]10/[S iii]18 are diagnostics of the hardness of the radiation field (Giveon et al. 2002; Verma et al. 2003; Groves et al. 2008). A typical solution for the H ii region of those metal-rich galaxies has an electron density ne ≃ 350 cm-3 and ionization parameter log U ≃ −3 (Dale et al. 2009; Inami et al. 2013). For comparable constraints on the H ii region properties in the dwarf galaxies, we use the IRS fluxes extracted for the compact DGS galaxies in Sect. 2.2. Table 3 lists the median line ratios for the metal-rich and metal-poor galaxies.
We refer to the H ii region and PDR conditions for normal galaxies as the metal-rich fiducial model (Table 3).
Observed and modeled properties of the dwarfs and normal galaxies.
4.2. Model parameters
We model the H ii region and PDR simultaneously with the spectral synthesis code Cloudy v.13.03 (Ferland et al. 2013). The geometry is 1D spherical, consisting of the central source of energy surrounded by a cloud of material. The source of radiation is chosen as a young starburst that we simulate with Starburst99 (Leitherer et al. 2010). Following Dale et al. (2009), we adopt a 10 Myr continuous star formation scenario (with a Kroupa IMF and Geneva stellar tracks), and fix its luminosity to 109 L⊙.
We vary the following physical conditions: the hydrogen density (nH; from 101.0 to 105.0 cm-3 in increments of 0.5 dex) and the inner radius (rin; from 1019.7 to 1022.0 cm, or 15 pc to 3200 pc, in increments of 0.3 dex), which is the distance between the starburst and the surface of the modeled ISM shell. For each model, we compute U, G0, and the IRAS F60/F100 band ratio. The FIR color is strongly correlated with the ionization parameter U which is varied through the density and radius. It is defined as  , where Q(H) is the number of ionizing photons and c is the speed of light. G0 is the intensity of the FUV radiation field taken at the PDR front, in units of 1.6 × 10⁻³ erg cm-2 s-1 (Habing 1968).
The gas-phase abundances are representative of the ISM (averages of observations in our galaxy), with ZISM = 12 + log (O/H) = 8.5, and given in Table 3. The grain composition and size distribution are assumed typical of the galactic ISM, with RV = 3.1 (Weingartner & Draine 2001). The dust-to-gas mass ratio is 6.3 × 10⁻³ and the PAH abundance (number of grains per hydrogen) is PAH/H = 1.5 × 10⁻⁷ (Abel et al. 2008), corresponding in mass to M(PAH) /M(dust) = 0.02. The mean metallicity measured in the DGS sample with the Pilyugin & Thuan (2005) calibration is 12 + log (O/H) = 7.9. In the SINGS galaxies, it is 12 + log (O/H) = 8.4 with the Pilyugin & Thuan (2005) calibration and 12 + log (O/H) = 9.0 with the Kobulnicky & Kewley (2004) calibration (Moustakas et al. 2010), with larger discrepancies in the methods for massive galaxies (Kewley & Ellison 2008). Therefore we take for representative metallicity of the metal-rich galaxies 12 + log (O/H) = 8.7. We run two grids of models, one at metallicity 0.25 ZISM for the dwarf galaxies, and one at metallicity 2 ZISM for the metal-rich galaxies. For the model grids, the metallicity of the stellar tracks as well as the metal, grain, and PAH abundances in Cloudy are scaled to the metallicity of the model (0.25 or 2). We also include a turbulent velocity of 1.5 km s-1, as done in Kaufman et al. (1999). All models are stopped at an AV of 10 mag (corresponding to a column density of N(H) = 1023 and 1022 cm-2 for the low and high-metallicity grids, respectively), to ensure that they go deep enough in the PDR. We note that the main PDR tracers are mostly formed at lower AV and changing the column density around those values does not change their emission significantly. The grids are generated assuming constant density.
4.3. Model results
Figure 6 shows the model results for the high and low-metallicity grids. To extract information on the ISM properties, we concentrate on the following ratios: [S iii]18/[S iii]33, [S iv]10/[S iii]18, [Ne iii]15/[Ne ii]12, [O iii]88/[N ii]122, [O iii]88/LTIR, for the H ii region; [O i]63/[C ii]157, [C ii]157/LTIR, [O i]63/LTIR for the PDR. The IRAS F60/F100 band ratio and the G0 of the models are also plotted. To ease the comparison with the literature, we plot quantities in the H ii region as a function of U and in the PDR as a function of G0. First of all, we notice that all observed ratios (except [O iii]/LTIR) are covered by the model grids, hence we can identify a parameter space that is favored for the dwarfs. Fiducial model parameters for the high and low-metallicity cases are given in Table 3.
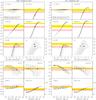 |
Fig. 6 Cloudy predictions of the line intensities as a function of ionization parameter, U, and radiation field, G0. Each connected track correspond to a given density (black = 101.0 cm-3; light gray = 105.0 cm-3, in steps of 0.5 dex). The observed ratios are indicated by the yellow (dwarf galaxies) and red hashed (normal galaxies) bands. The [O i]/[C ii] and [C ii]/LTIR values corrected for non-PDR [C ii] emission. The stars/squares show the fiducial H ii region/PDR models for the dwarfs (green symbols) and the normal galaxies (red symbols). Left: results for the high-metallicity (2 ZISM) grid of models. Right: results for the low-metallicity (0.25 ZISM) grid of models. The fiducial model for normal galaxies is added to the low-metallicity panel for comparison (smaller red symbols). |
4.3.1. Conditions in the H ii region: high-metallicity case
In the high-metallicity case (left panel of Fig. 6), the fiducial model for the H ii region agrees partially with the observed IRS line ratios of metal-rich galaxies. The [S iii]33/[S iii]18 ratio is relatively independent of U and the observed values agree best with densities between 100 and 1000 cm-3. Both [Ne iii]15/[Ne ii]12 and [S iv]10/[S iii]18 ratios are quite sensitive to U, the age of the burst, and less to density. The [Ne iii]15/[Ne ii]12 ratio is slightly over-predicted by the fiducial model. The median and dispersion values of this ratio reported in Table 3 are driven by the GOALS galaxies, while a few SINGS galaxies clearly have higher [Ne iii]15/[Ne ii]12 ratios (Dale et al. 2009). Inami et al. (2013) have investigated the influence of metallicity and star-formation history (continuous versus bursty) on the predicted [Ne iii]15/[Ne ii]12 ratio. They demonstrate that their observed [Ne iii]15/[Ne ii]12 values are best match by models with young instantaneous bursts rather than continuous star formation models which systematically over-predict this ratio. The largest discrepancy between observations and model predictions is seen for the [S iv]10/[S iii]18 ratio, which is under-predicted by one order of magnitude. Part of this discrepancy is due to an observational bias because the detection rate of the [S iv]10 line is lower (about 4 times less than the neon lines). For the galaxies where [S iv]10/[S iii]18 is detected, the [Ne iii]15/[Ne ii]12 ratios are higher than the reported median value. The [Ne iii]15/[Ne ii]12 and [S iv]10/[S iii]18 ratios are well correlated, and extrapolating this correlation to all galaxies where [Ne iii]15/[Ne ii]12 is detected would lower the observed median ratio of [S iv]10/[S iii]18 by a factor of ~3. Despite this correction, it seems difficult to reproduce the [Ne iii]15/[Ne ii]12 and [S iv]10/[S iii]18 ratios simultaneously with our high-metallicity grid.
Concerning the PACS lines, both [O iii]/LTIR and [O iii]/[N ii]122 are well matched by the fiducial model. This suggest that [O iii]88/[N ii]122 may be used as an indicator of the hardness of the radiation field as an alternative to the IRS ratios. This model also predicts that about 10% of the [C ii] emission is originating in the ionized gas, while Malhotra et al. (2001) and Negishi et al. (2001) estimated a ~50% contribution using the [N ii]122 line alone. Since we have taken into account multiple ionic lines, our derivation of the H ii region properties is more robust and the previous ionized gas [C ii] fractions may have been over-estimated. Alternatively, an unmodeled low-density, low-ionization component may increase this fraction by emitting more [C ii] (and [N ii]), but is not necessary here to match the observations.
4.3.2. Conditions in the H ii region: low-metallicity case
The observed [S iii]33/[S iii]18 ratios are similar in dwarf and normal galaxies, and again agree well with densities between 100 and 1000 cm-3. From observations, the [Ne iii]15/[Ne ii]12, [S iv]10/[S iii]18, and [O iii]88/[N ii]122 ratios are higher in the dwarf galaxies than in metal-rich galaxies, which is a clear indication of harder radiation fields (e.g., Madden et al. 2006). At low metallicity, the model predictions for those line ratios are higher by a factor of ~5 than in the high-metallicity grid (for a given set of nH and U) because the radiation field of the starburst is harder. This can be seen by the shift of position of the red star from the left to the right panels in Fig. 6. Even with the change of the starburst metallicity, the observations still require higher U to better match the observed [O iii]/[N ii]122 ratio. While log U = −3 agrees well with the observed ratios in normal galaxies, log U = −2.5 agrees better with observations for the dwarf galaxies. The [Ne iii]15/[Ne ii]12 and [S iv]10/[S iii]18 ratios are slightly over and under-predicted, respectively, by the model, as in the high-metallicity case. Going to higher U, the [O iii]/LTIR, which is also higher in the dwarfs than in the normal galaxies, is then better reproduced by marginally lower densities (nH ≃ 102 cm-3), but at the expense of a less well predicted [S iii] line ratio. As a best compromise, we take log U = −2.5 and nH = 102 cm-3 as parameters for our fiducial low-metallicity H ii region model. In those conditions, our fiducial model predicts that only 1% of the [C ii] emission is originating in the ionized gas for the dwarf galaxies. However, the [O iii]/LTIR ratio remains under-predicted by all the grid models. We discuss the origin of this major discrepancy in Sect. 5.
4.3.3. Conditions in the PDR: high-metallicity case
In the PDR, the ratios of [O i]/[C ii], [C ii]/LTIR, and [O i]/LTIR are sensitive to both density and G0. With nH ≃ 103.5 cm-3 and log G0 ≃ 3.3, the fiducial PDR model for metal-rich galaxies matches well all three ratios (bottom, left panels of Fig. 6). This diagram also shows that, if more [C ii] emission were originating from the PDR than the 50% assumed here, reducing the density and G0 values by 0.5 dex would suffice.
However, the F60/F100 band ratio is over-predicted by a factor of ~2 for the metal-rich galaxies. Contrary to the dwarfs, a substantial fraction of the dust emission at wavelengths ≥100 μm may not be related to the star-forming regions in normal galaxies (e.g., Dale et al. 2007; Bendo et al. 2012a, 2015; De Looze et al. 2014b). If old stars contribute to dust heating, and thus to the FIR emission, the line-to-LTIR ratios associated with the star formation would be higher than observed, which would imply a lower G0 than deduced currently. Alternatively, since F60/F100 is sensitive to AV and all models are stopped at AV of 10 mag, the IRAS band ratios of the normal galaxies may be under-estimated by the models.
4.3.4. Conditions in the PDR: low-metallicity case
Considering the low-metallicity case, the predictions for [O i]/[C ii] decrease by a factor of ~2 (bottom, right panel of Fig. 6) owing to a decrease in the PDR temperature (Röllig et al. 2006). Moreover, in the models with U ≥ 10-2, we observe two effects. First, those models have low densities and as a consequence the thickness of the cloud becomes larger than the inner radius. As a result, there is significant geometric dilution of the UV radiation field. The C+ and O0 emitting layers are larger, and thus [C ii]/LTIR and [O i]/LTIR ratios are high. Second, regardless of metallicity, there is more dust absorption in the H ii region at those high-U values (Abel et al. 2009), and thus little increase of G0 in the PDR for increasing U. As a consequence, the predicted ratios of [O i]/[C ii], [C ii]/LTIR and [O i]/LTIR flatten out with U.
The observed [O i]/[C ii] ratios in the dwarfs and normal galaxies are similar, while [C ii]/LTIR and [O i]/LTIR are higher in the dwarfs. The ratios of the dwarfs indicate lower G0 or higher nH values. We find that a solution with nH ≃ 104 cm-3 and log G0 ≃ 2.5 is adequate to reproduce all three ratios. This PDR solution agrees with the observed F60/F100 band ratio for the dwarfs.
5. Discussion
5.1. Interpretation in terms of ISM structure
The fiducial models imply different sizes for the low-metallicity and high-metallicity components (Table 3). The ionic lines are emitted by a modeled shell, for which the size can be converted to an effective Strömgren radius RS, eff. which can be thought of as a cumulative volume of H ii regions in a galaxy. As an example, for the high-metallicity case, RS, eff of 16 pc corresponds to about one hundred H ii regions if we consider each to have a typical radius of 3–4 pc. Because the fiducial low-metallicity H ii region model has harder radiation field and lower density, we find that its effective radius is three times larger than that of the high-metallicity H ii region. The depth of the PDR, defined as the location where the gas is half atomic half molecular, is similar in the low-metallicity and high-metallicity ISM. However, the low-metallicity PDR is located further away.
Discrepancies in the predicted [O iii]/LTIR ratios between the high and low-metallicity grids are mainly due to a reduced gas-phase metallicity. This reduces the absolute [O iii] emission produced in the H ii region, while both grids of models have the same, fixed input luminosity which is fully reprocessed in the PDR, exiting as LTIR (no escaping UV). To increase the predicted ratios of ionic lines to LTIR and better match the observations, we would need to reduce significantly the mean AV of the models. This can be achieved by accounting for an escape fraction, reducing the covering factor of the PDR (hence LTIR and the average column density). In other words, the emission from the PDR must be reduced relative to that of the H ii region, by a factor of approximately 3 in our case (for the green star to fall on the observed median [O iii]/LTIR value in the right panel of Fig. 6). Lower PDR covering factors were also required in the detailed, multi-phase modeling of Haro 11 (Cormier et al. 2012). The fact that the median value of LTIR/LB, which represents the fraction of obscured/unobscured emission, is ~2 in the B08 galaxies and 0.7 in the DGS galaxies corroborates our finding of lower PDR covering factors for the low-metallicity models. This also confirms the observed trend of decreasing [O iii]/LTIR with increasing LTIR/LB. The high escape fraction in dwarf galaxies is also observed in their SEDs (e.g., Galliano et al. 2008).
The higher ratios of [O i] and [C ii] to LTIR indicate lower U in the low-metallicity PDR, which can be interpreted as a change of ISM configuration. Since the H ii region and PDR low-metallicity fiducial models have the same G0 (see Fig. 6), placing the PDR adjacent to the H ii region and increasing the density would result in lowering U. In the high-metallicity fiducial model, G0 is higher in the PDR than in the H ii region, which would require to place the PDR inside the H ii region. Combined with the fact that the low-metallicity H ii region fills a larger volume than the high-metallicity H ii region, this implies that the minimum distance of the low-metallicity PDR to the starburst should be 6 times larger than in the high-metallicity setting. The increase in the typical PDR distance is a natural consequence of a lower covering factor.
These considerations highlight a change in the ISM structure and PDR distribution of low-metallicity galaxies, where the filling factor of ionized gas relative to the PDRs is higher than in metal-rich galaxies. The extent of the H ii region is bigger and the UV photons travel larger distance before they reach a PDR clump.
5.2. Interpretation of the [C II]/LTIR and [O I]/LTIR trends
In Sect. 3.4, we observed that the line-to-LTIR ratios decrease with increasing LTIR and LTIR/LB, and that [C ii]/LTIR is anti-correlated with F60/F100. Using the PDR models, we discuss which physical effects dominate in producing these trends.
Line-to-LTIR ratios have been studied extensively in massive galaxies (normal, star-forming galaxies and ULIRGs). They give the budget of the gas cooling over the dust cooling. The ([C ii] +[O i]63)/LTIR ratio, a common measure of the photoelectric efficiency in the PDR, is observed to vary (see Fig. 5), with a clear deficit of [C ii]/LTIR in ULIRGs (Luhman et al. 2003; Díaz-Santos et al. 2013), and FIR lines in general (Graciá-Carpio et al. 2011), as well as a decrease with FIR color in star-forming galaxies (Malhotra et al. 2001). Several hypotheses to explain the apparent line deficit in galaxies include (1) more dust screening at high ionization parameter (Luhman et al. 2003; Abel et al. 2009); (2) lower photoelectric efficiency due to charged small dust grains under intense radiation fields (Malhotra et al. 2001; Croxall et al. 2012); (3) lower photoelectric efficiency due to a decrease in the PAH abundance under hard radiation fields (Madden et al. 2006; Rubin et al. 2009); and (4) large dust optical depths leading to extinction of the emission lines (Papadopoulos et al. 2010; Rangwala et al. 2011). The dwarf galaxies extend the relative importance of the gas cooling to high values. Here, we aim to investigate which of those interpretations can explain the difference from the normal to the dwarf galaxies.
Because of their low dust content, variations in grain abundances and charging could affect the photoelectric efficiency dramatically in the dwarf galaxies. The quantity LTIR sums emission from several grain populations: from the big grains (predominantly) to the very small grains and PAHs, which are the most important for the photoelectric heating (Bakes & Tielens 1994). Those grains emit from all ISM phases, and the fraction originating in the PDRs themselves is unknown. Star-forming dwarf galaxies generally exhibit enhanced small grain abundances (Galliano et al. 2003), which correlate with H ii regions, and reduced PAH abundances, which mostly trace the PDR, as a result of the hard radiation fields (Madden et al. 2006). Thus those two populations may balance their relative contribution in the photoelectric effect. Moreover, the mean free path of UV photons in low-metallicity environments is larger, resulting in a UV field dilution over larger spatial scales, which reduces grain charging (Israel & Maloney 2011). Sandstrom et al. (2012) find that, even though their abundance is reduced, PAHs are generally more neutral in the star-forming regions of the SMC than in typical spiral galaxies. Lebouteiller et al. (2012) examine both spatial distributions of ([C ii]157 +[O i]63) with LTIR and PAH emission in the star-forming region N11 B of the LMC, and find that PAH emission traces best the gas heating as compared to LTIR. The net result of those considerations is that, overall, the observed ([C ii]157 +[O i]63)/LTIR ratios are high in the dwarfs (even if we subtract a small contribution of the ionized gas to the [C ii] emission), indicating either relatively efficient photoelectric heating or non-photoelectric excitation of these lines (cosmic rays, X-rays, etc.). The ratios tend to flatten out to 1% at low luminosity, which could indicate a ceiling on the photoelectric efficiency. The influence of more involved changes to the modeling (decrease of PAH abundance, grain size distribution, or X-ray illumination) will be examined in Paper II. Here we conclude that a simple change in geometry, by putting the cloud further away, with viable density and illumination conditions can suffice to explain the high observed line-to-LTIR ratios.
[C ii]/LTIR and, to a lesser extent, [O i]63/LTIR decrease as G0 increases (Fig. 6). Two main effects are responsible for that: the increased grain charging and increased dust-to-gas opacity which cause a larger fraction of the radiation to go into heating the dust. The dwarfs show high [C ii]/LTIR and [O i]/LTIR because G0 and G0/nH (which traces grain charging) are lower in the low-metallicity PDR than found in normal galaxies (Malhotra et al. 2001). Since [O i]63 increases faster with G0 than [C ii], [O i]63/LTIR is less affected, except at the highest G0 values. We also note that, [O i]63 being more sensitive to density than [C ii], [O i]63/LTIR increases with nH for a given G0. In the models, F60/F100 follows immediately from G0. The anti-correlation between [C ii]/LTIR and the FIR band ratio, which we interpreted as an effect of compactness, is evident in Fig. 6, and the lack of correlation between [O i]63/LTIR and FIR color agrees with the models. The stronger dependency of [C ii]/LTIR on G0 compared to [O i]63/LTIR may account for the larger scatter in the observed [C ii]/LTIR values. The positive correlation between [O i]63/[C ii]157 and FIR color is also reproduced by the models, which may be understood as an aging effect of the star-forming regions that expand as they age. The models do not show significant optical depth effects. The fact that the [O i]145 line would become optically thick at higher column densities than [O i]63, and that [O i]145 and [O i]63 behave similarly with LTIR and FIR color in the observations also confirms the absence of optical depth effects at those physical scales. Nevertheless, given the low statistics that we have for the [O i]145 line and that [O i]145 is uncorrelated with LTIR/LB, we cannot confidently rule out optical depth effects.
Overall, the low-metallicity PDRs are described by a low-G0 regime accompanied by a density increase. This low G0/nH causes UV field dilution and reduces grain charging (Israel & Maloney 2011). The proposed changes in ISM structure can therefore explain the higher line-to-LTIR ratios found at lower LTIR and LTIR/LB (i.e. increased porosity with lower filling factor of dense phases), as noted in Sect. 3.4.
6. Conclusions
We present observations of the FIR fine-structure cooling lines [C ii] 157 μm, [O i] 63 and 145 μm, [O iii] 88 μm, [N iii] 57 μm, and [N ii] 122 and 205 μm obtained with the PACS spectrometer onboard Herschel in 48 low-metallicity galaxies from the Dwarf Galaxy Survey.
-
The brightest FIR line in thedwarfs is [O iii], on averagetwice brighter than [C ii], the[O iii]88/[C ii]157 ratio varyingfrom 0.5 to 13. The FIR lines are bright relativeto the TIR luminosity, together accounting for several per-cents of LTIR. [C ii]/LTIR range from 0.04 to 0.7% and([C ii]157 +[O i]63)/LTIR range from 0.2to 1.0%, which is about twice as high as in metal-rich galaxies. Thegas cooling is enhanced on galaxy-wide scales. When zoomingin onto the active regions of the LMC, line-to-LTIR ratios are generallyhigher than galaxy-integrated values. This matches our inter-pretation that the dwarf galaxies are dominated by emission fromtheir star-forming regions even on galaxy integrated scales.
-
When compared to the Brauher et al. (2008) ISO sample, the dwarf galaxies occupy a completely different parameter space than the more metal-rich galaxies in several central tracers. In particular, the [O iii]88/[N ii]122, [N iii]57/[N ii]122, [C ii]157/[N ii]122, and [O iii]88/[O i]63 line ratios are very high in the dwarfs, which we interpret in terms of radiation field hardness and phase filling factor, with prominent high-excitation ionized regions. In spite of the possible influence of abundance variations, the [O iii]/[N ii] ratio appears to be a good tracer of the radiation field hardness. The low [N ii]122/[C ii]157 ratios indicate that there is no substantial contribution of the ionized gas to the [C ii] emission (typically <15%).
-
With the help of radiative transfer models, the FIR line ratios are interpreted as a change in the ISM properties. The high [C ii]/LTIR and [O iii]/LTIR ratios indicate a combination of moderate FUV fields and low covering factor of the PDR. The structure of the low-metallicity ISM is qualitatively and quantitatively different than found in metal-rich environments, harboring only a low filling factor of dense gas surrounding the star formation sites, embedded in a large volume filling factor of diffuse gas. In this leaky structure, UV photons escape from H ii regions out to large distances. Overall, the filling factor of the ISM affected by the star-forming regions is high.
Given the prospects for observing FIR lines at high redshift (ALMA, NOEMA, CCAT), the [C ii]157, [O iii]88 (twice brighter than [C ii]157), and [O i]63 (as bright as [C ii]157) lines appear as promising diagnostics of the low-metallicity ISM conditions. Each line account for about 0.3% of the TIR luminosity. [C ii]157 is a reliable tracer of the PDR, with little contribution from the ionized gas. [O iii]88 traces the high-excitation ionized gas while [O iii]/[O i] indicates, independently of elemental abundance variations, the filling factor of ionized/neutral phases, which we find high in the low-metallicity star-forming galaxies.
Online material
Line fluxes of the DGS galaxies.
Appendix A: Details of the PACS observing strategy
Technical details about the DGS observations.
Appendix B: Spectral maps and line profiles of the Herschel Dwarf Galaxy Survey
Atlas of the PACS spectroscopy data. For each spectral line, the flux map and spectrum of the brightest spatial pixel, which position is indicated by a black cross on the map, are shown. White circles represent the PACS beam sizes. We note that the maps are not PSF-deconvolved.
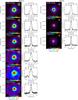 |
Fig. B.1 PACS spectroscopy data of all galaxies of the Dwarf Galaxy Survey. For each galaxy, flux maps are shown on the left and line profiles over the brightest position, indicated by a cross on the map, are shown on the right. White circles represent the PACS beam sizes (FWHM of ~9′′ at 60 μm and 12′′ at 160 μm). The spectral resolution is 90 km s-1 at 60 μm and 240 km s-1 at 160 μm. |
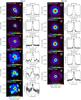 |
Fig. B.1 continued. |
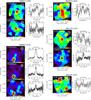 |
Fig. B.1 continued. |
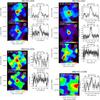 |
Fig. B.1 continued. |
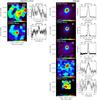 |
Fig. B.1 continued. |
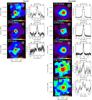 |
Fig. B.1 continued. |
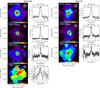 |
Fig. B.1 continued. |
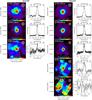 |
Fig. B.1 continued. |
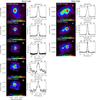 |
Fig. B.1 continued. |
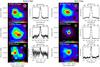 |
Fig. B.1 continued. |
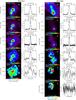 |
Fig. B.1 continued. |
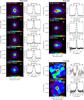 |
Fig. B.1 continued. |
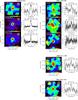 |
Fig. B.1 continued. |
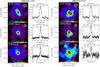 |
Fig. B.1 continued. |
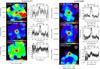 |
Fig. B.1 continued. |
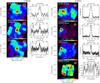 |
Fig. B.1 continued. |
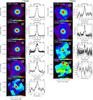 |
Fig. B.1 continued. |
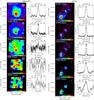 |
Fig. B.1 continued. |
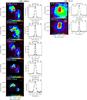 |
Fig. B.1 continued. |
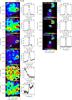 |
Fig. B.1 continued. |
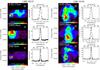 |
Fig. B.1 continued. |
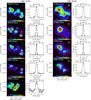 |
Fig. B.1 continued. |
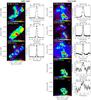 |
Fig. B.1 continued. |
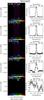 |
Fig. B.1 continued. |
Appendix C: Spitzer IRS fluxes of the compact DGS galaxies
We have extracted IRS data of the compact DGS galaxies, as described in Sect. 2.2.1. Fluxes of the main MIR fine-structure cooling lines are listed here (Table C.1 for the low-resolution data and Table C.2 for the high-resolution data).
The spectra of the short and long wavelength modules of the IRS were calibrated using a correction based on the spatial extent of the source. The correction, which is wavelength-dependent, assumes a spherical symmetry for the source shape to account for the light that falls outside the slit. Using this correction, there is no significant flux offsets between the spectra of the short and long wavelength modules for the low-resolution data. For the high-resolution data, extended sources are extracted in different apertures which lead to offsets between the spectra of the short and long wavelength modules. In those cases, the short wavelength spectra are stitched to the long wavelength spectra.
We have compared the overall continuum level of the IRS data to the IRAC and MIPS photometry to verify if all emission is recovered by our reduction (i.e. total flux for the galaxy). This is generally the case, except for NGC 1569 which is clearly more extended than the IRS slit. For reference, we indicate in Table C.1 the ratio of the observed-to-synthetic MIPS 24 μm flux, denoted RMIPS24. The observed photometry is from Bendo et al. (2012b) and the synthetic photometry is measured from the IRS data using the MIPS filter profile. This scaling factor should be applied to obtain total IRS fluxes. We opt for the 24 μm emission because it arises from active star-forming regions and it is less affected by IRS module stitching than the shorter wavelengths. We note that observed-to-synthetic IRAC 8 μm fluxes are further offset by a factor ~1.8 in 3 galaxies with strong PAH emission (He 2-10, Mrk 1089, NGC 1140). This could be due to PAH (and PDR line) emission outside of the IRS slit as those galaxies show extended structures or to calibration uncertainties.
In Table C.2, we also indicate the average ratio between the high-resolution and low-resolution fluxes of the main spectral lines, denoted HR/LR. Line fluxes generally agree within 20% around that ratio. Differences are mainly due to the extraction method and source extent. [Ne ii] and the PAH feature at 12.7 μm, as well as [O iv] and [Fe ii] at 25.9 μm, are resolved and thus more accurately measured with the high-resolution mode.
Low-resolution MIR line fluxes in the compact galaxies of the DGS.
High-resolution MIR line fluxes in the compact galaxies of the DGS.
Appendix D: IRAS and PACS photometry of the compact sample
LTIR, IRAS 60/100, and PACS 70/100 band ratios.
Appendix E: Line broadening and rotation in the PACS maps
We find that the [O iii]88 and [O i]63 lines, which are bright with smallest instrumental FWHM, are the most often broadened. The line widths are typically ~100 km s-1 larger than the instrumental profile in the brightest sources. For the fainter lines, it is more difficult to determine confidently whether or not broadening is present. Broadening of the [C ii]157 line can only be accurately calculated for intrinsic line widths larger than 150 km s-1 because of its large instrumental FWHM of 240 km s-1. When observed, [N iii]57 is similarly broadened as are [O iii]88 and [O i]63. Such broadening indicates the possible presence of strong turbulent motions, or that multiple components contribute to the emission of those lines. The fact that we find similar intrinsic line widths for all tracers, despite their different origins, indicates that either they are spatially mixed within our beam (which is certainly the case for our compact sources), or that they are affected similarly by the source of this broadening (internal kinematics). Several galaxies also display clear signs of rotation in all observed spectral lines.
Broadening of the FIR lines (in km s-1).
More information available in the PACS Observer’s Manual (v.2.5.1).
Even though we plot line over LTIR versus LTIR, these diagrams are still useful as the x-axis is an indicator of galaxy size while the y-axis probes the heating and cooling physics of the ISM.
Acknowledgments
We are grateful to A. Poglitsch, A. Contursi, J. Graciá Carpio, B. Vandenbussche, and P. Royer for their help with the PACS data. We thank D. Dale for sharing the B-band data of the normal galaxies with us and the referee for careful reading of the manuscript. We acknowledge support from the Agence Nationale de la Recherche (ANR) through the programme SYMPATICO (Program Blanc Projet ANR-11-BS56-0023). IDL is a postdoctoral researcher of the FWO-Vlaanderen (Belgium). PACS has been developed by a consortium of institutes led by MPE (Germany) and including UVIE (Austria); KU Leuven, CSL, IMEC (Belgium); CEA, LAM (France); MPIA (Germany); INAF-IFSI/OAA/OAP/OAT, LENS, SISSA (Italy); IAC (Spain). This development has been supported by the funding agencies BMVIT (Austria), ESA-PRODEX (Belgium), CEA/CNES (France), DLR (Germany), ASI/INAF (Italy), and CICYT/MCYT (Spain). This research has made use of the NASA/ IPAC Infrared Science Archive, which is operated by the Jet Propulsion Laboratory, California Institute of Technology, under contract with the National Aeronautics and Space Administration.
References
- Abel, N. P., Sarma, A. P., Troland, T. H., & Ferland, G. J. 2007, ApJ, 662, 1024 [NASA ADS] [CrossRef] [Google Scholar]
- Abel, N. P., van Hoof, P. A. M., Shaw, G., Ferland, G. J., & Elwert, T. 2008, ApJ, 686, 1125 [Google Scholar]
- Abel, N. P., Dudley, C., Fischer, J., Satyapal, S., & van Hoof, P. A. M. 2009, ApJ, 701, 1147 [NASA ADS] [CrossRef] [Google Scholar]
- Bakes, E. L. O., & Tielens, A. G. G. M. 1994, ApJ, 427, 822 [NASA ADS] [CrossRef] [Google Scholar]
- Bendo, G. J., Boselli, A., Dariush, A., et al. 2012a, MNRAS, 419, 1833 [NASA ADS] [CrossRef] [Google Scholar]
- Bendo, G. J., Galliano, F., & Madden, S. C. 2012b, MNRAS, 423, 197 [NASA ADS] [CrossRef] [Google Scholar]
- Bendo, G. J., Baes, M., Bianchi, S., et al. 2015, MNRAS, 448, 135 [NASA ADS] [CrossRef] [Google Scholar]
- Bennett, C. L., Fixsen, D. J., Hinshaw, G., et al. 1994, ApJ, 434, 587 [CrossRef] [Google Scholar]
- Bernard-Salas, J., Habart, E., Arab, H., et al. 2012, A&A, 538, A37 [NASA ADS] [CrossRef] [EDP Sciences] [Google Scholar]
- Boselli, A., Gavazzi, G., Lequeux, J., & Pierini, D. 2002, A&A, 385, 454 [NASA ADS] [CrossRef] [EDP Sciences] [Google Scholar]
- Brauher, J. R., Dale, D. A., & Helou, G. 2008, ApJS, 178, 280 [NASA ADS] [CrossRef] [Google Scholar]
- Cigan, P., Young, L., Cormier, D., et al. 2015, ApJ, submitted [Google Scholar]
- Cormier, D., Lebouteiller, V., Madden, S. C., et al. 2012, A&A, 548, A20 [NASA ADS] [CrossRef] [EDP Sciences] [Google Scholar]
- Cormier, D., Madden, S. C., Lebouteiller, V., et al. 2014, A&A, 564, A121 [NASA ADS] [CrossRef] [EDP Sciences] [Google Scholar]
- Cowie, L. L., & Songaila, A. 1986, ARA&A, 24, 499 [NASA ADS] [CrossRef] [Google Scholar]
- Croxall, K. V., Smith, J. D., Wolfire, M. G., et al. 2012, ApJ, 747, 81 [NASA ADS] [CrossRef] [Google Scholar]
- Dale, D. A., & Helou, G. 2002, ApJ, 576, 159 [NASA ADS] [CrossRef] [Google Scholar]
- Dale, D. A., Gil de Paz, A., Gordon, K. D., et al. 2007, ApJ, 655, 863 [NASA ADS] [CrossRef] [Google Scholar]
- Dale, D. A., Smith, J. D. T., Schlawin, E. A., et al. 2009, ApJ, 693, 1821 [NASA ADS] [CrossRef] [MathSciNet] [Google Scholar]
- De Breuck, C., Williams, R. J., Swinbank, M., et al. 2014, A&A, 565, A59 [NASA ADS] [CrossRef] [EDP Sciences] [Google Scholar]
- De Looze, I., Baes, M., Bendo, G. J., Cortese, L., & Fritz, J. 2011, MNRAS, 416, 2712 [Google Scholar]
- De Looze, I., Cormier, D., Lebouteiller, V., et al. 2014a, A&A, 568, A62 [NASA ADS] [CrossRef] [EDP Sciences] [Google Scholar]
- De Looze, I., Fritz, J., Baes, M., et al. 2014b, A&A, 571, A69 [NASA ADS] [CrossRef] [EDP Sciences] [Google Scholar]
- Díaz-Santos, T., Armus, L., Charmandaris, V., et al. 2013, ApJ, 774, 68 [NASA ADS] [CrossRef] [Google Scholar]
- Dudik, R. P., Weingartner, J. C., Satyapal, S., et al. 2007, ApJ, 664, 71 [NASA ADS] [CrossRef] [Google Scholar]
- Engelbracht, C. W., Rieke, G. H., Gordon, K. D., et al. 2008, ApJ, 678, 804 [NASA ADS] [CrossRef] [Google Scholar]
- Farrah, D., Lebouteiller, V., Spoon, H. W. W., et al. 2013, ApJ, 776, 38 [NASA ADS] [CrossRef] [Google Scholar]
- Ferland, G. J., Porter, R. L., van Hoof, P. A. M., et al. 2013, Rev. Mex. Astron. Astrofis., 49, 137 [Google Scholar]
- Galliano, F., Madden, S. C., Jones, A. P., et al. 2003, A&A, 407, 159 [NASA ADS] [CrossRef] [EDP Sciences] [Google Scholar]
- Galliano, F., Dwek, E., & Chanial, P. 2008, ApJ, 672, 214 [NASA ADS] [CrossRef] [Google Scholar]
- Galliano, F., Hony, S., Bernard, J.-P., et al. 2011, A&A, 536, A88 [NASA ADS] [CrossRef] [EDP Sciences] [Google Scholar]
- Genzel, R., & Cesarsky, C. J. 2000, ARA&A, 38, 761 [NASA ADS] [CrossRef] [Google Scholar]
- Giveon, U., Sternberg, A., Lutz, D., Feuchtgruber, H., & Pauldrach, A. W. A. 2002, ApJ, 566, 880 [NASA ADS] [CrossRef] [Google Scholar]
- Graciá-Carpio, J., Sturm, E., Hailey-Dunsheath, S., et al. 2011, ApJ, 728, L7 [NASA ADS] [CrossRef] [Google Scholar]
- Griffin, M. J., Abergel, A., Abreu, A., et al. 2010, A&A, 518, L3 [Google Scholar]
- Groves, B., Dopita, M. A., Sutherland, R. S., et al. 2008, ApJS, 176, 438 [NASA ADS] [CrossRef] [Google Scholar]
- Habing, H. J. 1968, Bull. Astron. Inst. Netherlands, 19, 421 [Google Scholar]
- Hailey-Dunsheath, S., Nikola, T., Stacey, G. J., et al. 2010, ApJ, 714, L162 [NASA ADS] [CrossRef] [Google Scholar]
- Houck, J. R., Roellig, T. L., Van Cleve, J., et al. 2004, in SPIE Conf. Ser. 5487, ed. J. C. Mather, 62 [Google Scholar]
- Hunter, D. A., Kaufman, M., Hollenbach, D. J., et al. 2001, ApJ, 553, 121 [NASA ADS] [CrossRef] [Google Scholar]
- Inami, H., Armus, L., Charmandaris, V., et al. 2013, ApJ, 777, 156 [NASA ADS] [CrossRef] [Google Scholar]
- Israel, F. P., & Maloney, P. R. 2011, A&A, 531, A19 [NASA ADS] [CrossRef] [EDP Sciences] [Google Scholar]
- Israel, F. P., Maloney, P. R., Geis, N., et al. 1996, ApJ, 465, 738 [NASA ADS] [CrossRef] [Google Scholar]
- Kaufman, M. J., Wolfire, M. G., Hollenbach, D. J., & Luhman, M. L. 1999, ApJ, 527, 795 [NASA ADS] [CrossRef] [Google Scholar]
- Kaufman, M. J., Wolfire, M. G., & Hollenbach, D. J. 2006, ApJ, 644, 283 [NASA ADS] [CrossRef] [Google Scholar]
- Kewley, L. J., & Ellison, S. L. 2008, ApJ, 681, 1183 [NASA ADS] [CrossRef] [Google Scholar]
- Kobulnicky, H. A., & Kewley, L. J. 2004, ApJ, 617, 240 [NASA ADS] [CrossRef] [Google Scholar]
- Lebouteiller, V., Barry, D. J., Spoon, H. W. W., et al. 2011, ApJS, 196, 8 [NASA ADS] [CrossRef] [Google Scholar]
- Lebouteiller, V., Cormier, D., Madden, S. C., et al. 2012, A&A, 548, A91 [NASA ADS] [CrossRef] [EDP Sciences] [Google Scholar]
- Leitherer, C., OrtizOtálvaro, P. A., Bresolin, F., et al. 2010, ApJS, 189, 309 [NASA ADS] [CrossRef] [Google Scholar]
- Liang, Y. C., Yin, S. Y., Hammer, F., et al. 2006, ApJ, 652, 257 [NASA ADS] [CrossRef] [Google Scholar]
- Liseau, R., Justtanont, K., & Tielens, A. G. G. M. 2006, A&A, 446, 561 [NASA ADS] [CrossRef] [EDP Sciences] [Google Scholar]
- Luhman, M. L., Satyapal, S., Fischer, J., et al. 1998, ApJ, 504, L11 [NASA ADS] [CrossRef] [Google Scholar]
- Luhman, M. L., Satyapal, S., Fischer, J., et al. 2003, ApJ, 594, 758 [NASA ADS] [CrossRef] [Google Scholar]
- Madden, S. C. 2000, New Astron. Rev., 44, 249 [NASA ADS] [CrossRef] [Google Scholar]
- Madden, S. C., Poglitsch, A., Geis, N., Stacey, G. J., & Townes, C. H. 1997, ApJ, 483, 200 [NASA ADS] [CrossRef] [MathSciNet] [Google Scholar]
- Madden, S. C., Galliano, F., Jones, A. P., & Sauvage, M. 2006, A&A, 446, 877 [NASA ADS] [CrossRef] [EDP Sciences] [Google Scholar]
- Madden, S. C., Rémy-Ruyer, A., Galametz, M., et al. 2013, PASP, 125, 600 [NASA ADS] [CrossRef] [Google Scholar]
- Maiolino, R., Caselli, P., Nagao, T., et al. 2009, A&A, 500, L1 [NASA ADS] [CrossRef] [EDP Sciences] [Google Scholar]
- Malhotra, S., Helou, G., Stacey, G., et al. 1997, ApJ, 491, L27 [NASA ADS] [CrossRef] [Google Scholar]
- Malhotra, S., Kaufman, M. J., Hollenbach, D., et al. 2001, ApJ, 561, 766 [Google Scholar]
- Markwardt, C. B. 2009, in Astronomical Data Analysis Software and Systems XVIII, eds. D. A. Bohlender, D. Durand, & P. Dowler, ASP Conf. Ser., 411, 251 [Google Scholar]
- Meyer, D. M., Jura, M., & Cardelli, J. A. 1998, ApJ, 493, 222 [NASA ADS] [CrossRef] [Google Scholar]
- Moustakas, J., Kennicutt, Jr., R. C.,Tremonti, C. A., et al. 2010, ApJS, 190, 233 [NASA ADS] [CrossRef] [Google Scholar]
- Negishi, T., Onaka, T., Chan, K., & Roellig, T. L. 2001, A&A, 375, 566 [NASA ADS] [CrossRef] [EDP Sciences] [Google Scholar]
- Oberst, T. E., Parshley, S. C., Stacey, G. J., et al. 2006, ApJ, 652, L125 [NASA ADS] [CrossRef] [MathSciNet] [Google Scholar]
- Ott, S. 2010, in Astronomical Data Analysis Software and Systems XIX, eds. Y. Mizumoto, K.-I. Morita, & M. Ohishi, ASP Conf. Ser., 434, 139 [Google Scholar]
- Papadopoulos, P. P., Isaak, K., & van der Werf, P. 2010, ApJ, 711, 757 [NASA ADS] [CrossRef] [Google Scholar]
- Péquignot, D. 2008, A&A, 478, 371 [NASA ADS] [CrossRef] [EDP Sciences] [Google Scholar]
- Pierini, D., Leech, K. J., & Völk, H. J. 2003, A&A, 397, 871 [NASA ADS] [CrossRef] [EDP Sciences] [Google Scholar]
- Pilbratt, G. L., Riedinger, J. R., Passvogel, T., et al. 2010, A&A, 518, L1 [CrossRef] [EDP Sciences] [Google Scholar]
- Pilyugin, L. S., & Thuan, T. X. 2005, ApJ, 631, 231 [NASA ADS] [CrossRef] [MathSciNet] [Google Scholar]
- Pineda, J. L., Langer, W. D., Velusamy, T., & Goldsmith, P. F. 2013, A&A, 554, A103 [NASA ADS] [CrossRef] [EDP Sciences] [Google Scholar]
- Poglitsch, A., Krabbe, A., Madden, S. C., et al. 1995, ApJ, 454, 293 [NASA ADS] [CrossRef] [Google Scholar]
- Poglitsch, A., Waelkens, C., Geis, N., et al. 2010, A&A, 518, L2 [NASA ADS] [CrossRef] [EDP Sciences] [Google Scholar]
- Rangwala, N., Maloney, P. R., Glenn, J., et al. 2011, ApJ, 743, 94 [NASA ADS] [CrossRef] [Google Scholar]
- Rémy-Ruyer, A., Madden, S. C., Galliano, F., et al. 2013, A&A, 557, A95 [NASA ADS] [CrossRef] [EDP Sciences] [Google Scholar]
- Rémy-Ruyer, A., Madden, S. C., Galliano, F., et al. 2014, A&A, 563, A31 [NASA ADS] [CrossRef] [EDP Sciences] [Google Scholar]
- Röllig, M., Ossenkopf, V., Jeyakumar, S., Stutzki, J., & Sternberg, A. 2006, A&A, 451, 917 [NASA ADS] [CrossRef] [EDP Sciences] [Google Scholar]
- Rubin, R. H., Simpson, J. P., Lord, S. D., et al. 1994, ApJ, 420, 772 [NASA ADS] [CrossRef] [Google Scholar]
- Rubin, D., Hony, S., Madden, S. C., et al. 2009, A&A, 494, 647 [NASA ADS] [CrossRef] [EDP Sciences] [Google Scholar]
- Sandstrom, K. M., Bolatto, A. D., Bot, C., et al. 2012, ApJ, 744, 20 [NASA ADS] [CrossRef] [Google Scholar]
- Sargsyan, L., Samsonyan, A., Lebouteiller, V., et al. 2014, ApJ, 790, 15 [NASA ADS] [CrossRef] [Google Scholar]
- Savage, B. D., & Sembach, K. R. 1996, ARA&A, 34, 279 [NASA ADS] [CrossRef] [Google Scholar]
- Schlegel, D. J., Finkbeiner, D. P., & Davis, M. 1998, ApJ, 500, 525 [NASA ADS] [CrossRef] [Google Scholar]
- Stacey, G. J., Geis, N., Genzel, R., et al. 1991, ApJ, 373, 423 [NASA ADS] [CrossRef] [Google Scholar]
- Stacey, G. J., Hailey-Dunsheath, S., Ferkinhoff, C., et al. 2010, ApJ, 724, 957 [NASA ADS] [CrossRef] [Google Scholar]
- Swinbank, A. M., Karim, A., Smail, I., et al. 2012, MNRAS, 427, 1066 [NASA ADS] [CrossRef] [Google Scholar]
- Tielens, A. G. G. M., & Hollenbach, D. 1985, ApJ, 291, 722 [NASA ADS] [CrossRef] [Google Scholar]
- Verma, A., Lutz, D., Sturm, E., et al. 2003, A&A, 403, 829 [NASA ADS] [CrossRef] [EDP Sciences] [Google Scholar]
- Weingartner, J. C., & Draine, B. T. 2001, ApJ, 548, 296 [NASA ADS] [CrossRef] [Google Scholar]
- Wolfire, M. G., Tielens, A. G. G. M., & Hollenbach, D. 1990, ApJ, 358, 116 [NASA ADS] [CrossRef] [Google Scholar]
- Wolfire, M. G., Hollenbach, D., & McKee, C. F. 2010, ApJ, 716, 1191 [NASA ADS] [CrossRef] [Google Scholar]
All Tables
All Figures
|
Fig. 1 For each PACS spectral line, the number of sources observed and detected (hashed) in the Herschel Dwarf Galaxy Survey. |
| In the text | |
|
Fig. 2 PACS line fluxes versus LTIR. The DGS galaxies are represented by filled circles (compact sample) color-coded by metallicity. The red asterisks are the galaxies from Brauher et al. (2008) and the blue asterisks are the low-metallicity sources originally published by Hunter et al. (2001). The orange rectangles are the HERUS data from Farrah et al. (2013) and the red rectangles are the SHINING data from Graciá-Carpio et al. (2011). Spearman correlation coefficients applied to the DGS compact sample are indicated in the top left corner (when found above the chosen significance level and with more than 8 data points). |
| In the text | |
|
Fig. 3 PACS line fluxes, ratios, and line-to-LTIR ratios as a function of metallicity. The DGS galaxies are represented by filled circles (compact sample) and stars (extended sample), color-coded by metallicity. Spearman correlation coefficients applied to the DGS compact sample are indicated in the top left corner (when found above the chosen significance level and with more than 8 data points). The large red rectangles show the range of values covered by the Brauher et al. (2008) sample, at metallicity around solar. |
| In the text | |
|
Fig. 4 PACS line ratios against F60/F100 and LTIR/LB. The DGS galaxies are represented by filled circles (compact sample) and stars (extended sample), color-coded by metallicity. See also the caption of Fig. 2. |
| In the text | |
|
Fig. 5 PACS line-to-LTIR ratios as a function of F60/F100, LTIR, and LTIR/LB. Same legend as in the caption of Fig. 2. |
| In the text | |
|
Fig. 6 Cloudy predictions of the line intensities as a function of ionization parameter, U, and radiation field, G0. Each connected track correspond to a given density (black = 101.0 cm-3; light gray = 105.0 cm-3, in steps of 0.5 dex). The observed ratios are indicated by the yellow (dwarf galaxies) and red hashed (normal galaxies) bands. The [O i]/[C ii] and [C ii]/LTIR values corrected for non-PDR [C ii] emission. The stars/squares show the fiducial H ii region/PDR models for the dwarfs (green symbols) and the normal galaxies (red symbols). Left: results for the high-metallicity (2 ZISM) grid of models. Right: results for the low-metallicity (0.25 ZISM) grid of models. The fiducial model for normal galaxies is added to the low-metallicity panel for comparison (smaller red symbols). |
| In the text | |
|
Fig. B.1 PACS spectroscopy data of all galaxies of the Dwarf Galaxy Survey. For each galaxy, flux maps are shown on the left and line profiles over the brightest position, indicated by a cross on the map, are shown on the right. White circles represent the PACS beam sizes (FWHM of ~9′′ at 60 μm and 12′′ at 160 μm). The spectral resolution is 90 km s-1 at 60 μm and 240 km s-1 at 160 μm. |
| In the text | |
|
Fig. B.1 continued. |
| In the text | |
|
Fig. B.1 continued. |
| In the text | |
|
Fig. B.1 continued. |
| In the text | |
|
Fig. B.1 continued. |
| In the text | |
|
Fig. B.1 continued. |
| In the text | |
|
Fig. B.1 continued. |
| In the text | |
|
Fig. B.1 continued. |
| In the text | |
|
Fig. B.1 continued. |
| In the text | |
|
Fig. B.1 continued. |
| In the text | |
|
Fig. B.1 continued. |
| In the text | |
|
Fig. B.1 continued. |
| In the text | |
|
Fig. B.1 continued. |
| In the text | |
|
Fig. B.1 continued. |
| In the text | |
|
Fig. B.1 continued. |
| In the text | |
|
Fig. B.1 continued. |
| In the text | |
|
Fig. B.1 continued. |
| In the text | |
|
Fig. B.1 continued. |
| In the text | |
|
Fig. B.1 continued. |
| In the text | |
|
Fig. B.1 continued. |
| In the text | |
|
Fig. B.1 continued. |
| In the text | |
|
Fig. B.1 continued. |
| In the text | |
|
Fig. B.1 continued. |
| In the text | |
|
Fig. B.1 continued. |
| In the text | |
Current usage metrics show cumulative count of Article Views (full-text article views including HTML views, PDF and ePub downloads, according to the available data) and Abstracts Views on Vision4Press platform.
Data correspond to usage on the plateform after 2015. The current usage metrics is available 48-96 hours after online publication and is updated daily on week days.
Initial download of the metrics may take a while.