| Issue |
A&A
Volume 578, June 2015
|
|
|---|---|---|
| Article Number | A53 | |
| Number of page(s) | 53 | |
| Section | Extragalactic astronomy | |
| DOI | https://doi.org/10.1051/0004-6361/201425207 | |
| Published online | 03 June 2015 | |
Online material
Line fluxes of the DGS galaxies.
Appendix A: Details of the PACS observing strategy
Technical details about the DGS observations.
Appendix B: Spectral maps and line profiles of the Herschel Dwarf Galaxy Survey
Atlas of the PACS spectroscopy data. For each spectral line, the flux map and spectrum of the brightest spatial pixel, which position is indicated by a black cross on the map, are shown. White circles represent the PACS beam sizes. We note that the maps are not PSF-deconvolved.
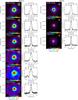 |
Fig. B.1
PACS spectroscopy data of all galaxies of the Dwarf Galaxy Survey. For each galaxy, flux maps are shown on the left and line profiles over the brightest position, indicated by a cross on the map, are shown on the right. White circles represent the PACS beam sizes (FWHM of ~9′′ at 60 μm and 12′′ at 160 μm). The spectral resolution is 90 km s-1 at 60 μm and 240 km s-1 at 160 μm. |
| Open with DEXTER | |
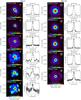 |
Fig. B.1
continued. |
| Open with DEXTER | |
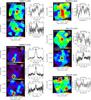 |
Fig. B.1
continued. |
| Open with DEXTER | |
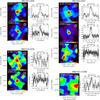 |
Fig. B.1
continued. |
| Open with DEXTER | |
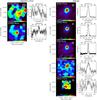 |
Fig. B.1
continued. |
| Open with DEXTER | |
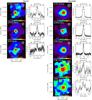 |
Fig. B.1
continued. |
| Open with DEXTER | |
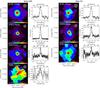 |
Fig. B.1
continued. |
| Open with DEXTER | |
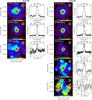 |
Fig. B.1
continued. |
| Open with DEXTER | |
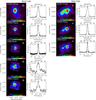 |
Fig. B.1
continued. |
| Open with DEXTER | |
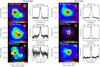 |
Fig. B.1
continued. |
| Open with DEXTER | |
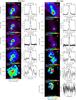 |
Fig. B.1
continued. |
| Open with DEXTER | |
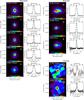 |
Fig. B.1
continued. |
| Open with DEXTER | |
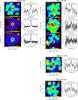 |
Fig. B.1
continued. |
| Open with DEXTER | |
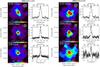 |
Fig. B.1
continued. |
| Open with DEXTER | |
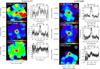 |
Fig. B.1
continued. |
| Open with DEXTER | |
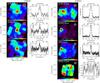 |
Fig. B.1
continued. |
| Open with DEXTER | |
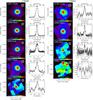 |
Fig. B.1
continued. |
| Open with DEXTER | |
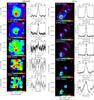 |
Fig. B.1
continued. |
| Open with DEXTER | |
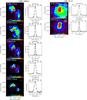 |
Fig. B.1
continued. |
| Open with DEXTER | |
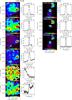 |
Fig. B.1
continued. |
| Open with DEXTER | |
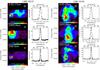 |
Fig. B.1
continued. |
| Open with DEXTER | |
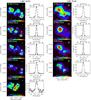 |
Fig. B.1
continued. |
| Open with DEXTER | |
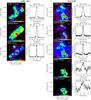 |
Fig. B.1
continued. |
| Open with DEXTER | |
|
Fig. B.1
continued. |
|
| Open with DEXTER | |
Appendix C: Spitzer IRS fluxes of the compact DGS galaxies
We have extracted IRS data of the compact DGS galaxies, as described in Sect. 2.2.1. Fluxes of the main MIR fine-structure cooling lines are listed here (Table C.1 for the low-resolution data and Table C.2 for the high-resolution data).
The spectra of the short and long wavelength modules of the IRS were calibrated using a correction based on the spatial extent of the source. The correction, which is wavelength-dependent, assumes a spherical symmetry for the source shape to account for the light that falls outside the slit. Using this correction, there is no significant flux offsets between the spectra of the short and long wavelength modules for the low-resolution data. For the high-resolution data, extended sources are extracted in different apertures which lead to offsets between the spectra of the short and long wavelength modules. In those cases, the short wavelength spectra are stitched to the long wavelength spectra.
We have compared the overall continuum level of the IRS data to the IRAC and MIPS photometry to verify if all emission is recovered by our reduction (i.e. total flux for the galaxy). This is generally the case, except for NGC 1569 which is clearly more extended than the IRS slit. For reference, we indicate in Table C.1 the ratio of the observed-to-synthetic MIPS 24 μm flux, denoted RMIPS24. The observed photometry is from Bendo et al. (2012b) and the synthetic photometry is measured from the IRS data using the MIPS filter profile. This scaling factor should be applied to obtain total IRS fluxes. We opt for the 24 μm emission because it arises from active star-forming regions and it is less affected by IRS module stitching than the shorter wavelengths. We note that observed-to-synthetic IRAC 8 μm fluxes are further offset by a factor ~1.8 in 3 galaxies with strong PAH emission (He 2-10, Mrk 1089, NGC 1140). This could be due to PAH (and PDR line) emission outside of the IRS slit as those galaxies show extended structures or to calibration uncertainties.
In Table C.2, we also indicate the average ratio between the high-resolution and low-resolution fluxes of the main spectral lines, denoted HR/LR. Line fluxes generally agree within 20% around that ratio. Differences are mainly due to the extraction method and source extent. [Ne ii] and the PAH feature at 12.7 μm, as well as [O iv] and [Fe ii] at 25.9 μm, are resolved and thus more accurately measured with the high-resolution mode.
Low-resolution MIR line fluxes in the compact galaxies of the DGS.
High-resolution MIR line fluxes in the compact galaxies of the DGS.
Appendix D: IRAS and PACS photometry of the compact sample
LTIR, IRAS 60/100, and PACS 70/100 band ratios.
Appendix E: Line broadening and rotation in the PACS maps
We find that the [O iii]88 and [O i]63 lines, which are bright with smallest instrumental FWHM, are the most often broadened. The line widths are typically ~100 km s-1 larger than the instrumental profile in the brightest sources. For the fainter lines, it is more difficult to determine confidently whether or not broadening is present. Broadening of the [C ii]157 line can only be accurately calculated for intrinsic line widths larger than 150 km s-1 because of its large instrumental FWHM of 240 km s-1. When observed, [N iii]57 is similarly broadened as are [O iii]88 and [O i]63. Such broadening indicates the possible presence of strong turbulent motions, or that multiple components contribute to the emission of those lines. The fact that we find similar intrinsic line widths for all tracers, despite their different origins, indicates that either they are spatially mixed within our beam (which is certainly the case for our compact sources), or that they are affected similarly by the source of this broadening (internal kinematics). Several galaxies also display clear signs of rotation in all observed spectral lines.
Broadening of the FIR lines (in km s-1).
© ESO, 2015
Current usage metrics show cumulative count of Article Views (full-text article views including HTML views, PDF and ePub downloads, according to the available data) and Abstracts Views on Vision4Press platform.
Data correspond to usage on the plateform after 2015. The current usage metrics is available 48-96 hours after online publication and is updated daily on week days.
Initial download of the metrics may take a while.