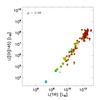
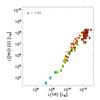
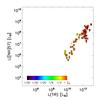
Fig. 2
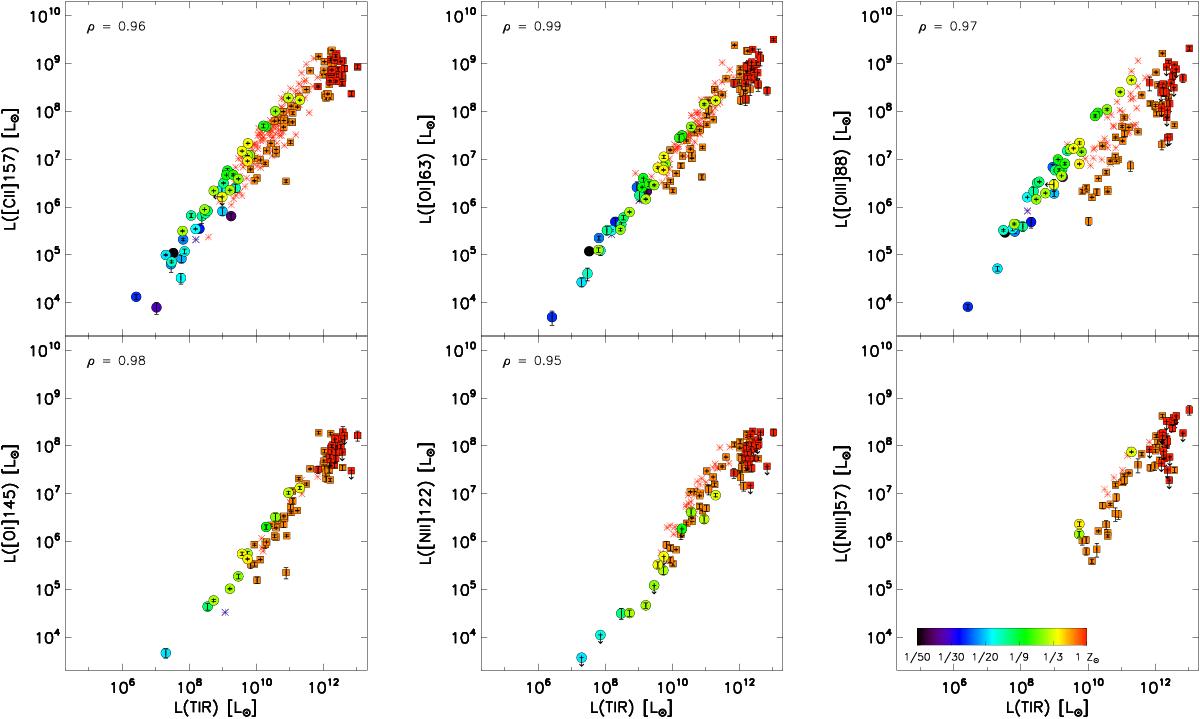
PACS line fluxes versus LTIR. The DGS galaxies are represented by filled circles (compact sample) color-coded by metallicity. The red asterisks are the galaxies from Brauher et al. (2008) and the blue asterisks are the low-metallicity sources originally published by Hunter et al. (2001). The orange rectangles are the HERUS data from Farrah et al. (2013) and the red rectangles are the SHINING data from Graciá-Carpio et al. (2011). Spearman correlation coefficients applied to the DGS compact sample are indicated in the top left corner (when found above the chosen significance level and with more than 8 data points).
Current usage metrics show cumulative count of Article Views (full-text article views including HTML views, PDF and ePub downloads, according to the available data) and Abstracts Views on Vision4Press platform.
Data correspond to usage on the plateform after 2015. The current usage metrics is available 48-96 hours after online publication and is updated daily on week days.
Initial download of the metrics may take a while.