Fig. 6
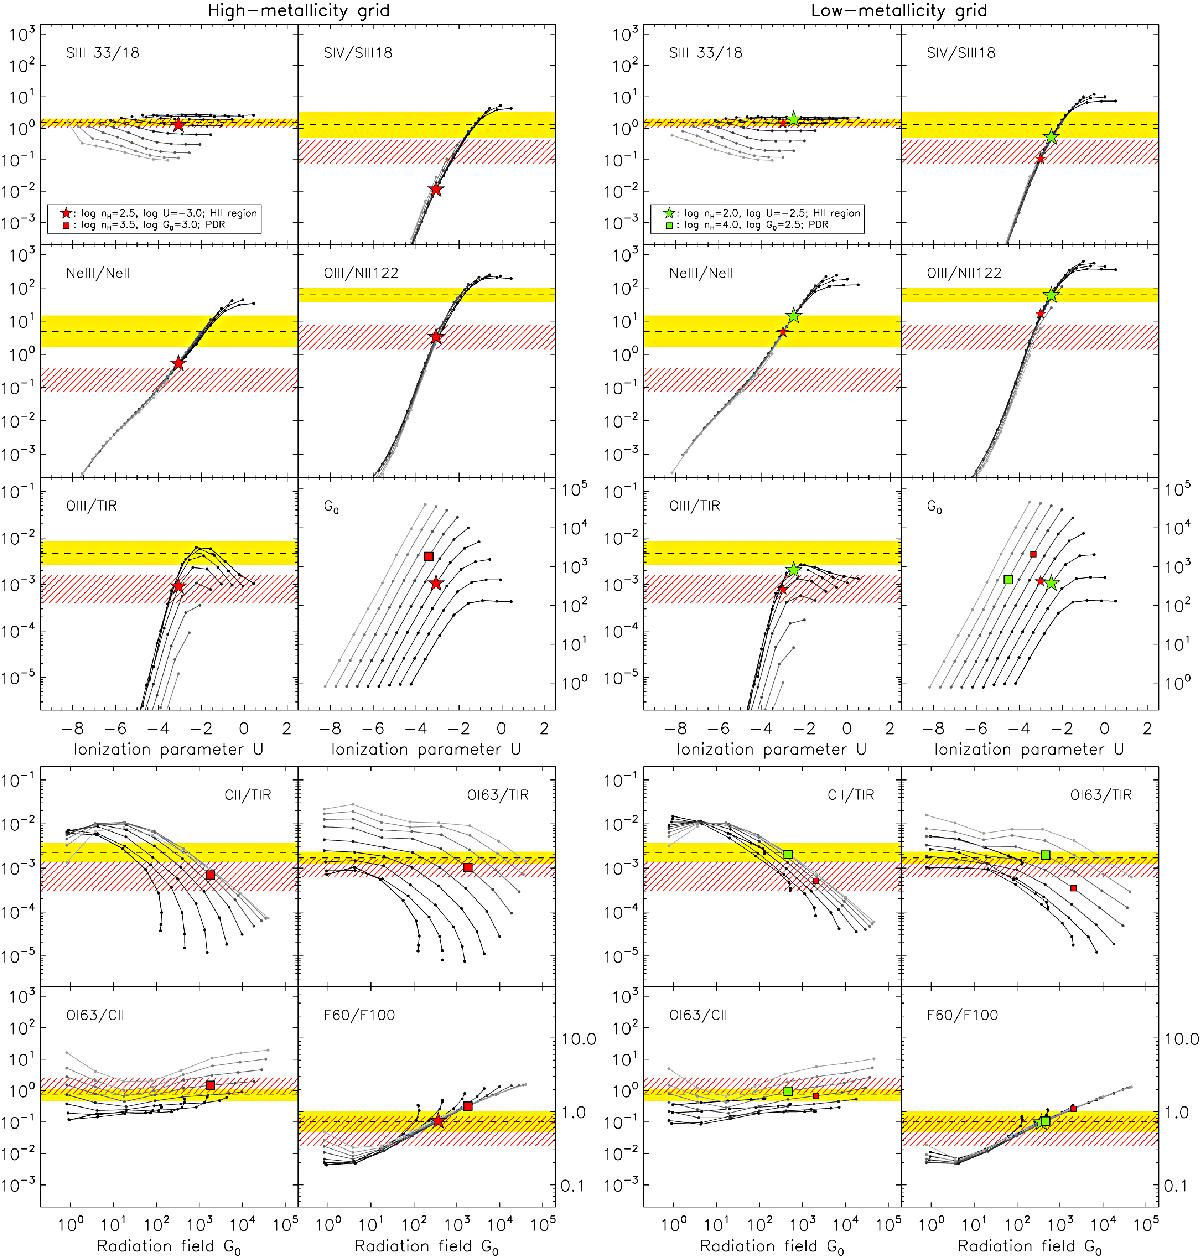
Cloudy predictions of the line intensities as a function of ionization parameter, U, and radiation field, G0. Each connected track correspond to a given density (black = 101.0 cm-3; light gray = 105.0 cm-3, in steps of 0.5 dex). The observed ratios are indicated by the yellow (dwarf galaxies) and red hashed (normal galaxies) bands. The [O i]/[C ii] and [C ii]/LTIR values corrected for non-PDR [C ii] emission. The stars/squares show the fiducial H ii region/PDR models for the dwarfs (green symbols) and the normal galaxies (red symbols). Left: results for the high-metallicity (2 ZISM) grid of models. Right: results for the low-metallicity (0.25 ZISM) grid of models. The fiducial model for normal galaxies is added to the low-metallicity panel for comparison (smaller red symbols).
Current usage metrics show cumulative count of Article Views (full-text article views including HTML views, PDF and ePub downloads, according to the available data) and Abstracts Views on Vision4Press platform.
Data correspond to usage on the plateform after 2015. The current usage metrics is available 48-96 hours after online publication and is updated daily on week days.
Initial download of the metrics may take a while.