| Issue |
A&A
Volume 575, March 2015
|
|
|---|---|---|
| Article Number | A119 | |
| Number of page(s) | 19 | |
| Section | Planets and planetary systems | |
| DOI | https://doi.org/10.1051/0004-6361/201424253 | |
| Published online | 06 March 2015 | |
The HARPS search for southern extra-solar planets
XXXVI. Planetary systems and stellar activity of the M dwarfs GJ 3293, GJ 3341, and GJ 3543⋆,⋆⋆
1 Université Grenoble Alpes, IPAG, 38000 Grenoble, France
e-mail: nicola.astudillo@obs.ujf-grenoble.fr
2 CNRS, IPAG, 38000 Grenoble, France
3 Observatoire de Genève, Université de Genève, 51 ch. des Maillettes, 1290 Sauverny, Switzerland
4 Laboratoire d’Astrophysique de Marseille, UMR 6110 CNRS, Université de Provence, 38 rue Frédéric Joliot-Curie, 13388 Marseille Cedex 13, France
5 Institut d’Astrophysique et de Géophysique, Université de Liège, Allée du 6 Août 17, Bat. B5C, 4000 Liège, Belgium
6 Departamento de Física, Universidade Federal do Rio Grande do Norte, 59072-970 Natal, RN, Brazil
7 Cavendish Laboratory, J J Thomson Avenue, Cambridge, CB3 0HE, UK
8 Departamento de Astronomía, Universidad de Chile, Camino El Observatorio 1515, Las Condes, Santiago, Chile
9 Centro de Astrofísica, Universidade do Porto, Rua das Estrelas, 4150-762 Porto, Portugal
10 Departamento de Física e Astronomia, Faculdade de Ciências, Universidade do Porto, Portugal
Received: 22 May 2014
Accepted: 25 November 2014
Context. Planetary companions of a fixed mass induce reflex motions with a larger amplitude around lower-mass stars, which adds to making M dwarfs excellent targets for extra-solar planet searches. The most recent velocimeters with a stability of ~1 m s-1 can detect very low-mass planets out to the habitable zone of these stars. Low-mass small planets are abundant around M dwarfs, and most of the known potentially habitable planets orbit one of these cool stars.
Aims. Our M-dwarf radial velocity monitoring with HARPS on the ESO 3.6 m telescope at La Silla observatory makes a major contribution to this sample.
Methods. We present here dense radial velocity (RV) time series for three M dwarfs observed over ~five years: GJ 3293 (0.42 M⊙), GJ 3341 (0.47 M⊙), and GJ 3543 (0.45 M⊙). We extracted these RVs through minimum χ2-matching of each spectrum against a stack of all observed spectra for the same star that has a high signal-to-noise ratio. We then compared potential orbital signals against several stellar activity indicators to distinguish the Keplerian variations induced by planets from the spurious signals that result from rotational modulation of stellar surface inhomogeneities and from activity cycles.
Results. Two Neptune-mass planets – msin(i) = 1.4 ± 0.1 and 1.3 ± 0.1Mnept – orbit GJ 3293 with periods P = 30.60 ± 0.02 d and P = 123.98 ± 0.38 d, possibly together with a super-Earth – msin(i) ~ 7.9 ± 1.4 M⊕ – with period P = 48.14 ± 0.12d. A super-Earth – msin(i) ~ 6.1 M⊕ – orbits GJ 3341 with P = 14.207 ± 0.007d. The RV variations of GJ 3543, on the other hand, reflect its stellar activity rather than planetary signals.
Key words: techniques: radial velocities / stars: late-type / stars: individual: GJ 3293 / stars: individual: GJ 3341 / stars: individual: GJ 3543 / planetary systems
Based on observations made with the HARPS instrument on the ESO 3.6 m telescope under the program IDs 072.C-0488, 082.C-0718 and 183.C-0437 at Cerro La Silla (Chile).
Tables A.1–A.3 (radial velocity data) are available in electronic form at http://www.aanda.org and at the CDS via anonymous ftp to cdsarc.u-strasbg.fr (130.79.128.5) or via http://cdsarc.u-strasbg.fr/viz-bin/qcat?J/A+A/575/A119
© ESO, 2015
1. Introduction
A planet of a given mass induces a stronger reflex motion on a less massive host star. Around the low-mass M dwarfs, present-day observing facilities can consequently detect planets that are only a few times more massive than Earth (Fressin et al. 2013; Mayor et al. 2009). These very low-mass stars dominate Galactic populations by approximately 3 to 1 (e.g., van Dokkum & Conroy 2010), and most of them host planets: Bonfils et al. (2013a) estimated that  planets orbit each early- to mid-M dwarf with a period shorter than 100 days, while Dressing & Charbonneau (2013) found that each star with effective temperatures below 4000 K is orbited by
  planets with radii between 0.5 and 4 R⊕ and an orbital period shorter than 50 days. Their high Galactic abundance combined with their abundant planets make M dwarfs excellent targets for planet searches. These stars consequently are the focus of several ongoing surveys – with both radial velocity (RV; e.g., HARPS; Bonfils et al. 2013a) and transit techniques (e.g. MEarth; Nutzman & Charbonneau 2008). Several instruments are being developed to specifically target these stars, such as SPIRou (Delfosse et al. 2013b), CARMENES (Quirrenbach et al. 2012), NGTS (Wheatley et al. 2013), and Exoplanets in Transit and their Atmosphere (ExTrA; Bonfils et al., in prep.), mostly in the near-infrared spectral range where M dwarfs are brighter and where a given photon noise can thus be achieved within a much shorter integration time.
Much interest is currently focused on discovering broadly Earth-like planets that orbit within the habitable zone (HZ) of their host star. The HZ zone, by definition, is the range of host star distances for which the incident stellar flux allows water on a planetary surface to remain in the liquid phase, and after accounting for greenhouse effects, it corresponds to a surface equilibrium temperature of between 175 K and 270 K (Selsis et al. 2007). That zone is much closer in for a low-luminosity M dwarf than for a brighter solar-type star: the orbital period for a HZ planet ranges from a week to a few months across the M dwarf spectral class, compared to one year for the Sun-Earth system. This relaxes the ~ 10cm s-1 precision required to detect an Earth-equivalent orbiting a Sun-equivalent to ~1m s-1 for the same planet orbiting in the habitable zone of an M dwarf. Characterizing that planet during transit, if any occurs, is furthermore facilitated considerably by the much higher planet-to-stellar surface ratio. The equilibrium surface temperature of a planet secondarily depends on the nature of its atmosphere, making planetary mass an important parameter as well. Bodies with M< 0.5 M⊕ are expected to retain atmospheres that are too shallow for any water to be liquid, while planets with M> 10 M⊕ are expected to accrete a very thick atmosphere mainly dominated by hydrogen and helium (Selsis et al. 2007). These considerations together make GJ 667Cc (Delfosse et al. 2013a; Bonfils et al. 2013a), GJ 163 (Bonfils et al. 2013b), and Kepler-186f (Quintana et al. 2014) some of the best current candidates for potentially habitable planets.
Stellar activity affects habitability (e.g., Vidotto et al. 2013), but more immediately, it can induce false-positives in planet detection. M dwarfs remain active for longer than more massive stars because they do not dissipate their angular momentum as fast as their more massive brethren, and stellar activity correlates strongly with rotation period (Noyes et al. 1984). Additionally, lower mass stars are more active for a fixed rotation period (Kiraga & Stepien 2007). Activity, in turn, affects measured stellar velocities through a number of mechanisms: stellar spots deform spectral lines according to their position on the stellar surface, the up-flowing and down-flowing regions of convective cells introduce blue- and red-shifted components to the line shapes, and stellar oscillations also introduce a RV jitter. Stellar activity diagnostics are therefore essential to filter out spurious radial velocity signals that can otherwise be confused with planets (Bonfils et al. 2007).
Cross-correlation with either an analog or a numerical mask is widely used to extract radial velocities from spectra (Baranne et al. 1996). This technique concentrates the information of all the lines in the mask into an average line with a very high signal-to-noise ratio (S/N). It therefore enables characterizing the line profile in great detail. In addition to the usually minor effect of telluric absorption lines, any variation of the full-width at half-maximum (FWHM), contrast, or bisector-span of the cross-correlation functions that correlate with the radial velocity variations denotes that they originate in stellar phenomena such as spots, visible granulation density, or oscillations (Queloz et al. 2001; Boisse et al. 2011; Dumusque et al. 2011). Plages or filaments on the stellar surface can additionally be detected through emission in the Ca II H&K, and Hα lines, for example (Gomes da Silva et al. 2011).
Here we present analyses of GJ 3293 and GJ 3341 for which our HARPS measurements indicate the presence of planets, and for GJ 3543, for which we conclude that stellar activity more likely explains the RV variations. Section 2 briefly describes the observations and reduction process, Sect. 3 discusses the properties of each star in some detail, while Sects. 4–6 describe the RVs analysis and orbital solutions and examine stellar activity. Finally, we conclude in Sect. 7.
2. Spectra and Doppler analysis from HARPS
The High Accuracy Radial velocity Planets Searcher (HARPS) is a fiber-fed, cross-dispersed echelle spectrograph installed on the 3.6 m telescope at La Silla observatory in Chile. The instrument diffracts the light over two CCDs, where 72 orders cover the 380 to 630 nm spectral range with a resolving power of 115 000 (Mayor et al. 2003). HARPS stands out by its long-term stability, ensured by a vacuum enclosure and a temperature-stabilized environment. To achieve sub-m/s precision, the spectrograph produces spectra for light injected through two fibers. One receives light from the target star, the other can be simultaneously (or not) illuminated with a calibration reference to correct instrumental drifts during the observations.
The HARPS pipeline (Lovis & Pepe 2007) automatically reduces the data using nightly calibrations and measures the radial velocity by cross-correlation with a binary mask (Pepe et al. 2002) that depends on the spectral type. The numerical mask for M dwarfs consists of almost 10 000 holes, placed on spectral lines selected for their large amount of Doppler information. The whole procedure is complete shortly after the end of each exposure.
The visual band spectra of the coolest stars contain very many overlapping molecular features with essentially no continua. Under these circumstances, a binary mask makes suboptimal use of the available Doppler information. In this study, we therefore recomputed RVs from the order-by-order spectra extracted by the HARPS pipeline. For each target, we used the RVs measured by the HARPS pipeline for the individual spectra together with the corresponding barycentric correction to align all spectra to the frame of the solar system barycenter. This aligns the stellar lines, while the telluric features are shifted by minus the barycentric velocity of each epoch. We then computed the median of these spectra to produce a high S/N template spectrum for each target. At that stage, we produced a template of the telluric absorption spectrum by computing the median of the residuals (aligned in the laboratory reference frame) of subtracting the high S/N template from the individual spectra. We then used this telluric spectrum to produce an improved stellar template by constructing it again without the now known telluric lines. This process can be iterated in principle, but we found that it effectively converges after the first iteration. Finally, we measured new radial velocities by minimizing the χ2 of the residuals between the observed spectra and shifted versions of the stellar template, with all spectral elements contaminated by telluric lines masked out (e.g., Howarth et al. 1997; Zucker & Mazeh 2006, Astudillo-Defru et al., in prep.). Astudillo-Defru et al. (in prep.) will provide a detailed description of the algorithm implementation and will characterize its performance.
Our observation strategy is described in detail in Bonfils et al. (2013a) and is only summarized for convenience here. We chose to observe without illuminating the reference fiber because we only targeted a ~1m s-1 precision; this choice provides clean observations of the Ca II H&K lines for later stellar activity analysis, which is particularly important for M dwarfs. We hence made use of wavelength calibrations acquired before the beginning of the night. The exposure time was 900 s for all frames. This is adequate for a 0.80m s-1 precision for visual magnitudes between 7 and 10, but the velocities of the fainter stars we discuss here have significantly higher photon noise errors.
Stellar properties of the three targets.
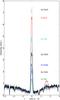 |
Fig. 1 Median spectra centered on the Ca II H line for reference stars, sorted by increasing rotation period: Gl 674 (red line, M3, Prot = 35 d), Gl 176 (cyan line, M2.5, Prot = 39 d), Gl 618A (blue line, M3, Prot = 57 d), and Gl 581 (green line, M2.5, Prot = 130 d). Median spectra for the targets of this paper, with no a priori known rotation period: GJ 3543 (black dotted line, M1.5), GJ 3293 (black full line, M2.5), and GJ 3341 (black dashed line, M2.5). |
3. Stellar properties of GJ 3293, GJ 3341, and GJ 3543
GJ 3293 (LHS 1672), GJ 3341 (LHS 1748), and GJ 3543 (L 749-34) are high proper motion early-M dwarfs (M2.5, M2.5, and M1.5, respectively). We used the BCK bolometric correction of Leggett et al. (2001) and the photometric distance of Gliese & Jahreiß (1991) to compute their luminosity. We also estimated the effective temperature (Teff), stellar radius, and luminosity from the V − K color and metallicity relationship of Boyajian et al. (2012); the two luminosities agree well for the three targets. We derived the stellar metallicities – and Teff, for comparison – from our spectra using the methods of Neves et al. (2014); the two determinations of Teff agree to better than their error bars for all three stars, and we only quote the Boyajian et al. (2012) value. The masses were computed using the Delfosse et al. (2000)K-band mass versus absolute magnitude relation. We calculated the UVW space motions with the Johnson & Soderblom (1987) orientation convention, and assigned kinematic populations following Leggett (1992). We used the proper motion and distance to compute the secular radial acceleration dv/dt (Kürster et al. 2003), from which we corrected the radial velocities. Following Selsis et al. (2007), we adopted recent Venus and early Mars criteria for the inner (HZIn) and outer (HZOut) edges of the habitable zone. Table 1 summarizes the properties of the three targets.
GJ 3293 is located in the Eridanus constellation and is 18.2 ± 2.6 pc (Gliese & Jahreiß 1991) away from the Sun. Its Galactic velocity parameters, U = −27.3 ± 17.1 km s-1, V = −25.9 ± 6.6 km s-1, and W = −22.2 ± 23.1 km s-1, leave its kinematic population uncertain in part because of the large uncertainty on its photometric distance; GJ 3293 could belong either to the young or the young-old disk population. Its metallicity ([Fe/H] = 0.02) is close to solar and suggests that it is part of the young disk, but is consistent with either option.
GJ 3341 is located in the Columba constellation at a distance of 23.2 ± 0.7 pc (Riedel et al. 2010). Its proper motion, distance, and systemic velocity (γ = 47.803 ± 0.003) result in U = 52.5 ± 0.6 km s-1, V = −52.0 ± 0.8 km s-1, and W = 24.4 ± 3.2 km s-1. This formally makes GJ 3341 a young-old disk member.
GJ 3543 is located in the Hydra constellation and at 12.5 ± 2.0 pc from the Sun (Gliese & Jahreiß 1991). Its space motion components U = 23.8 ± 11.3 km s-1, V = −9.0 ± 2.0 km s-1, and W = −2.7 ± 1.7 km s-1 place GJ 3543 in the young-disk box, while its metallicity ([Fe/H] = − 0.13) is somewhat low for the Galactic young disk.
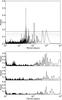 |
Fig. 2 Top panel: periodogram of the GJ 3293 RVs. The solid line, dashed line, and dashed dotted line represent the 0.3%, 4.6%, and 31.7% FAP levels, corresponding to 3σ, 2σ, and 1σ confidence, respectively. Bottom panel: periodograms for epochs 2008−2009 (34 measurements, first row), 2010−2011 (52 measurements, second row), and 2012−2013 (59 measurements, third row); the stability of the 30 d signal (dash-dotted vertical) is clear. |
4. Radial velocities of GJ 3293
The 145 RV measurements of GJ 3293 span 1514 d. Their σe = 7.69 m s-1 dispersion is much higher than the average Doppler uncertainty ⟨ σi ⟩ = 1.76 m s-1, which represents the weighted arithmetic mean of the estimated photon noise (Bouchy et al. 2001) and instrumental errors. Both an F-test with  and a χ2 test for a constant model given ⟨ σi ⟩ returned negligible probabilities (<10-9) that the photon noise combined with wavelength calibration and guiding uncertainties explains the measured dispersion.
We thus searched for periodicity with floating-mean periodograms, with a periodogram-normalization choice where 1 stands for a perfect fit of a sine wave to the data, and 0 points to no improvement over a constant model (Zechmeister & Kürster 2009). In addition to the commonly used 1% false-alarm probability (FAP) confidence level, we plot values covering 68.3%, 95.4%, and 99.7% of the periodogram power distributions, equivalent to 1σ (31.7% FAP), 2σ (4.6% FAP), and 3σ confidences (0.3% FAP).
Figure 2 shows the periodogram of the GJ 3293 time series and reveals a clear power excess around P = 30.6 d, with pmax = 0.51. Additional peaks above the 0.3% FAP (p = 0.17) appear at 121.6, 33.3, 48.2, 27.1, 919.5, and 500.9 d, with powers of 0.30, 0.22, 0.21, 0.20, 0.19, and 0.19, respectively. To further evaluate the confidence on the P = 30.6d signal given our measurement errors and sampling, we generated 1000 synthetic datasets by rearranging the radial velocities and holding the dates fixed. None of the periodograms generated for these bootstrapped datasets had maximum power above 0.3. The FAP on the 30.6 d signal, with 0.51 power, is therefore well below 1/1000. The prescription of Horne & Baliunas (1986) for the periodogram interpretation gives FAP(30.6 d) = 2.8 × 10⁻¹⁹, and the 30.6 d peak is well above any of the considered confidence levels.
We used yorbit (Ségransan et al., in prep.) to adjust Keplerian orbits with an MCMC algorithm. Without any prior on the orbit, this converged on a solution with period P = 30.565 ± 0.024 d, eccentricity e = 0.158 ± 0.082, and semi-amplitude K1 = 8.87 ± 0.83 m s-1. This solution reduces the rms dispersion of the residuals to σe = 5.34 m s-1 and the reduced χ2 to  . Given an M = 0.42 M⊙ stellar mass (with 10% uncertainty), the minimum mass for the planet is msin(i) = 1.4 ± 0.1Mnept. Table 2 summarizes the orbital and derived parameters. The ratio of the eccentricity (e) to its uncertainty (σe) is e/σe< 2.49, and therefore is below the usual thresholds for significant eccentricity1 (Lucy 2013). We adopted the eccentricity that yorbit converged on when analyzing the residuals for additional signals, but its low value makes that choice unimportant.
One-Keplerian fit for GJ 3293.
Many of the peaks in the top panel of Fig. 2 have no counterpart in the periodogram of the subtraction residuals of the 30.6 d signal (Fig. 3) and therefore represent no more than aliases of that signal. A peak around 123.4 d dominates this periodogram of the residuals, with pmax = 0.64. A bootstrap test with one thousand (1000) iterations produced no signal above 0.3, and the FAP of the dominant peak is therefore well under 10-3. The prescription of Horne & Baliunas (1986) evaluates the FAP to 3.3 × 10⁻²⁹ for the 123.4 d peak. Other peaks above a 0.3% FAP (p = 0.17) occur at periods 92.1, 48.2, 218.8, 186.5, 517.2, 55.0, and 41.2 d, and with powers of 0.39, 0.33, 0.27, 0.24, 0.24, 0.22, and 0.19. None of them is sufficiently strong that confusing the 123.4 d signal for one of its aliases would be a problem. We used yorbit to model the RVs with two Keplerian signals, again with no prior on the orbital parameters. The parameters of the first Keplerian are essentially unchanged from the one-Keplerian fit, and the second has a period P = 123.76 ± 0.30 d, eccentricity e = 0.331 ± 0.057, and semi-amplitude K1 = 6.430 ± 0.423 m s-1, which correspond to a minimum planetary mass of m sin(i) = 1.5 ± 0.1Mnept. Table 3 summarizes the parameters of the two Keplerians. The dispersion and the reduced χ2 decrease to σe = 2.86 m s-1 and  . An F-test of this new
  against the average internal errors ⟨ σi ⟩ 2 and a χ2 against a constant model return P(F) = 5.7 × 10⁻⁹ and P(χ2) < 10-9, which means that significant dispersion remains above the internal errors.
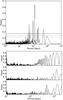 |
Fig. 3 Top panel: periodogram of the residuals from subtracting the first Keplerian (P = 30.6 d). The horizontal lines have the same meaning as in Fig. 2. Bottom panel: we split for subsets of the observational epochs, defined in the caption of Fig. 2, and performed their peridogram; in spite of the poor sampling of some of the subsets for a 123 d period, all show a peak around this period. |
Fit for two-Keplerian orbits for GJ 3293.
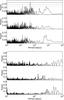 |
Fig. 4 Top panel. First row: periodogram of the subtraction residuals of two Keplerians with periods of 30.6 and 123.6 d, dominated by a 48 d peak. The horizontal lines represent FAP levels, as described in the captions of Fig. 2. Second row: periodogram of the residuals after subtracting three Keplerians with periods of 30.6, 123.6, and 439 d. The vertical dash-dotted line marks a P = 48 d period. Third row: periodogram of the residuals after subtracting Keplerians with periods of 30.6, 123.6, and 48 d. Bottom panel: periodogram of the residuals after subtracting the 30.6 and 123.6 d signals for each subset of epochs described in the captions of Fig. 2. The 48 d signal is not seen for the 2010−2011 observational epochs, which have a poor sensitivity to that period range because their sampling incidentally concentrates around just two phases. |
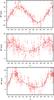 |
Fig. 5 Radial velocities phased for each signal. P = 30.59 d top panel, P = 48.07 d middle panel, and P = 123.79 d bottom panel. |
A single peak dominates the periodogram of the subtraction residuals of the two Keplerians (Fig. 4), implying that the other strong peaks in Figs. 2 and 3 are aliases of the 30.6 and 123.8 d signals. This peak at 48 d has power pmax = 0.18, which corresponds to a 0.15% FAP (p = 0.15 corresponds to a 1% FAP and p = 0.17 to a 3σ confidence level). An unconstrained search for a three-Keplerian solution with yorbit converged on the two Keplerians described above plus a highly eccentric (e = 0.925 ± 0.022) Keplerian with a period of 439 d. The third orbit crosses the other two, making the solution almost certainly unstable on very short time scales, and therefore unphysical. Spurious highly eccentric orbits are favored when noise becomes significant and/or sampling is poor, with the highest velocity excursions typically found at the most poorly sampled phases of the orbit. The periodogram of the residuals of that unphysical solution still has a 48 d peak, but with much reduced power (p = 0.10, 0.63 FAP, middle panel of Fig. 4). This indicates that our sampling couples signals at periods of 48 and 439 d, but incompletely. We therefore constrained the period of the third Keplerian to the [2, 100] d range to avoid convergence on the spurious longer period eccentric solution. This converged on a Keplerian with P = 48.072 ± 0.120 d, e = 0.190 ± 0.134, and K1 = 2.515 ± 0.393 m s-1, which corresponds to a minimum mass of msin(i) = 7.9 ± 1.4 M⊕, plus the two Keplerians with periods of 30.6 and 123.4 d. Following Lucy (2013), eb/μ< 2.49 and the eccentricity therefore remains below the detection threshold. Figure 5 shows the Keplerian solution. The dispersion is σe = 2.45 m s-1 and the reduced χ2 is  . An F-test of this against ⟨ σi ⟩ 2 yields a P(F) = 4.3 × 10⁻⁵ probability that this would occur by chance. The RVs therefore vary by significantly more than expected from their known measurement errors. Possible explanations include additional companions, stellar activity, or a non-Gaussian or underestimated noise. The periodogram of the residuals of the three-Keplerian solution (bottom panel of Fig. 4 has no peak above a 12% FAP (11.8% at 13.3 d and 11.7% at 669.6 d). Our final solution (Table 4) additionally includes a quadratic drift, which improves the residuals by a formally significant amount and suggests a possible component at a wider separation.
Fit for three-Keplerian orbits plus a quadratic drift for GJ 3293.
4.1. Stellar activity
We computed periodograms for the FWHM, bisector span, and contrast of the cross-correlation function (CCF), as well as for the S and Hα indices, to investigate whether some of the periodicities can be attributed to stellar activity. We also searched for correlations between these activity indicators and the radial velocities and their residuals after subtracting subsets of the Keplerian orbits.
The periodograms of the bisector span, FWHM, contrast, and S-index show no dominant peaks, while that for Hα shows one peak at over 3σ confidence at 41 d (Fig. 6 top); since the strength of the Ca II emission in GJ 3293 is intermediate between those for Gl 176 (P = 39d) and Gl 618A (P = 57d) – Fig. 1, this peak may reflect the stellar rotation period. We see no correlation between any of the activity indicators and either the radial velocities or the residuals from subtracting the Keplerian orbits (Fig. 6, bottom, for Hα).
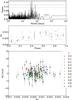 |
Fig. 6 Top: periodogram of the Hα emission index of GJ 3293, with a peak above the 3σ confidence level at 41 d and two peaks the above 2σ confidence level at 34 and 70 d. Middle: the Hα index phased to P = 41 d (gray dots); the black dots are binned by 0.1 in phase. Bottom: RVs corrected for the 30.6 and 123.8 d signals against the Hα-index; the colors represent the phase of the 48 d signal from Table 4 (as represented in the middle panel of Fig. 5). |
To evaluate the stability of the 30.6, 48.1 and 123.8 d signals over time, we split the RVs into three groups of epochs: 2008−2009 (34 measurements), 2010−2011 (52 measurements), and 2012−2013 (59 measurements). We computed periodograms of the RVs and of their residuals after successively subtracting the stronger Keplerians. These seasonal periodograms consistently show strong evidence for the 30.6 and 123.8 d signals. The weaker 48.1 d signal is detected in the 2008−2009 and 2012−2013 periodograms, but not in the 2010−2011 epochs (bottom panels of Figs. 2–4). After investigating, we realized that the 2010−2011 measurements are strongly clustered at just two phases for a 48.1 d period and therefore highly insensitive to that signal. There is consequently strong evidence for the stability and planetary nature of the 30.6 and 123.8 d signal, but somewhat weaker evidence for the 48.1 d signal. The unfortunate phasing of the 2010−2011 measurements and the weaker signal do not allow strong limits against a possibly time-varying amplitude. While the period of that signal is moderately close to the 41 d possible stellar rotation and its true nature thus remains somewhat uncertain, the lack of any significant correlation between radial velocity and the stellar activity indicators suggest that it is planetary.
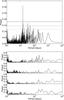 |
Fig. 7 Top panel: periodogram of the GJ 3341 radial velocities, with a peak above the 3σ confidence limit at 14 d (continuous black line). Bottom panel: periodograms for four subsets of epochs (BJD–2 400 000 = 54 800−55 000, 55 400−55 600, 55 800−56 050, 56 150−56 300); the 14 d (vertical dash-dotted line) peak is always present. |
5. Radial velocities of GJ 3341
We obtained 135 RV measurements of GJ 3341, spanning 1456 d. Their dispersion is σe = 3.51 m s-1, while the combined photon noise and instrumental errors average to ⟨ σi ⟩ = 1.89 m s-1. An F-test and a χ2 comparison against a constant model yield probabilities P(F) and P(χ2) < 10-9 that the RV dispersion is explained by the RVs uncertainties. The periodogram (Fig. 7) shows a peak at 14.21 d with power of p = 0.31. 1000 iterations of bootstrap randomization produced no random data set with a power above 0.24, and the FAP for this peak is therefore well below 10-3. The Horne & Baliunas (1986) recipe results in an FAP of 2.73 × 10⁻⁸.
One-Keplerian fit for GJ 3341.
A Keplerian fit with yorbit converges on an orbit with period P = 14.207 ± 0.007 d, eccentricity e = 0.31 ± 0.11, and semi-amplitude K1 = 3.036 ± 0.408. Given the stellar mass of M = 0.47 M⊙, the corresponding minimum planetary mass is 6.6 ± 0.1 M⊕. Table 5 summarizes the solution parameters. This solution (Fig. 8) has a reduced χ2 of χ2 = 2.28 ± 0.19 and a σe = 2.86 m s-1 dispersion of the residuals. An F-test and a χ2 test for a constant model resulted in probabilities P(F) = 1.18 × 10⁻⁶ and P(χ2) < 10-9 that this dispersion is explained by photon noise combined with instrumental errors. The periodogram of the residuals shows a p = 0.18 peak at 41 d, above the p = 0.16 level for a 1% FAP and grazing the 3σ confidence level. We were unable to reliably fit a Keplerian to these residuals, and stellar activity is therefore a more likely explanation for this additional RV variability.
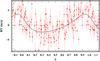 |
Fig. 8 GJ 3341 radial velocities phased for a 14.2 d period. |
5.1. Stellar activity
The periodogram of the Hα (Fig. 9) and S indices, contrast, bisector-span, and FWHM of the CCF show no evidence of stellar activity which could explain the RVs variations, and nor do plots of the RV as a function of these parameters. Subtracting a long-term trend visible in Hα index, however, increases the power in a pre-existing 46 d peak of its periodogram (Fig. 9) to 0.24, above the 3σ confidence level. Phasing the Hα index with this period produces relatively smooth and approximately sinusoidal variations, compatible with the signature of stellar rotation. This period is somewhat shorter than expected from the relatively weak Ca II emission of GJ 3341, which is intermediate in strength between those of Gl 618A (P = 57 d) and Gl 581 (P = 130 d) (Fig. 1), but probably within the dispersion of the period-activity relation. The period closely matches that found in the RV residuals, reinforcing activity as an explanation for them.
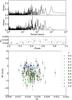 |
Fig. 9 Top: periodogram of the Hα emission index for GJ 3341, with a peak above the 3σ confidence level (continuous line) at 46 d. Middle: the Hα emission index phased to 46 d, which may represent the rotation period. Bottom: RV against Hα index, with colors representing the phase for the 14 d signal as in Fig. 8, T0 from Table 5. |
To evaluate the stability of the 14 d signal, we split the RVs into four seasons (BJD–2 400 000 = 54 800 − 55 000, 55 400−55 600, 55 800−56 050, 56 150−56300; 25, 32, 43, 32 measurements per epoch) and computed periodograms for each. The 14 d is consistently present in every periodogram.
6. Radial velocities of GJ 3543
We obtained 80 RV measurements of GJ 3543 spanning 1919 d, with a dispersion σe = 3.02 m s-1 compared to an average photon noise combined with instrumental error of ⟨ σi ⟩ = 1.21 m s-1. An F-test and a χ2 test for a constant model find a P< 10-9 probability that these known measurement errors explain the dispersion. The periodogram (Fig. 10) of the GJ 3543 RVs exhibits two strong peaks with powers of 0.37 and 0.34 at 1.1 and 9.2 d. Both peaks are well above the p = 0.29 for power at 0.3% FAP confidence level.
Our first yorbit one-Keplerian fit to the RVs converged on an orbit with period P = 1.11913 ± 0.00006, eccentricity e = 0.13 ± 0.16, and semi-amplitude K1 = 2.70 ± 0.38 (2.6 ± 0.4 M⊕). This solution decreases the dispersion to σe = 2.32 m s-1 and the reduced χ2 of the residuals to χ2 = 3.80 ± 0.32. The 9.2 d signal disappears in the periodogram of the residuals, demonstrating that the 1.1 and 9.2 d peaks are aliases of each other. If we introduce a prior that mildly favors a longer period, the fit instead converges on an orbit with period P = 9.161 ± 0.004, eccentricity e = 0.20 ± 0.15, and semi-amplitude K1 = 2.73 ± 0.44 (5.1 ± 0.9 M⊕), and the 1.1 d signal disappears in the periodogram of the residuals. Their dispersion is σe = 2.42 m s-1, and the reduced χ2 is χ2 = 4.14 ± 0.33. In either case the strongest peak in the periodogram of the residuals occurs at 23 d and has a power p = 0.25, which corresponds to a ~2.5% FAP. The daily sampling of the observations and the periodogram analysis both suggest that the 1.1 and 9.2 d signals are aliases of one other (1 / 1.119 + 1 / 9.161 = 1 / 1.003). The residuals of the two fits do not differ enough to ascertain which represents the true signal, and Fig. 11 therefore plots both solutions.
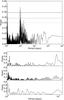 |
Fig. 10 Top panel: periodogram of the radial velocities of GJ 3543. The horizontal lines represent the same false-alarm levels as in Fig. 2. The two peaks at 1.1 and 9.2 d have an FAP lower than 0.3%. Bottom panel: periodograms for three independent subsets of observation epochs (BJD–2 400 000 = 55 500–55 750, first row; 55 850−56 050, second row; 56 340−56 380, third row). The 1.1 and 9.2 d peaks (marked by vertical dash-dotted lines) are both unstable over time. |
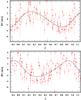 |
Fig. 11 Radials velocities for GJ 3543 RVs phased to the 1.1 d (top) and 9.2 d (bottom) period. |
6.1. Stellar activity
The power in the strongest peak in the periodogram of the S-index, (Fig. 12, second row), at 22 d, is p = 0.193 and just below the p = 0.198 needed for the 1σ confidence level. The strongest peak in the periodogram of the Hα index (Fig. 12, third row), at 19 d, is above the 1σ confidence level but still has a 14% FAP. Either period would be consistent with the strength of the Ca II emission line (Fig. 1), which suggest a stellar rotation period shorter than 35 d. While both activity signals have low significance, the P = 9.2 d radial velocity period is close the first harmonic of either 19 or 22 d, and the tentative 23 d peak in the periodogram of the RV residuals (Fig. 12, first row) is also close to both. We evaluated the stability of the 1.1 or 9.2 d signal by computing periodograms for three disjoint seasons, BJD-2 400 000 = 55 500–55 750, 55 850−56 050, and 56 340−56 380, which contain 25, 30, and 14 measurements. The two aliased signals are only present in the first season and are absent from the second and third seasons (Fig. 10, bottom panel). The seasonal datasets have too few measurements for a similar exercise for the tentative 23 d peak in the periodogram of the residuals. Our best guess is that stellar activity is responsible for the RVs variation, although we see no correlation between the variations of the RV and of the S or Hα indices. More data are needed to ascertain the source of the RV dispersion.
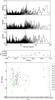 |
Fig. 12 Top panel: first row: periodogram of the residuals of the GJ 3543 radial velocities after subtracting the 1.1 d Keplerian orbit. The power excess at P = 23 d has a 2.5% FAP. Second row: periodogram of the S-index of GJ 3543. The significance of the 22 d peak is just under 1σ. Third row: periodogram of the Hα index of GJ 3543. The false-alarm probability of the 19 d peak is 14%. Middle panel: the Hα index phased to the 19 d period. Bottom panel: RVs against the Hα-index, the colors represent phase for the 9.2 d period, as represented in Fig. 11 (bottom), T0 from Table 6. |
The radial velocity signal at half the stellar rotation period found here for GJ 3543 has an analog in the recent reanalysis by Robertson et al. (2014) of the Forveille et al. (2011) GJ 581 data. This analogy provides an opportunity to summarize here the views of our team on the physical reality of the up to six planets that have been claimed to to orbit GJ 581, with heated controversies on the statistical significance of the weaker signals.
Our group announced the discoveries of “b” in 2005, followed by “c” and “d” in 2007 and then “e” in 2009 (Bonfils et al. 2005; Udry et al. 2007; Mayor et al. 2009), after considering both planetary and activity models in the interpretation of the observed periodic signals. The estimated rotational period of GJ 581 was much longer than the putative orbital periods of b, c and e, which consequently were immediately accepted as planets. The interpretation of the “d” signal was less straightforward because it occurred at a plausible rotational period for GJ 581. We discarded that explanation at the time, on the grounds that the Doppler variations, if caused by a spot on the rotating star, would have come together with larger photometric variations than observed (e.g., Bonfils et al. 2007). This made the planet the most likely interpretation, at that time.
Vogt et al. (2010) then combined the 2004 to 2008 HARPS data with new HIRES data, with most of the statistical weight on the HARPS side, to announce two additional planets in the system, f and g. We were monitoring GJ 581 very intensively, and we quickly reacted to the announcement of Vogt et al. (2010) by showing that our new HARPS data were incompatible with these additional two planets (Forveille et al. 2011). In that manuscript we relied on the measurement of Vogt et al. of a 90 d rotational period for GJ 581 to conclude that GJ 581d was a bona fide planet, since its period was comfortably away from any harmonic of the presumed rotational period.
Fit for one-Keplerian of GJ 3543.
Strong doubts, on different grounds, on the reality of GJ 581 f and g were also expressed by others (Tuomi 2011; Gregory 2011; Baluev 2013). Baluev et al. additionally questioned whether GJ 581d exists, finding that accounting for the correlated noise in the radial velocity measurements of GJ 581 decreased the significance of “d” to ~1.5σ. Robertson et al. more recently identified the astrophysical source of that correlated noise, showing that GJ 581 obeys a more complex RV-activity relation than previously thought. Instead of star spots, they invoked convection inhibition within active regions that locally changes the balance of ascending vs. descending material. Such active regions move as the star rotates and induce apparent Doppler shifts, but do not necessarily induce brightness variations. Robertson et al. additionally found the true rotation period of GJ 581 to be 130 days, quite different from that announced by Vogt et al. and twice the period of “d”. These findings together mean that the 65 day radial velocity signal is most probably due to two longitudinally opposed active regions, and show that extra caution is warranted when RV periodicities are found near a harmonic of the rotation period. This occurs here for GJ 3543, and might also be the case for the GJ 667C system (Delfosse et al. 2013a; Anglada-Escudé et al. 2013; Feroz & Hobson 2014), although its rotation period remains slightly uncertain.
7. Summary and conclusions
We analyzed observations of three early-M dwarfs with the HARPS spectrograph mounted on the 3.6 m telescope at La Silla observatory (ESO). We identified a planetary system orbiting GJ 3293, composed of two Neptunes with periods near the 4:1 resonance (30.6 ± 0.02 and 123.98 ± 0.38 d), and more tentatively a super-Earth with an orbital period of 48.14 ± 0.12 d. Although the RV variations appear to be uncorrelated with any stellar activity indicator, the orbital period of the least massive planet candidate remains moderately close to the plausible stellar rotation period. This signal is present and stable for the 2008−2009 and 2012−2013 subsets of the data, while the 2010−2011 subset has inadequate sampling to probe a 48 d period. More data are needed to fully confirm this planet candidate. With a 0.194 AU semi-major axis it orbits in the habitable zone of GJ 3293, and with a minimum mass of 7.9 ± 1.4 M⊕ it could be rocky. The hierarchical structure of the system warrants a dynamical analysis.
GJ 3341 is orbited by a super-Earth (msin(i) ~ 6.6 M⊕) that is placed by its period of 14.207 ± 0.007 d in the inner habitable zone of its host star.
The periodogram of the radial velocities of GJ 3543 is dominated by two mutually aliased peaks at 1.1 and 9.2 d, but they are only present in a subset of the epochs. The periodograms of the stellar activity indices suggest a stellar rotation period of about 20 d, or approximately twice the 9.2 d period, which further reinforces the assumption that stellar activity is responsible for the unstable radial velocity signal – see Boisse et al. (2011).
GJ 3293 and GJ 3341 have approximately solar metallicity, consistently with the observation that the frequency of super-Earth and Neptune planets seems to be uncorrelated with stellar metallicity (Mayor et al. 2011; Sousa et al. 2011; Neves et al. 2013). As the sample of well-characterized planetary systems increases and stellar properties are more accurately known, we will refine the statistical relations between the presence of planets and the stellar properties of their hosts, which will help constrain planet formation and evolution models.
Online material
Appendix A: RVs
The RVs are in the barycentric frame and are corrected for secular acceleration. The RVs were extracted through χ2 matching to a template with a high S/N. The errors combine the estimated photon noise with the an estimate of the residual instrumental error (0.60 m s-1). We also tabulate the FWHM and bisector span (BIS) of the CCF, as well as the activity indices of Hα and Ca II from Mount Wilson S.
GJ 3293 RVs, their uncertainty and activity indicators.
GJ 3341 RVs, its uncertainty and activity indicators.
GJ 3543 RVs, its uncertainty and activity indicators.
ε95/μ = 3.34 for the eccentricity upper limit, where μ = σe and α(%) = 5 for the detection threshold – using the nomenclature of Lucy (2013).
Acknowledgments
N.A. acknowledges support from CONICYT Becas-Chile 72120460. This publication makes use of data products from the Two Micron All Sky Survey, which is a joint project of the University of Massachusetts and the Infrared Processing and Analysis Center/California Institute of Technology, funded by the National Aeronautics and Space Administration and the National Science Foundation. X.B., X.D., and T.F. acknowledge the support of the French Agence Nationale de la Recherche (ANR), under the program ANR-12-BS05-0012 Exo-atmos. X.B. acknowledges funding from the European Research Council under the ERC Grant Agreement No. 337591-ExTrA. N.C.S. acknowledges the support from the European Research Council/European Community under the FP7 through Starting Grant agreement number 239953. N.C.S. further acknowledges the support from Fundação para a Ciência e a Tecnologia (FCT, Portugal) through FEDER funds in program COMPETE, as well as through national funds, in the form of grants reference RECI/FIS-AST/0176/2012 (FCOMP-01-0124-FEDER-027493), and RECI/FIS-AST/0163/2012 (FCOMP-01-0124-FEDER-027492), and through the Investigador FCT contract reference IF/00169/2012 and POPH/FSE (EC) by FEDER funding through the program "Programa Operacional de Factores de Competitividade – COMPETE.
References
- Anglada-Escudé, G., Tuomi, M., Gerlach, E., et al. 2013, A&A, 556, A126 [NASA ADS] [CrossRef] [EDP Sciences] [Google Scholar]
- Baluev, R. V. 2013, MNRAS, 429, 2052 [NASA ADS] [CrossRef] [Google Scholar]
- Baranne, A., Queloz, D., Mayor, M., et al. 1996, A&AS, 119, 373 [NASA ADS] [CrossRef] [EDP Sciences] [Google Scholar]
- Boisse, I., Bouchy, F., Hébrard, G., et al. 2011, A&A, 528, A4 [NASA ADS] [CrossRef] [EDP Sciences] [Google Scholar]
- Bonfils, X., Forveille, T., Delfosse, X., et al. 2005, A&A, 443, L15 [NASA ADS] [CrossRef] [EDP Sciences] [Google Scholar]
- Bonfils, X., Mayor, M., Delfosse, X., et al. 2007, A&A, 474, 293 [NASA ADS] [CrossRef] [EDP Sciences] [Google Scholar]
- Bonfils, X., Delfosse, X., Udry, S., et al. 2013a, A&A, 549, A109 [NASA ADS] [CrossRef] [EDP Sciences] [Google Scholar]
- Bonfils, X., Lo Curto, G., Correia, A. C. M., et al. 2013b, A&A, 556, A110 [NASA ADS] [CrossRef] [EDP Sciences] [Google Scholar]
- Bouchy, F., Pepe, F., & Queloz, D. 2001, A&A, 374, 733 [NASA ADS] [CrossRef] [EDP Sciences] [Google Scholar]
- Boyajian, T. S., von Braun, K., van Belle, G., et al. 2012, ApJ, 757, 112 [NASA ADS] [CrossRef] [Google Scholar]
- Cutri, R. M., Skrutskie, M. F., van Dyk, S., et al. 2003, VizieR Online Data Catalog, II/246 [Google Scholar]
- Delfosse, X., Forveille, T., Ségransan, D., et al. 2000, A&A, 364, 217 [NASA ADS] [Google Scholar]
- Delfosse, X., Bonfils, X., Forveille, T., et al. 2013a, A&A, 553, A8 [NASA ADS] [CrossRef] [EDP Sciences] [Google Scholar]
- Delfosse, X., Donati, J.-F., Kouach, D., et al. 2013b, in SF2A-2013: Proc. of the Annual Meet. of the French Society of Astronomy and Astrophysics, eds. L. Cambresy, F. Martins, E. Nuss, & A. Palacios, 497 [Google Scholar]
- Dressing, C. D., & Charbonneau, D. 2013, ApJ, 767, 95 [NASA ADS] [CrossRef] [Google Scholar]
- Dumusque, X., Santos, N. C., Udry, S., Lovis, C., & Bonfils, X. 2011, A&A, 527, A82 [NASA ADS] [CrossRef] [EDP Sciences] [Google Scholar]
- Feroz, F., & Hobson, M. P. 2014, MNRAS, 437, 3540 [NASA ADS] [CrossRef] [Google Scholar]
- Forveille, T., Bonfils, X., Delfosse, X., et al. 2011, unpublished [arXiv:1109.2505] [Google Scholar]
- Fressin, F., Torres, G., Charbonneau, D., et al. 2013, ApJ, 766, 81 [NASA ADS] [CrossRef] [Google Scholar]
- Gliese, W., & Jahreiß, H. 1991, Preliminary Version of the Third Catalogue of Nearby Stars, Tech. Rep. [Google Scholar]
- Gomes da Silva, J., Santos, N. C., Bonfils, X., et al. 2011, A&A, 534, A30 [NASA ADS] [CrossRef] [EDP Sciences] [Google Scholar]
- Gregory, P. C. 2011, MNRAS, 415, 2523 [NASA ADS] [CrossRef] [Google Scholar]
- Horne, J. H., & Baliunas, S. L. 1986, ApJ, 302, 757 [NASA ADS] [CrossRef] [Google Scholar]
- Howarth, I. D., Siebert, K. W., Hussain, G. A. J., & Prinja, R. K. 1997, MNRAS, 284, 265 [NASA ADS] [CrossRef] [Google Scholar]
- Johnson, D. R. H., & Soderblom, D. R. 1987, AJ, 93, 864 [NASA ADS] [CrossRef] [Google Scholar]
- Kiraga, M., & Stepien, K. 2007, Acta Astron., 57, 149 [NASA ADS] [Google Scholar]
- Kürster, M., Endl, M., Rouesnel, F., et al. 2003, A&A, 403, 1077 [NASA ADS] [CrossRef] [EDP Sciences] [Google Scholar]
- Leggett, S. K. 1992, ApJS, 82, 351 [NASA ADS] [CrossRef] [Google Scholar]
- Leggett, S. K., Allard, F., Geballe, T. R., Hauschildt, P. H., & Schweitzer, A. 2001, ApJ, 548, 908 [NASA ADS] [CrossRef] [Google Scholar]
- Lovis, C., & Pepe, F. 2007, A&A, 468, 1115 [NASA ADS] [CrossRef] [EDP Sciences] [Google Scholar]
- Lucy, L. B. 2013, A&A, 551, A47 [NASA ADS] [CrossRef] [EDP Sciences] [Google Scholar]
- Mayor, M., Pepe, F., Queloz, D., et al. 2003, The Messenger, 114, 20 [NASA ADS] [Google Scholar]
- Mayor, M., Bonfils, X., Forveille, T., et al. 2009, A&A, 507, 487 [NASA ADS] [CrossRef] [EDP Sciences] [Google Scholar]
- Mayor, M., Marmier, M., Lovis, C., et al. 2011, A&A, submitted [arXiv:1109.2497] [Google Scholar]
- Neves, V., Bonfils, X., Santos, N. C., et al. 2013, A&A, 551, A36 [NASA ADS] [CrossRef] [EDP Sciences] [Google Scholar]
- Neves, V., Bonfils, X., Santos, N. C., et al. 2014, A&A, 568, A121 [NASA ADS] [CrossRef] [EDP Sciences] [Google Scholar]
- Noyes, R. W., Hartmann, L. W., Baliunas, S. L., Duncan, D. K., & Vaughan, A. H. 1984, ApJ, 279, 763 [NASA ADS] [CrossRef] [Google Scholar]
- Nutzman, P., & Charbonneau, D. 2008, PASP, 120, 317 [NASA ADS] [CrossRef] [Google Scholar]
- Pepe, F., Mayor, M., Galland, F., et al. 2002, A&A, 388, 632 [NASA ADS] [CrossRef] [EDP Sciences] [Google Scholar]
- Queloz, D., Henry, G. W., Sivan, J. P., et al. 2001, A&A, 379, 279 [NASA ADS] [CrossRef] [EDP Sciences] [Google Scholar]
- Quintana, E. V., Barclay, T., Raymond, S. N., et al. 2014, Science, 344, 277 [NASA ADS] [CrossRef] [PubMed] [Google Scholar]
- Quirrenbach, A., Amado, P. J., Seifert, W., et al. 2012, in SPIE Conf. Ser., 8446 [Google Scholar]
- Riedel, A. R., Subasavage, J. P., Finch, C. T., et al. 2010, AJ, 140, 897 [NASA ADS] [CrossRef] [Google Scholar]
- Robertson, P., Mahadevan, S., Endl, M., & Roy, A. 2014, Science, 345, 440 [NASA ADS] [CrossRef] [Google Scholar]
- Salim, S., & Gould, A. 2003, ApJ, 582, 1011 [NASA ADS] [CrossRef] [Google Scholar]
- Selsis, F., Kasting, J. F., Levrard, B., et al. 2007, A&A, 476, 1373 [NASA ADS] [CrossRef] [EDP Sciences] [Google Scholar]
- Sousa, S. G., Santos, N. C., Israelian, G., Mayor, M., & Udry, S. 2011, A&A, 533, A141 [NASA ADS] [CrossRef] [EDP Sciences] [Google Scholar]
- Tuomi, M. 2011, A&A, 528, L5 [NASA ADS] [CrossRef] [EDP Sciences] [Google Scholar]
- Udry, S., Bonfils, X., Delfosse, X., et al. 2007, A&A, 469, L43 [NASA ADS] [CrossRef] [EDP Sciences] [Google Scholar]
- van Dokkum, P. G., & Conroy, C. 2010, Nature, 468, 940 [NASA ADS] [CrossRef] [Google Scholar]
- Vidotto, A. A., Jardine, M., Morin, J., et al. 2013, A&A, 557, A67 [NASA ADS] [CrossRef] [EDP Sciences] [Google Scholar]
- Vogt, S. S., Butler, R. P., Rivera, E. J., et al. 2010, ApJ, 723, 954 [NASA ADS] [CrossRef] [EDP Sciences] [Google Scholar]
- Wheatley, P. J., Pollacco, D. L., Queloz, D., et al. 2013, in EPJ Web Conf., 47, 13002 [Google Scholar]
- Zacharias, N., Finch, C. T., Girard, T. M., et al. 2012, VizieR Online Data Catalog: I/322 [Google Scholar]
- Zechmeister, M., & Kürster, M. 2009, A&A, 496, 577 [NASA ADS] [CrossRef] [EDP Sciences] [Google Scholar]
- Zucker, S., & Mazeh, T. 2006, MNRAS, 371, 1513 [NASA ADS] [CrossRef] [Google Scholar]
All Tables
All Figures
|
Fig. 1 Median spectra centered on the Ca II H line for reference stars, sorted by increasing rotation period: Gl 674 (red line, M3, Prot = 35 d), Gl 176 (cyan line, M2.5, Prot = 39 d), Gl 618A (blue line, M3, Prot = 57 d), and Gl 581 (green line, M2.5, Prot = 130 d). Median spectra for the targets of this paper, with no a priori known rotation period: GJ 3543 (black dotted line, M1.5), GJ 3293 (black full line, M2.5), and GJ 3341 (black dashed line, M2.5). |
| In the text | |
|
Fig. 2 Top panel: periodogram of the GJ 3293 RVs. The solid line, dashed line, and dashed dotted line represent the 0.3%, 4.6%, and 31.7% FAP levels, corresponding to 3σ, 2σ, and 1σ confidence, respectively. Bottom panel: periodograms for epochs 2008−2009 (34 measurements, first row), 2010−2011 (52 measurements, second row), and 2012−2013 (59 measurements, third row); the stability of the 30 d signal (dash-dotted vertical) is clear. |
| In the text | |
|
Fig. 3 Top panel: periodogram of the residuals from subtracting the first Keplerian (P = 30.6 d). The horizontal lines have the same meaning as in Fig. 2. Bottom panel: we split for subsets of the observational epochs, defined in the caption of Fig. 2, and performed their peridogram; in spite of the poor sampling of some of the subsets for a 123 d period, all show a peak around this period. |
| In the text | |
|
Fig. 4 Top panel. First row: periodogram of the subtraction residuals of two Keplerians with periods of 30.6 and 123.6 d, dominated by a 48 d peak. The horizontal lines represent FAP levels, as described in the captions of Fig. 2. Second row: periodogram of the residuals after subtracting three Keplerians with periods of 30.6, 123.6, and 439 d. The vertical dash-dotted line marks a P = 48 d period. Third row: periodogram of the residuals after subtracting Keplerians with periods of 30.6, 123.6, and 48 d. Bottom panel: periodogram of the residuals after subtracting the 30.6 and 123.6 d signals for each subset of epochs described in the captions of Fig. 2. The 48 d signal is not seen for the 2010−2011 observational epochs, which have a poor sensitivity to that period range because their sampling incidentally concentrates around just two phases. |
| In the text | |
|
Fig. 5 Radial velocities phased for each signal. P = 30.59 d top panel, P = 48.07 d middle panel, and P = 123.79 d bottom panel. |
| In the text | |
|
Fig. 6 Top: periodogram of the Hα emission index of GJ 3293, with a peak above the 3σ confidence level at 41 d and two peaks the above 2σ confidence level at 34 and 70 d. Middle: the Hα index phased to P = 41 d (gray dots); the black dots are binned by 0.1 in phase. Bottom: RVs corrected for the 30.6 and 123.8 d signals against the Hα-index; the colors represent the phase of the 48 d signal from Table 4 (as represented in the middle panel of Fig. 5). |
| In the text | |
|
Fig. 7 Top panel: periodogram of the GJ 3341 radial velocities, with a peak above the 3σ confidence limit at 14 d (continuous black line). Bottom panel: periodograms for four subsets of epochs (BJD–2 400 000 = 54 800−55 000, 55 400−55 600, 55 800−56 050, 56 150−56 300); the 14 d (vertical dash-dotted line) peak is always present. |
| In the text | |
|
Fig. 8 GJ 3341 radial velocities phased for a 14.2 d period. |
| In the text | |
|
Fig. 9 Top: periodogram of the Hα emission index for GJ 3341, with a peak above the 3σ confidence level (continuous line) at 46 d. Middle: the Hα emission index phased to 46 d, which may represent the rotation period. Bottom: RV against Hα index, with colors representing the phase for the 14 d signal as in Fig. 8, T0 from Table 5. |
| In the text | |
|
Fig. 10 Top panel: periodogram of the radial velocities of GJ 3543. The horizontal lines represent the same false-alarm levels as in Fig. 2. The two peaks at 1.1 and 9.2 d have an FAP lower than 0.3%. Bottom panel: periodograms for three independent subsets of observation epochs (BJD–2 400 000 = 55 500–55 750, first row; 55 850−56 050, second row; 56 340−56 380, third row). The 1.1 and 9.2 d peaks (marked by vertical dash-dotted lines) are both unstable over time. |
| In the text | |
|
Fig. 11 Radials velocities for GJ 3543 RVs phased to the 1.1 d (top) and 9.2 d (bottom) period. |
| In the text | |
|
Fig. 12 Top panel: first row: periodogram of the residuals of the GJ 3543 radial velocities after subtracting the 1.1 d Keplerian orbit. The power excess at P = 23 d has a 2.5% FAP. Second row: periodogram of the S-index of GJ 3543. The significance of the 22 d peak is just under 1σ. Third row: periodogram of the Hα index of GJ 3543. The false-alarm probability of the 19 d peak is 14%. Middle panel: the Hα index phased to the 19 d period. Bottom panel: RVs against the Hα-index, the colors represent phase for the 9.2 d period, as represented in Fig. 11 (bottom), T0 from Table 6. |
| In the text | |
Current usage metrics show cumulative count of Article Views (full-text article views including HTML views, PDF and ePub downloads, according to the available data) and Abstracts Views on Vision4Press platform.
Data correspond to usage on the plateform after 2015. The current usage metrics is available 48-96 hours after online publication and is updated daily on week days.
Initial download of the metrics may take a while.