Fig. 4
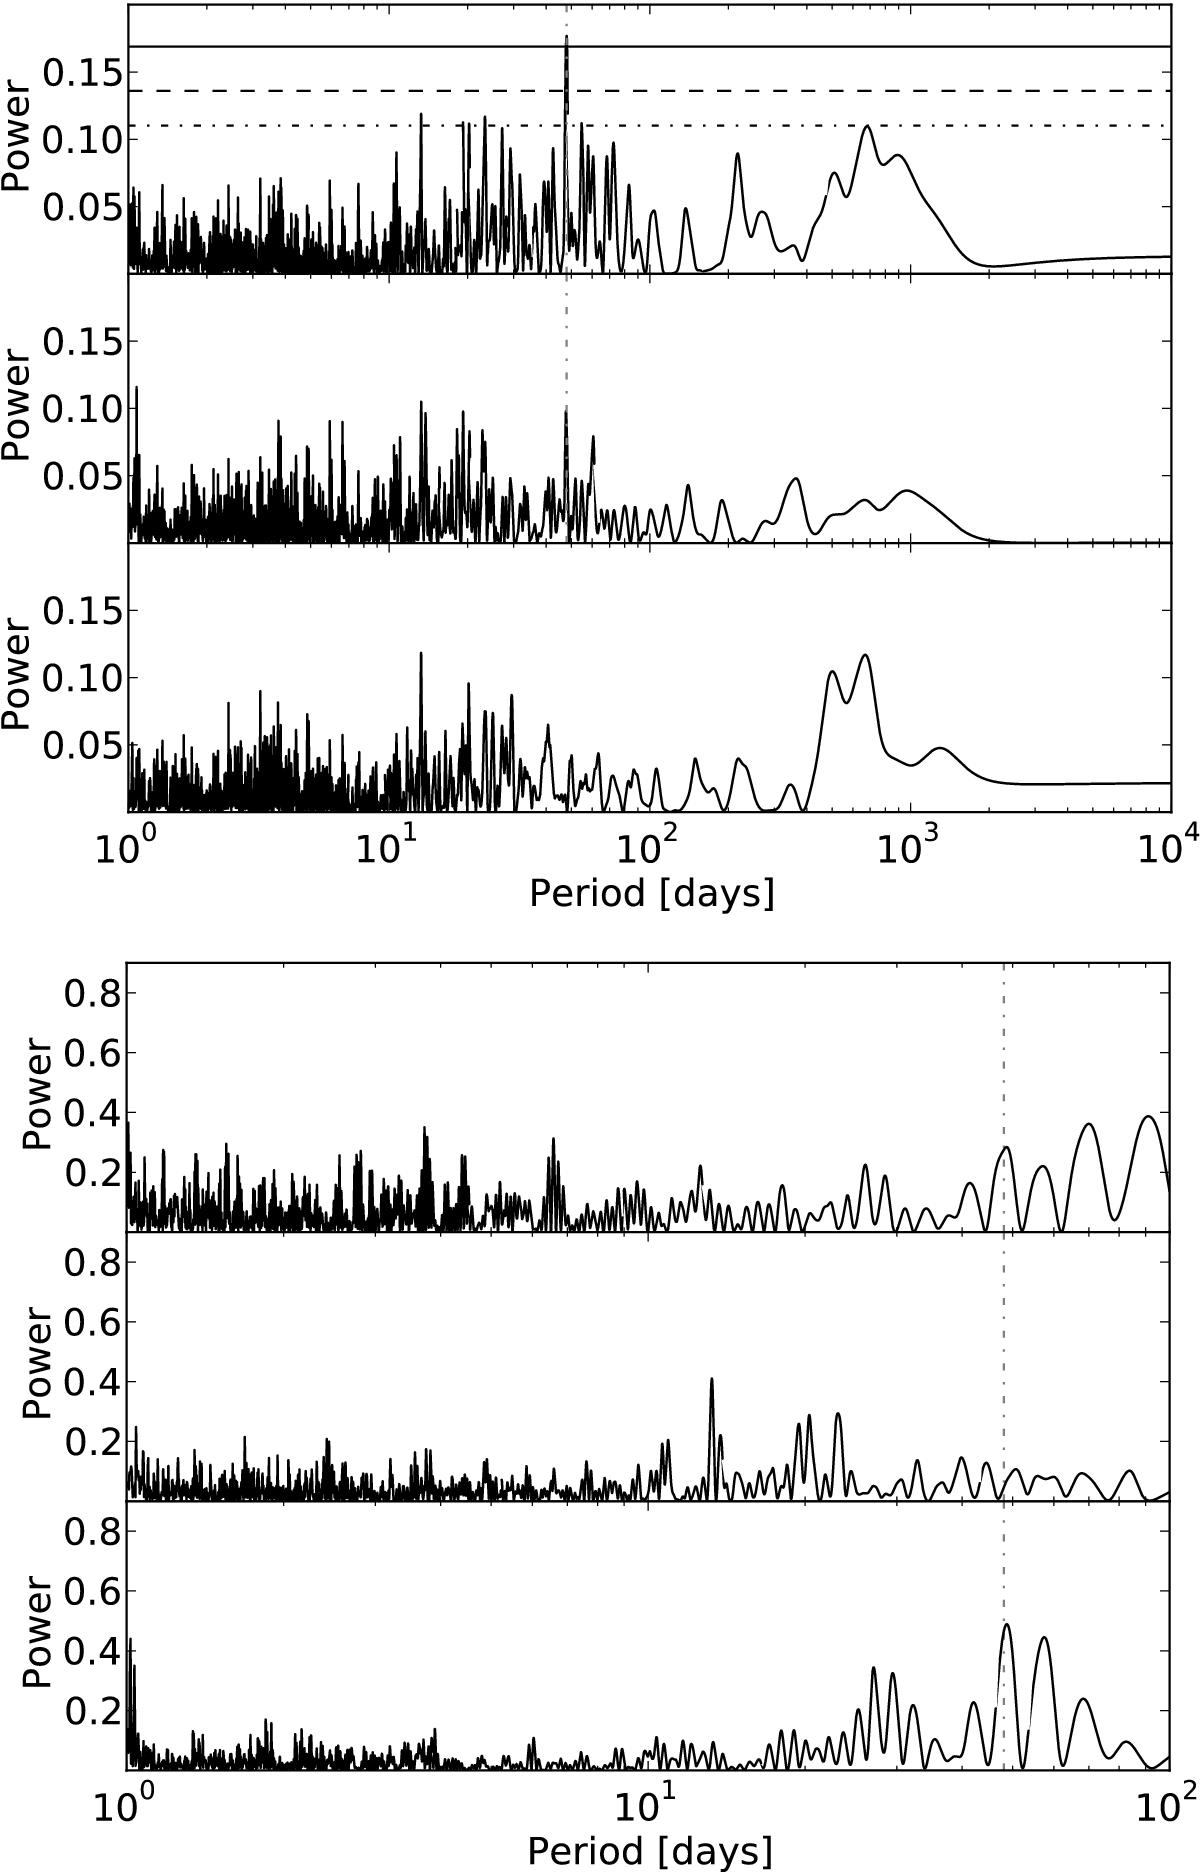
Top panel. First row: periodogram of the subtraction residuals of two Keplerians with periods of 30.6 and 123.6 d, dominated by a 48 d peak. The horizontal lines represent FAP levels, as described in the captions of Fig. 2. Second row: periodogram of the residuals after subtracting three Keplerians with periods of 30.6, 123.6, and 439 d. The vertical dash-dotted line marks a P = 48 d period. Third row: periodogram of the residuals after subtracting Keplerians with periods of 30.6, 123.6, and 48 d. Bottom panel: periodogram of the residuals after subtracting the 30.6 and 123.6 d signals for each subset of epochs described in the captions of Fig. 2. The 48 d signal is not seen for the 2010−2011 observational epochs, which have a poor sensitivity to that period range because their sampling incidentally concentrates around just two phases.
Current usage metrics show cumulative count of Article Views (full-text article views including HTML views, PDF and ePub downloads, according to the available data) and Abstracts Views on Vision4Press platform.
Data correspond to usage on the plateform after 2015. The current usage metrics is available 48-96 hours after online publication and is updated daily on week days.
Initial download of the metrics may take a while.