Fig. 2
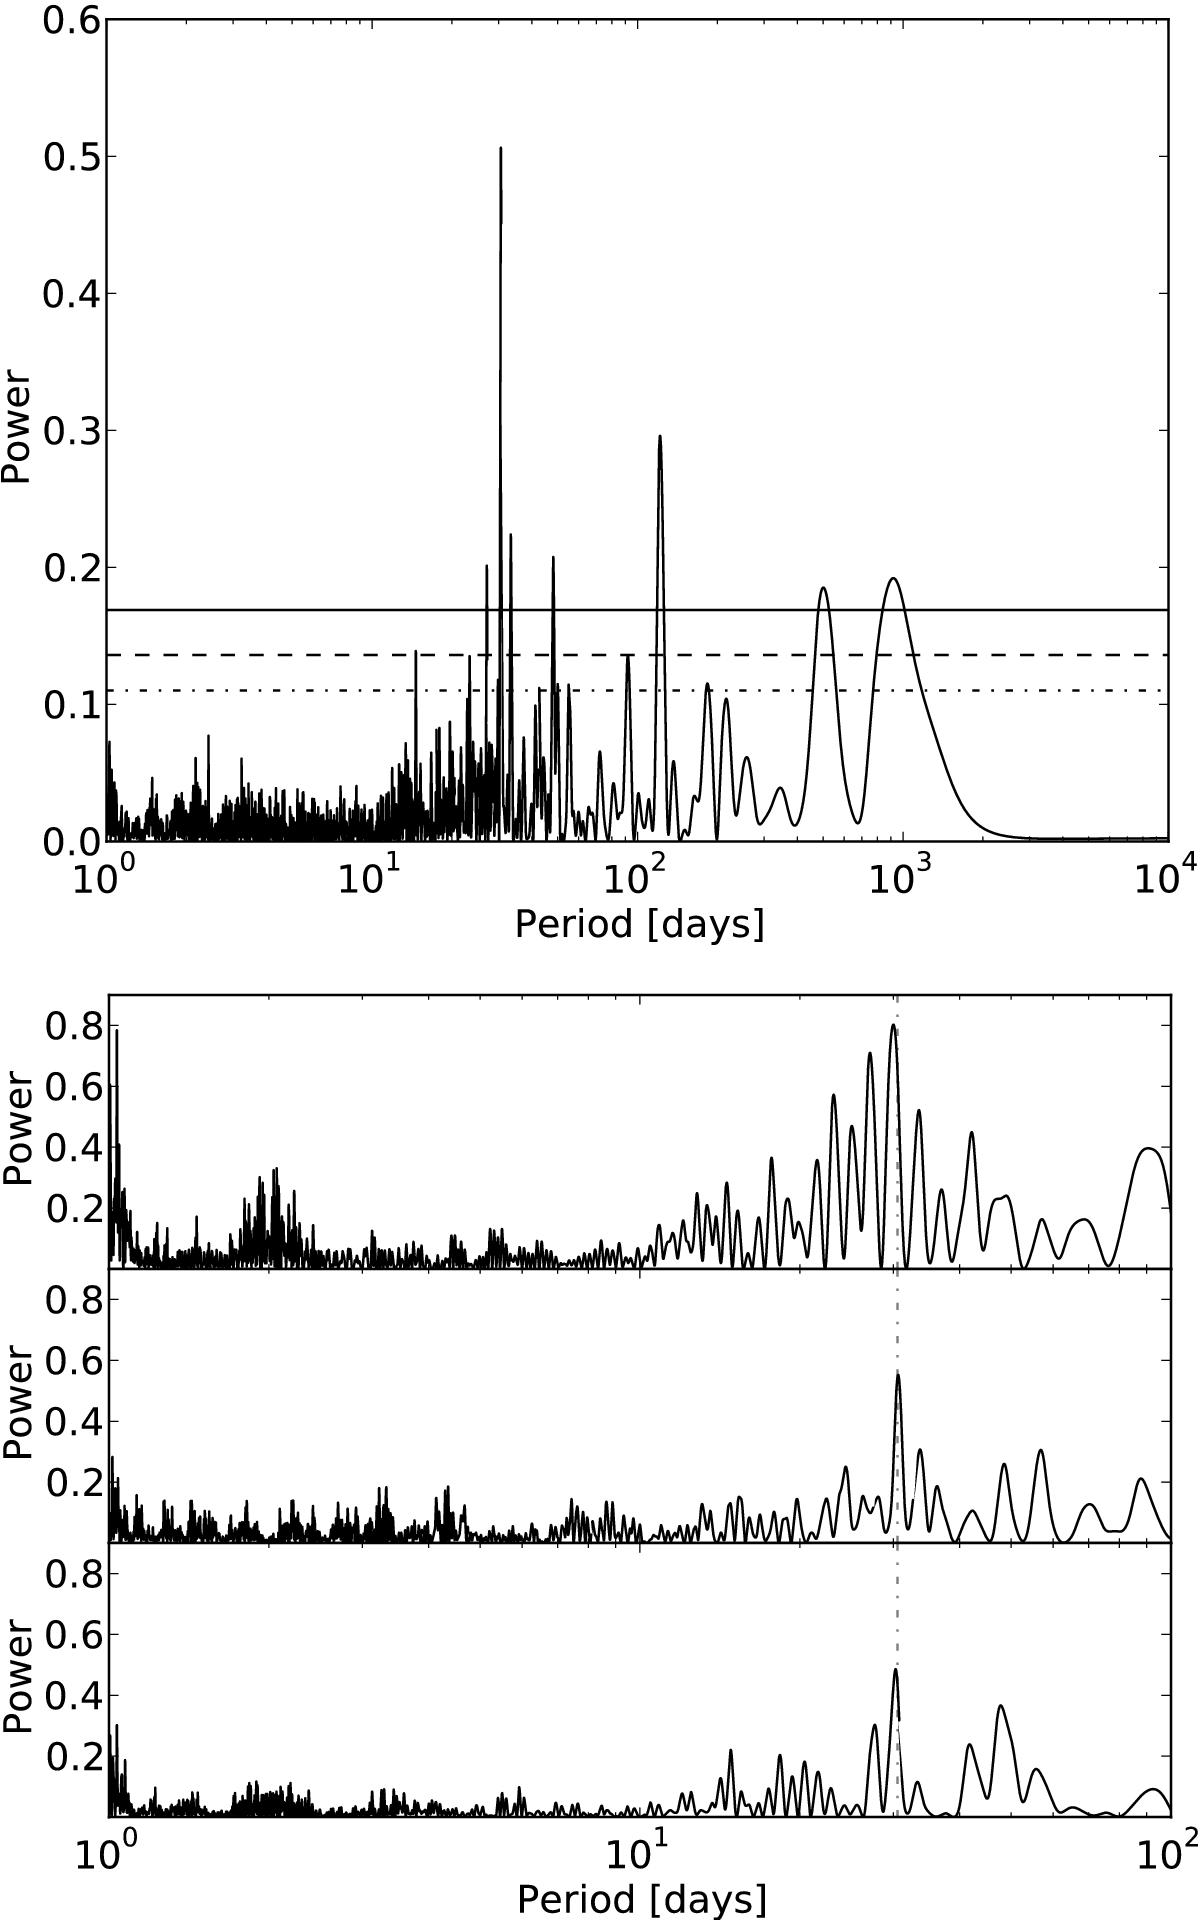
Top panel: periodogram of the GJ 3293 RVs. The solid line, dashed line, and dashed dotted line represent the 0.3%, 4.6%, and 31.7% FAP levels, corresponding to 3σ, 2σ, and 1σ confidence, respectively. Bottom panel: periodograms for epochs 2008−2009 (34 measurements, first row), 2010−2011 (52 measurements, second row), and 2012−2013 (59 measurements, third row); the stability of the 30 d signal (dash-dotted vertical) is clear.
Current usage metrics show cumulative count of Article Views (full-text article views including HTML views, PDF and ePub downloads, according to the available data) and Abstracts Views on Vision4Press platform.
Data correspond to usage on the plateform after 2015. The current usage metrics is available 48-96 hours after online publication and is updated daily on week days.
Initial download of the metrics may take a while.