Fig. 12
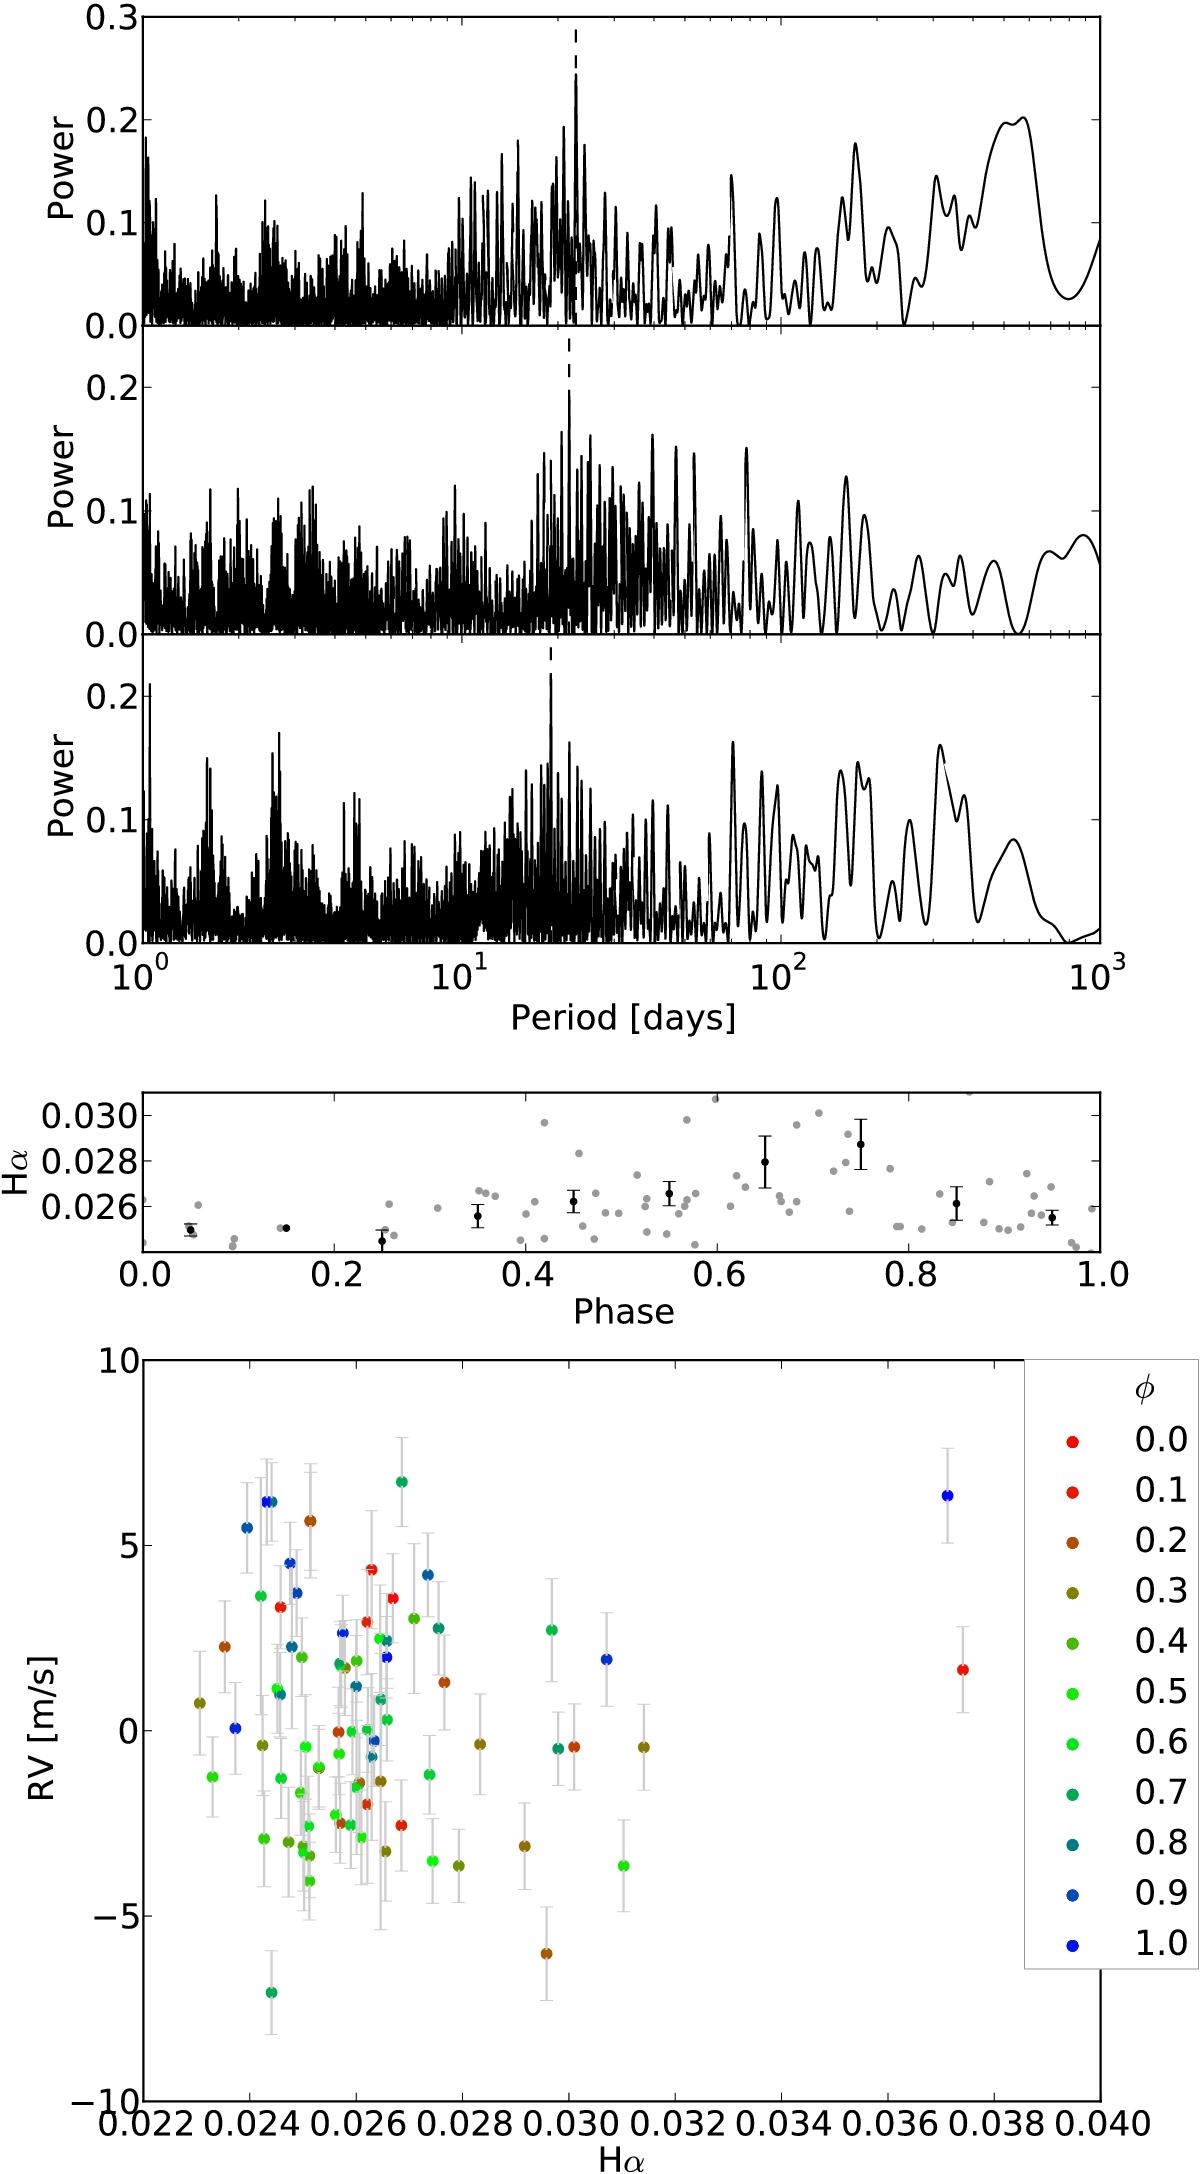
Top panel: first row: periodogram of the residuals of the GJ 3543 radial velocities after subtracting the 1.1 d Keplerian orbit. The power excess at P = 23 d has a 2.5% FAP. Second row: periodogram of the S-index of GJ 3543. The significance of the 22 d peak is just under 1σ. Third row: periodogram of the Hα index of GJ 3543. The false-alarm probability of the 19 d peak is 14%. Middle panel: the Hα index phased to the 19 d period. Bottom panel: RVs against the Hα-index, the colors represent phase for the 9.2 d period, as represented in Fig. 11 (bottom), T0 from Table 6.
Current usage metrics show cumulative count of Article Views (full-text article views including HTML views, PDF and ePub downloads, according to the available data) and Abstracts Views on Vision4Press platform.
Data correspond to usage on the plateform after 2015. The current usage metrics is available 48-96 hours after online publication and is updated daily on week days.
Initial download of the metrics may take a while.