Fig. 10
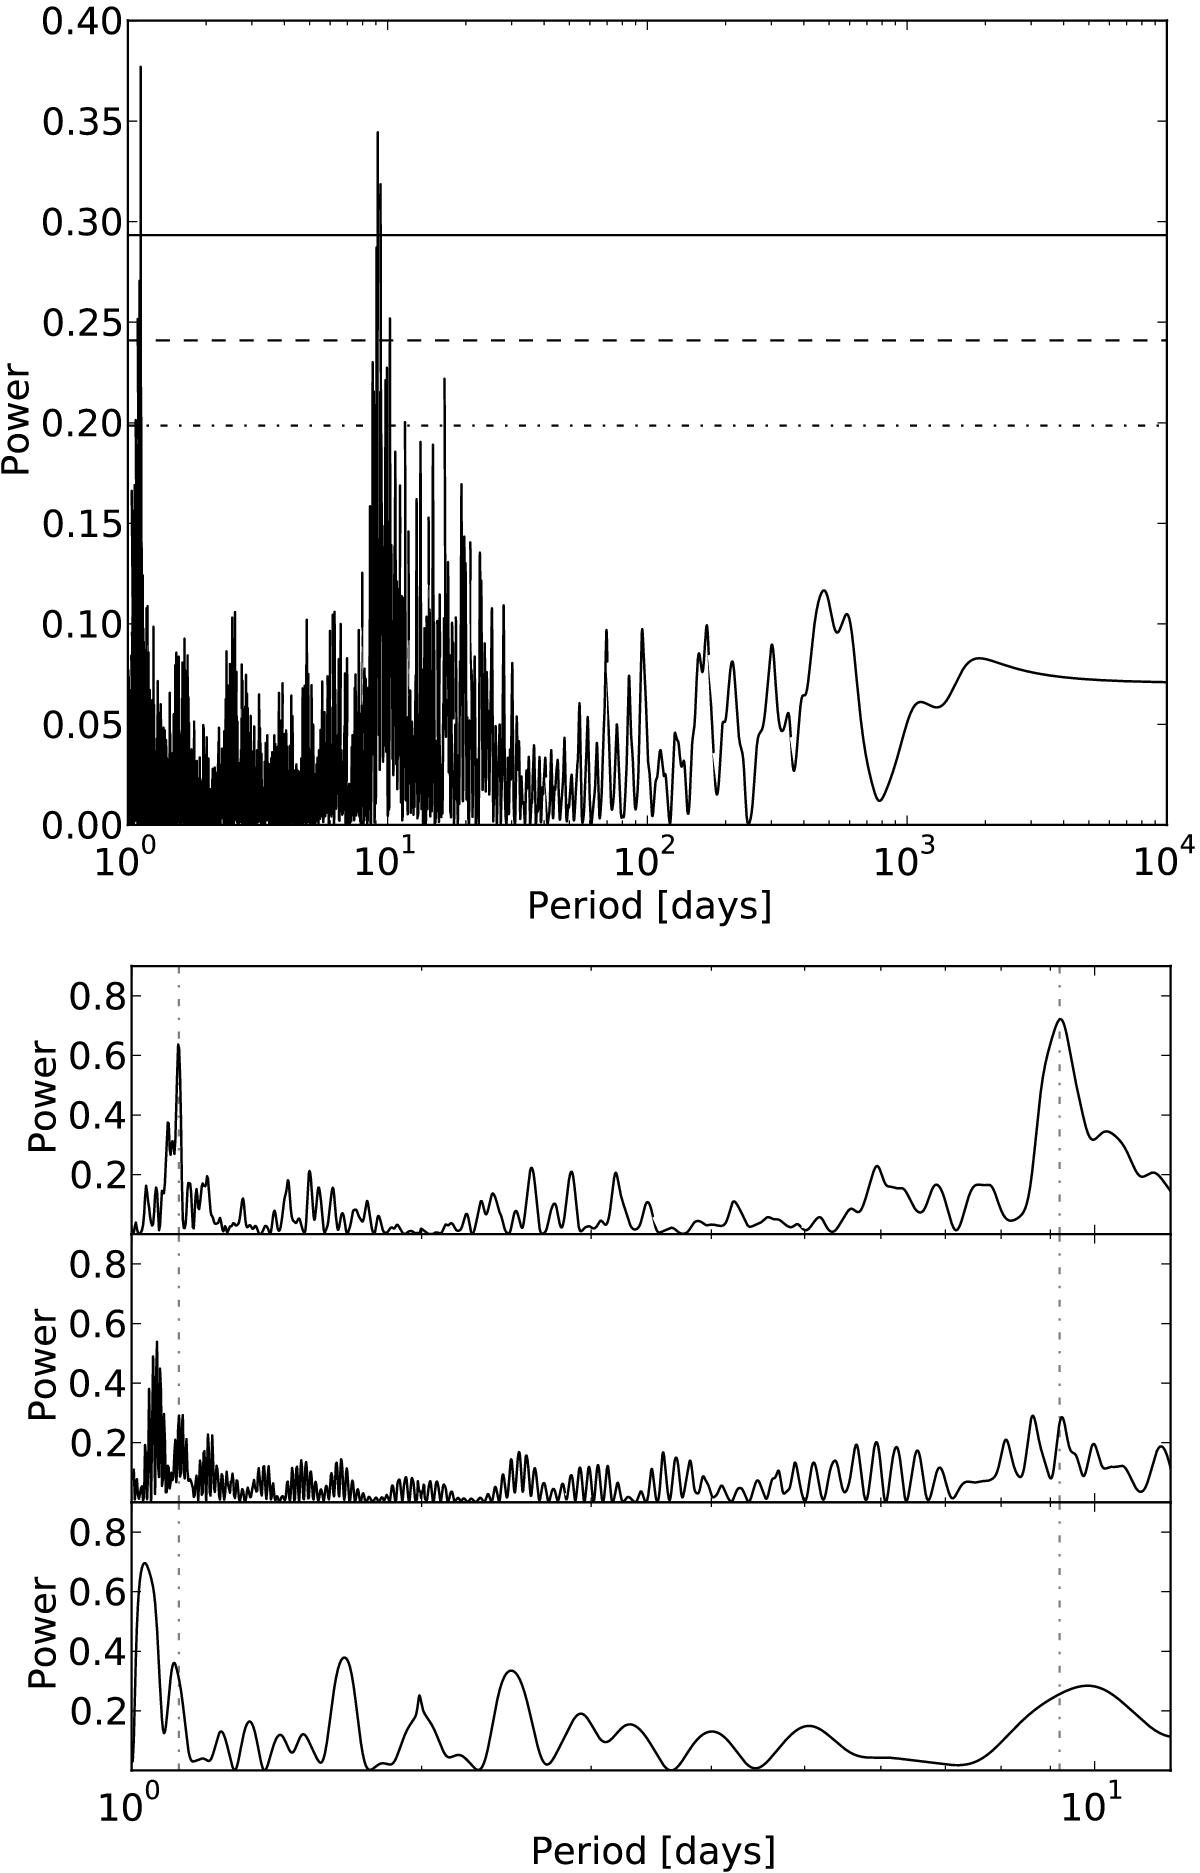
Top panel: periodogram of the radial velocities of GJ 3543. The horizontal lines represent the same false-alarm levels as in Fig. 2. The two peaks at 1.1 and 9.2 d have an FAP lower than 0.3%. Bottom panel: periodograms for three independent subsets of observation epochs (BJD–2 400 000 = 55 500–55 750, first row; 55 850−56 050, second row; 56 340−56 380, third row). The 1.1 and 9.2 d peaks (marked by vertical dash-dotted lines) are both unstable over time.
Current usage metrics show cumulative count of Article Views (full-text article views including HTML views, PDF and ePub downloads, according to the available data) and Abstracts Views on Vision4Press platform.
Data correspond to usage on the plateform after 2015. The current usage metrics is available 48-96 hours after online publication and is updated daily on week days.
Initial download of the metrics may take a while.