Fig. 9
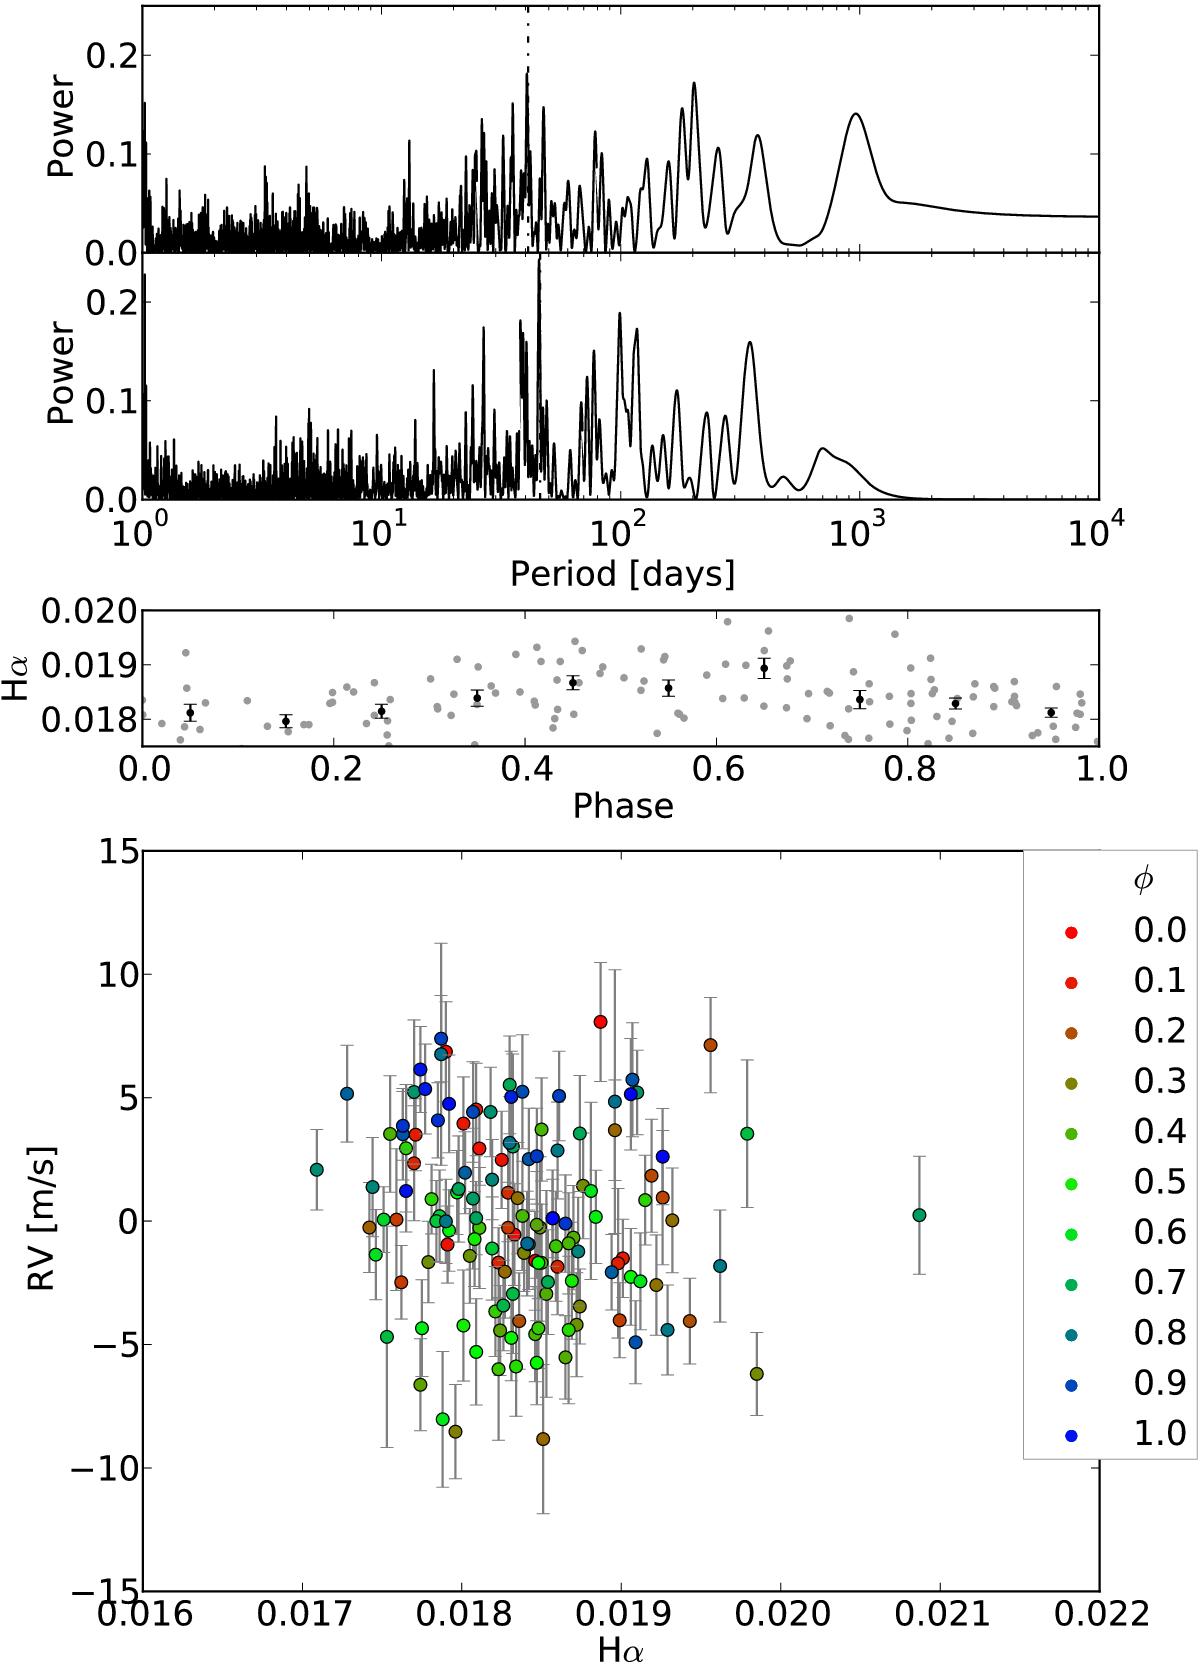
Top: periodogram of the Hα emission index for GJ 3341, with a peak above the 3σ confidence level (continuous line) at 46 d. Middle: the Hα emission index phased to 46 d, which may represent the rotation period. Bottom: RV against Hα index, with colors representing the phase for the 14 d signal as in Fig. 8, T0 from Table 5.
Current usage metrics show cumulative count of Article Views (full-text article views including HTML views, PDF and ePub downloads, according to the available data) and Abstracts Views on Vision4Press platform.
Data correspond to usage on the plateform after 2015. The current usage metrics is available 48-96 hours after online publication and is updated daily on week days.
Initial download of the metrics may take a while.