Fig. 6
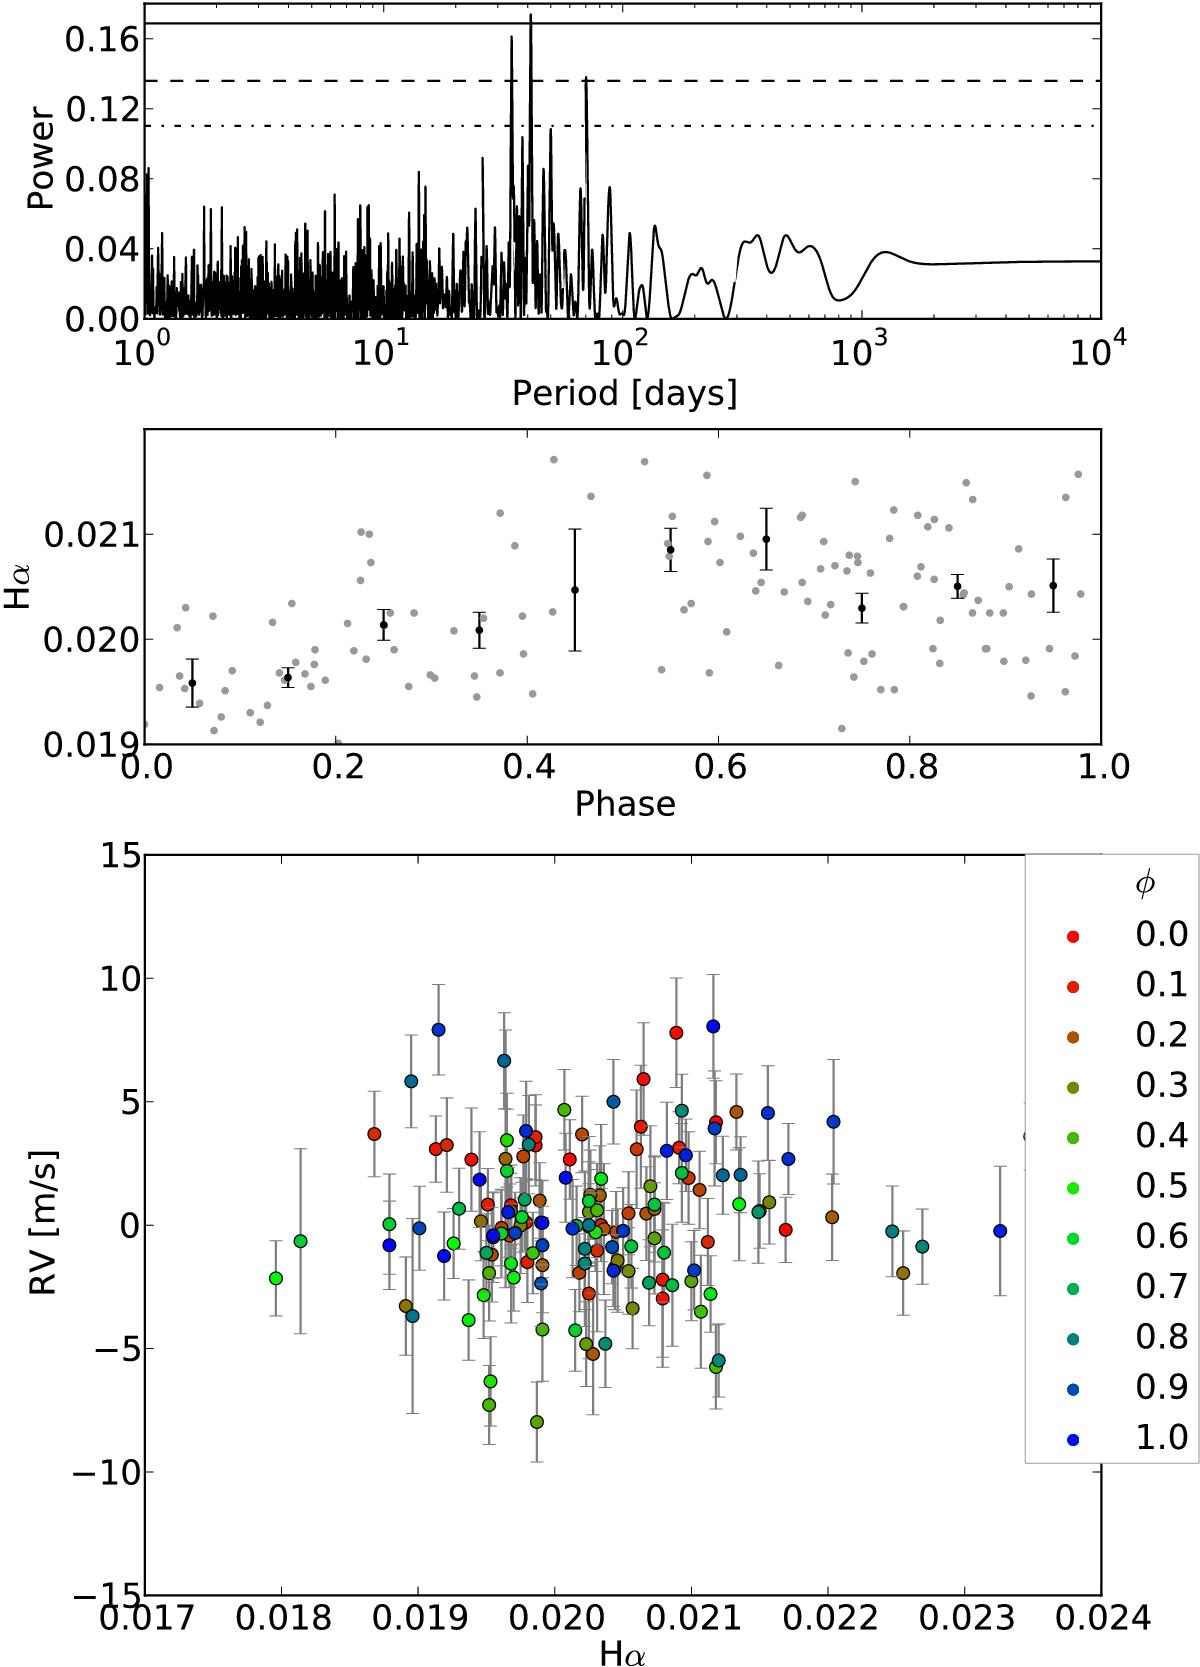
Top: periodogram of the Hα emission index of GJ 3293, with a peak above the 3σ confidence level at 41 d and two peaks the above 2σ confidence level at 34 and 70 d. Middle: the Hα index phased to P = 41 d (gray dots); the black dots are binned by 0.1 in phase. Bottom: RVs corrected for the 30.6 and 123.8 d signals against the Hα-index; the colors represent the phase of the 48 d signal from Table 4 (as represented in the middle panel of Fig. 5).
Current usage metrics show cumulative count of Article Views (full-text article views including HTML views, PDF and ePub downloads, according to the available data) and Abstracts Views on Vision4Press platform.
Data correspond to usage on the plateform after 2015. The current usage metrics is available 48-96 hours after online publication and is updated daily on week days.
Initial download of the metrics may take a while.