| Issue |
A&A
Volume 568, August 2014
|
|
|---|---|---|
| Article Number | A65 | |
| Number of page(s) | 28 | |
| Section | Interstellar and circumstellar matter | |
| DOI | https://doi.org/10.1051/0004-6361/201323074 | |
| Published online | 15 August 2014 | |
The hot core towards the intermediate-mass protostar NGC 7129 FIRS 2
Chemical similarities with Orion KL ⋆,⋆⋆,⋆⋆⋆
1
Observatorio Astronómico Nacional (OAN IGN), ,
Apdo 112,
28803
Alcalá de Henares,
Spain
email:
This email address is being protected from spambots. You need JavaScript enabled to view it.
2
Instituto de Ciencia de Materiales de Madrid (ICMM) C/ Sor Juana
Inés de la Cruz 3, Cantoblanco, 28049
Madrid,
Spain
3
Max Planck Institute for Extraterrestrial Physics,
Postfach 1312,
85741
Garching,
Germany
4
Department of Physics and Astronomy, University of
Waterloo, Waterloo,
Ontario, N2L 3G1, Canada
5
Department of Physics & Astronomy, University of
Victoria, Victoria,
BC, V8P 1A1, Canada
6
National Research Council of Canada, Herzberg Institute of
Astrophysics, 5071 West Saanich
Road, Victoria,
BC, V9E 2E7, Canada
7
Joint Astronomy Centre, 660 North A’ohoku Place, University Park,
Hilo, HI
96720,
USA
8
Leiden Observatory, Leiden University,
PO Box 9513,
2300 RA
Leiden, The
Netherlands
9
Centro de Radioastronomía y Astrofísica, Universidad Nacional
Autónoma de Mexico, PO Box
3-72, 58090
Morelia, Michoacán, Mexico
10
Jet Propulsion Laboratory, California Institute of Technology,
4800 Oak Grove
Drive, Pasadena,
CA
91109,
USA
Received:
18
November
2013
Accepted:
17
May
2014
Abstract
Context. This paper is dedicated to the study of the chemistry of the intermediate-mass (IM) hot core NGC 7129 FIRS 2, probably the most compact warm core found in the 2−8 M⊙ stellar mass range.
Aims. Our aim is to determine the chemical composition of the IM hot core NGC 7129 FIRS 2, and to provide new insights on the chemistry of hot cores in a more general context.
Methods. NGC 7129 FIRS 2 (hereafter, FIRS 2) is located at a distance of 1250 pc and high spatial resolution observations are required to resolve the hot core at its center. We present a molecular survey from 218 200 MHz to 221 800 MHz carried out with the IRAM Plateau de Bure Interferometer (PdBI). These observations were complemented with a long integration single-dish spectrum taken with the IRAM 30 m telescope in Pico de Veleta (Spain). We used a local thermodynamic equilibrium (LTE) single temperature code to model the whole dataset.
Results. The interferometric spectrum is crowded with a total of ≈300 lines from which a few dozen remain unidentified. The spectrum has been modeled with a total of 20 species and their isomers, isotopologues, and deuterated compounds. Complex molecules like methyl formate (CH3OCHO), ethanol (CH3CH2OH), glycolaldehyde (CH2OHCHO), acetone (CH3COCH3), dimethyl ether (CH3OCH3), ethyl cyanide (CH3CH2CN), and the aGg’ conformer of ethylene glycol (aGg’-(CH2OH)2) are among the detected species. The detection of vibrationally excited lines of CH3CN, CH3OCHO, CH3OH, OCS, HC3N, and CH3CHO proves the existence of gas and dust at high temperatures. The gas kinetic temperature estimated from the vibrational lines of CH3CN, ~405-67+100 K, is similar to that measured in massive hot cores. Our data allow an extensive comparison of the chemistry in FIRS 2 and the Orion hot core.
Conclusions. We find a quite similar chemistry in FIRS 2 and Orion. Most of the studied fractional molecular abundances agree within a factor of 5. Larger differences are only found for the deuterated compounds D2CO and CH2DOH and a few molecules (CH3CH2CN, SO2, HNCO and CH3CHO). Since the physical conditions are similar in both hot cores, only different initial conditions (warmer pre-collapse and collapse phase in the case of Orion) and/or different crossing times of the gas in the hot core can explain this behavior. We discuss these two scenarios.
Key words: astrochemistry / stars: formation / ISM: individual objects: NGC 7129 FIRS 2
Based on observations carried out with the IRAM Plateau de Bure Interferometer. IRAM is supported by INSU/CNRS (France), MPG (Germany), and IGN (Spain).
Appendices are available in electronic form at http://www.aanda.org
The interferometrid spectra of Fig. A.1 is only available at the CDS via anonymous ftp to cdsarc.u-strasbg.fr (130.79.128.5) or via http://cdsarc.u-strasbg.fr/viz-bin/qcat?J/A+A/568/A65
© ESO, 2014
1. Introduction
Intermediate-mass young stellar objects (IMs) are the precursors of stars in the 2−8 M⊙ mass range (Herbig Ae/Be stars). They share some characteristics with massive young stellar objects (clustering, photodissociation regions), but they are more common than the more massive stars and therefore they can be found closer to the Sun (d< 1 kpc), which allows determination of the physical and chemical structure of their envelopes at similar spatial scales as can be done for low-mass protostars. From a chemical point of view, IMs are interesting because they constitute the link between the low-mass and high-mass ranges, covering an intermediate range of luminosities, densities, and temperatures.
Hot molecular cores are compact (<0.05 pc) objects with high temperatures (>100 K) and densities (n(H2) > 106 cm-3) and they are characterized by a very rich chemistry of complex organic molecules (COMs). The typical massive hot core is the one associated with Orion KL; it hosts one of the richest molecular chemistries observed in the interstellar medium (Blake et al. 1987; Beuther et al. 2005, 2006; Tercero et al. 2010, 2011, 2013; Motiyenko et al. 2012; Cernicharo et al. 2013); COMs have also been detected coming from the inner regions of a few low-mass protostars, the so-called hot corinos (IRAS 16293-2422: Cazaux et al. 2003; Bottinelli et al. 2004a; Pineda et al. 2012; NGC 1333 IRAS 2A: Jørgensen et al. 2005, 2007; NGC1333-IRAS 4AB: Bottinelli et al. 2004b, 2007). These regions have smaller sizes (~150 AU) and lower temperatures (~100 K). Although high sensitivity interferometric data on hot cores and corinos are still scarce and the comparison is difficult, there is some general consensus that hot corinos are richer in O-bearing molecules like CH3OCHO, CH3CHO, CH3OCH3, or HCOOH, and poorer in N-bearing compounds. Furthermore, large abundances of deuterated molecules and large deuterium fractions are only associated with hot corinos (Vastel et al. 2003; Parise et al. 2004; Demyk et al. 2010).
30 m/PdBI lines.
A handful of well studied hot cores exist in the IM range: NGC 7129 FIRS 2 (Fuente et al. 2005a, hereafter FU05), IC 1396 N (Neri et al. 2007; Fuente et al. 2009), IRAS 22198+6336 (Sánchez-Monge et al. 2010; Palau et al. 2011), and AFGL 5142 (Palau et al. 2011). The sizes of these IM hot cores range from ~130 AU (IRAS 22198) to ~900 AU (NGC 7129) and their chemistries present some differences. Fuente et al. (2005a,b) proposed that IM hot cores, like hot corinos, are richer in H2CO and HCOOH relative to CH3OH than massive hot cores, and they did not find any variation in the CH3CN/CH3OH abundance ratio across the stellar range. Palau et al. (2011) studied the chemistry of IRAS 22198+6336 and AFGL 5142 and concluded that these IM hot cores are richer in oxygenated molecules with two or more CH2/3 groups than hot corinos, but poorer in N-bearing molecules than massive hot cores. As yet, the number of studied objects is very low and the derived column densities have large uncertainties.
In this paper, we present a 4 GHz interferometric frequency survey towards the hot core NGC 7129 FIRS 2 (hereafter, FIRS 2) that, with a luminosity of ~500 L⊙, lies near the middle of the IM luminosity range. FIRS 2 is a prototypical young IM protostar; it is associated with energetic outflows (Fuente et al. 2001) and presents clear signs of CO depletion and enhanced deuterium fractionation when observed with single-dish telescopes (scales of ~10 000 AU; Fuente et al. 2005b; Alonso-Albi et al. 2010). It is located at a distance of 1250 ± 50 pc from the Sun (Shevchenko & Yakubov Shevchenko1989) and FU05 detected a compact hot core at its center. FIRS 2 was observed with Herschel within the Water In Star-forming regions (WISH) key program (van Dishoeck et al. 2011) and it is one of the best known IM protostars with a huge set of data at both millimeter and far-IR wavelengths (Johnstone et al. 2010; Fich et al. 2010; Fuente et al. 2012). This source and IRAS 22198+6336 are the only hot cores without clear signs of clustering which suggests that their luminosity could come from a single binary system (Palau et al. 2013).
2. Observations
The interferometric observations were carried out with the Plateau de Bure Interferometer (PdBI) in its CD configuration during August and November 2012. This configuration provided an angular resolution of 1.43″ × 1.26″ PA 144° (~1870 AU × 1647 AU at the distance of FIRS 2) at the central frequency. The 1 mm receivers were tuned at 219.360 GHz which allowed the simultaneous imaging of the C18O 2 → 1 and 13CO 2 → 1 lines, both within the ~4 GHz receiver’s band. The narrow 40 MHz correlator units were used to sample the C18O and 13CO lines at the high spectral resolution of 40 kHz. The wideband correlator WideX sampled the whole 4 GHz bandwidth with a spectral resolution of ~2 MHz. MWC 349 was used as flux calibrator (1.92 Jy) and the rms in each WideX channel, 4−6 mJy/beam (~0.058–0.087 K).
The interferometric observations were complemented with single-dish observations using the
30 m telescope and the same frequency setup. These observations were done in December 2012
and the achieved rms ( ) was
~0.012 K (0.09 Jy) in a
channel of ~1.953 MHz.
Therefore, the 30 m observations are ~15 times less sensitive than the PdB images. The telescope was pointed
towards the phase center of the interferometric observations:
) was
~0.012 K (0.09 Jy) in a
channel of ~1.953 MHz.
Therefore, the 30 m observations are ~15 times less sensitive than the PdB images. The telescope was pointed
towards the phase center of the interferometric observations:
 ,
,
 (J2000). Forward and main beam
efficiencies are 0.92 and 0.63, respectively. The selected intensity scale is main beam
temperature.
(J2000). Forward and main beam
efficiencies are 0.92 and 0.63, respectively. The selected intensity scale is main beam
temperature.
This paper is dedicated to the analysis of the chemical complexity revealed by the WideX data towards the mm continuum source.
3. Results
3.1. Continuum maps
The high density of lines detected made it impossible to accurately measure the continuum
flux from the low spectral resolution WideX data. Instead, we used the empty emission
channels around the C18O and 13CO lines measured at higher spectral resolution using
the 40 MHz correlator units to determine the continuum flux. As expected, the continuum
flux was slightly different at 219.560 GHz and 220.398 GHz. We derived two continuum maps
at 219.560 GHz and 220.299 GHz. Fitting the visibilities we obtained the position of the
compact source:  ,
,
 , i.e., offset by −0.17″ in right ascension from our phase center.
The measured fluxes are 0.37(0.01) Jy at 219.560 GHz and 0.38(0.01) at 220.398 GHz,
respectively. In FU05, we determined a mm emission spectral index of 2.56 based on the
continuum images at 86 GHz and 230 GHz. The new fluxes at 219.6 GHz and 220.4 GHz are
consistent with these results taking into account the uncertainty of 10% in the absolute
flux calibration.
, i.e., offset by −0.17″ in right ascension from our phase center.
The measured fluxes are 0.37(0.01) Jy at 219.560 GHz and 0.38(0.01) at 220.398 GHz,
respectively. In FU05, we determined a mm emission spectral index of 2.56 based on the
continuum images at 86 GHz and 230 GHz. The new fluxes at 219.6 GHz and 220.4 GHz are
consistent with these results taking into account the uncertainty of 10% in the absolute
flux calibration.
3.2. Molecular lines
In Fig. A.1 we show the WideX spectra towards the continuum peak. The continuum image at 219.560 GHz was subtracted from the spectral maps before the cleaning process. This subtraction is not perfect since the continuum presents a smooth slope across the observed bandwidth, but it is good enough for our current detection goals.
The spectrum towards the compact source is crowded with lines, typical of those found in massive hot cores. In order to estimate the flux that the interferometer is missing, we compared the PdBI spectrum with that obtained with the 30 m telescope. In Table 1 we show the list of all the lines detected with both telescopes and the fraction of flux recovered using the PdBI. We note that only the H2CO, CH3OH, SO, C18O, and 13CO lines are missing a significant fraction of their fluxes when observed with the PdBI. The emission of OCS, HNCO, CH3CN, and HC3N comes mainly from the hot core although 20% of the flux of the lowest energy HNCO line is missing. This is also consistent with the spatial distribution as observed with the PdBI. In Fig. 1, we show the integrated intensity images of some of the more intense lines. Only 13CO, C18O, and SO present large-scale structure. In all the other molecules the emission is point-like at the angular resolution of our observations.
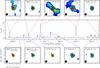 |
Fig. 1 Middle: PdBI spectrum towards the emission peak. Top and
bottom: integrated intensity maps of the most intense lines in the
portion of spectrum between 219.5 GHz and 220.7 GHz. In all the panels the contours
start and increases at steps of 3 ×
σ. Sigma and peak values in Jy/beam
× km s-1 are: 0.10, 2.47
(C18O 2–1);
0.12, 2.12 (HNCO 100–90); 0.21, 8.65 (SO 56–45); 0.22, 7.28
(13CO 2–1);
0.08, 2.20 (CH3CN 124–114); 0.11, 1.04 (HNCO 103–93); 0.12, 2.13 (HNCO
102–92); 0.11, 1.18
(H |
4. Line identification and rotational diagrams
For line identification we used José Cernicharo’s personal catalogue which is included in the radiative transfer and molecular excitation code MADEX (Cernicharo 2012), the JPL (Pickett 1991, 1998), and the CDMS (Müller et al. 2001, 2005) catalogues. Our procedure can be summarized as follows. We started with the identification of the lines of the most common species. The rotation temperatures, molecular column densities, and source sizes were estimated by fitting the line intensities of the whole family of molecules (all isotopologues) within the program MADEX. In these calculations, we assumed local thermodynamic equilibrium, vLSR = −10 km s-1, a linewidth of 8 km s-1 and a face-on disk as the source morphology. In the case of a good fit, we created a synthesized spectrum using the derived parameters and subtracted it from the observations. Then, we went on with line identification in the residual spectrum. Sometimes, especially for the weak lines, the fit was not good enough. In these cases, we did not subtract the synthesized spectrum in order to avoid spurious features and just went on identifying the features in the original spectrum.
The number of parameters that can be determined for each species depends on the number of lines detected. For example, the source size can only be determined when the lines of the main isotopologue are optically thick. In the optically thick case, TB ≈ ηff × Jν(Trot), where ηff is the beam filling factor, and Jν(Trot) = hν/kTrot × (1 − exp(hν/kTrot))-1 with Trot the rotation temperature. Provided that we know Trot, we can estimate the effective size of the emitting region from the line intensities. The emission sizes cannot be constrained if the main isotopologue lines are optically thin.
For the less abundant molecules, the number of detected lines was too low or the line intensities were too uncertain to estimate the rotation temperature. In these cases, a rotation temperature of ~200 K was assumed and only the molecular column densities are calculated using MADEX. In Sects. 4.1 to 4.19, we give a more detailed description of the fitting for each species and the results of these calculations are shown in Tables 2 and 3.
Frequencies and line identifications are shown in Table A.1. We compare our synthesized spectrum including all species with observations in Fig. A.1.
Results of the rotational diagram analysis.
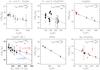 |
Fig. 2 Results of the rotational diagrams for CH3CN ν = 0, CH3CN ν8 = 1, CH3OCHO, HNCO, CH2DOH and aGg’-(CH2OH)2. The high rotation temperature fitted to the CH3CN ν = 0 rotational diagram is the consequence of the lines being optically thick and is not considered in our modeling (see Sect. 4.1). In the rotational diagram of the CH3CN ν8 = 1 vibrational state we use different symbols for: blended lines (empty circles), isolated or partially blended lines (filled circles), and the points with Erot> 400 K (triangles). The three straight lines correspond to the least squares fittings with all the points (black), only unblended lines (red), and unblended lines with Erot< 400 K (blue). For CH3OCHO, the points corresponding to the ν = 0 lines are indicated with filled circles and νt = 1 with empty circles. The parameters of the transitions used in the rotation diagrams are listed in Tables A.3–A.8. Red points have not been used in the least squares fitting because they correspond to heavily blended lines. |
4.1. Methyl cyanide: CH3CN, CH3NC
Methyl cyanide (CH3CN) is one of the best thermometers in hot cores. The
symmetric rotor presents a K-ladder structure with transitions that are easily
thermalized at the densities prevailing in hot cores. In addition, it is well known that
this molecule is especially abundant in these regions. We have detected the whole
12K →
11K ladder, from K = 0 to K = 11 in the
ν = 0
ground vibrational state and in the ν8 = 1 vibrational level at
Evib =
525.17 K (see Table A.4). The
high number of detected lines would allow us to determine the rotation and vibrational
temperature of this molecule providing that the emission is optically thin (see Fig. 2). As discussed below, this is not the case of the
ν = 0
lines. Instead, we used the ν8 = 1 lines to estimate the rotation
temperature. Unfortunately, most of the lines are blended or partially blended. This is
the cause of the large uncertainties in the integrated intensities shown in Table A.4. All the lines have Tb>
3σ, but the uncertainty in the linewidth is large for
partially blended lines. As a first step we plotted all the detected lines in a rotational
diagram and visually checked if any of them were clearly above or below the straight line
defined by the other points. We removed the line at 221 265 MHz that was clearly above the
fit and derived  K using the rest of the points (the parameters of this fit are shown in Table 2). The fit was good (R = 0.81) suggesting that
the contribution of other species to the measured line integrated intensities were within
the errors. To corroborate this assumption, as a second step, we removed the lines that
were severely blended (difference in frequency less than 4 MHz) and kept only those that
were isolated or partially blended. In the end we had only eight transitions and derived
K using the rest of the points (the parameters of this fit are shown in Table 2). The fit was good (R = 0.81) suggesting that
the contribution of other species to the measured line integrated intensities were within
the errors. To corroborate this assumption, as a second step, we removed the lines that
were severely blended (difference in frequency less than 4 MHz) and kept only those that
were isolated or partially blended. In the end we had only eight transitions and derived
 K. The higher rotation temperature was due to the suppression of the lines at 221 199,
221 394, 221 403, and 221 422 MHz. The obtained value was still in agreement with our
previous fit within the errors. We were worried because the velocity integrated line
intensities of the transitions with Erot> 400 K
(221 059, 221 210 MHz) present large uncertainties. In order to check the robustness of
our temperature estimate, we make a new least squares fitting without these lines. This
fit provided a lower limit to the rotation temperature of
K. The higher rotation temperature was due to the suppression of the lines at 221 199,
221 394, 221 403, and 221 422 MHz. The obtained value was still in agreement with our
previous fit within the errors. We were worried because the velocity integrated line
intensities of the transitions with Erot> 400 K
(221 059, 221 210 MHz) present large uncertainties. In order to check the robustness of
our temperature estimate, we make a new least squares fitting without these lines. This
fit provided a lower limit to the rotation temperature of
 K. Again the value obtained for the rotation temperature is in agreement with that shown
in Table 2 within the errors. Therefore, we decided
to keep the estimate shown in Table 2 as a good
value for the average rotation temperature, although we are aware that, more likely, we
have strong temperature gradients across the hot core with temperatures varying between
~250 K and ~600 K.
K. Again the value obtained for the rotation temperature is in agreement with that shown
in Table 2 within the errors. Therefore, we decided
to keep the estimate shown in Table 2 as a good
value for the average rotation temperature, although we are aware that, more likely, we
have strong temperature gradients across the hot core with temperatures varying between
~250 K and ~600 K.
The results from the CH3CN ν = 0 rotational diagram are shown in Table 2. We obtained a higher rotational temperature in ν = 0 than in ν8 = 1. One could think that the high temperature in the ground vibrational state was an artifact due to the missing flux in the low K components of the CH3CN 12K → 11K ladder. However, comparison of the interferometric PdBI and single-dish 30 m observations showed that the spatial filtering is not important and therefore this possibility was discarded. An alternative explanation is that the ground state vibrational lines are optically thick. The opacity can be derived by comparing the CH3CN and CH313CN lines (the lines of the other 13C isotopologue 13CH3CN are outside the observed frequency range). Unfortunately, the CH313CN 120 → 110 and 121 → 111 lines are blended with those of the main isotopologue. The lowest K transition without any obvious contamination is K = 4 (220 571 MHz) where we have a feature with Tb ~ 0.39 K (with an uncertainty of 25% because of partial blending with other lines). Comparing with the main isotopologue, we have I(CH3CN 124→ 114)/I(CH313CN 124 → 114) ~ 7, which implies opacities of ~10 in the main isotopologue line. Since the line opacities are very high, the rotational diagram analysis is not valid and the resulting rotation temperature in the ground state is severely over-estimated. Instead, we derived the CH3CN column density assuming Trot = 405 K (the same as in the ν8 = 1 vibrational level) and an opacity of ~10 for the CH3CN 124 → 114 line and obtained N(E-CH3CN) = N(A-CH3CN) = 2.6 × 1018 cm-2, i.e., a total (A+E) CH3CN column density of 5.2 × 1018 cm-2. With these parameters, we fit the high energy rotational lines with a source size of ≈0.07″ (125 AU). The uncertainty in the source size comes from the assumed rotation temperature. By varying the rotation temperature between 250 K and 600 K we would obtain sizes of 100−160 AU. We note that these sizes are quite small, similar to typical scales of circumstellar disks.
This compact source model successfully predicted the intensities of the high excitation
lines, but the intensities of the low-energy transitions were severely underestimated. The
only way to fit the whole spectrum was to consider a two-component model: (i) the compact
component described above; and (ii) a more extended second component that is filling the
beam. We fit the K< 4 lines with
N(E-CH3CN) = N(A-CH3CN) = 2.5 ×
1014 cm-2 and Trot = 350 K for this extended
component. We tried with a temperature of 250 K obtained from the fitting of the
Erot< 400 K
ν8 =
1 lines, but this lower temperature would overestimate the
K = 0 and
K = 1
lines. Furthermore, the assumed value is within the uncertaintly of this fit
(=250 K).
K).
Our estimate of the total methyl cyanide column density relies on the 13C isotopologue line. Of course there is also the possibility that the CH313CN 124 → 114 line is contaminated by another line and its real intensity is lower. We did not find any good candidates at this frequency. One line of EA-(CH3)2CO is very close in frequency, but the emission of this line is very weak (see also Sect. 4.7). Furthermore, the small sizes derived for other species (see following sections) prompted us to consider the two-component model as the most likely one. We would also like to point out that we refer to a beam filling component at the spatial resolution of our observations (~1900 AU) as “extended component”. This component would not encompass the entire envelope.
We also looked for the deuterated compounds in our spectrum. The most abundant species CH2DCN and CHD2CN have no intense lines in the observed frequency range. Only CD3CN has three intense transitions at 219.965, 219.983, and 219.993 GHz. We have detected the three lines but need a very low rotation temperature, Trot = 40 K, to fit them. Because of this surprisingly low rotation temperature, we consider that a misidentification is possible and keep the derived column density as an upper value to the real one. Several weak lines of CH3NC were identified, a molecule so far only detected towards Sgr B2 (Cernicharo et al. 1988). Unfortunately, most of them are blended or partially blended. Assuming that CH3NC is coming from the CH3CN compact core, we calculated a CH3NC column density of 1.5 × 1016 cm-2, i.e., about 350 times lower than that of CH3CN. Since we have only one unblended line, we keep this detection as tentative.
4.2. Isocyanic acid: HNCO, HN13CO
The HNCO lines are well fitted with  K and N(HNCO)
= 1.6 × 10¹⁵
cm-2 (see Fig.
2 and Table 2). In our frequency range, most of the lines of HN13CO are blended with those of
the main isotopologue and so we cannot estimate the line opacities. Comparing this with
the 30 m spectrum, we calculated that the interferometer is missing about 20% of the flux
of the low energy lines, showing that there is an extended component. For this reason, we
adopt the beam filling solution. We looked for the isomer HCNO and the deuterated compound
DNCO, but unfortunately they do not have intense transitions in the sampled frequency
range.
K and N(HNCO)
= 1.6 × 10¹⁵
cm-2 (see Fig.
2 and Table 2). In our frequency range, most of the lines of HN13CO are blended with those of
the main isotopologue and so we cannot estimate the line opacities. Comparing this with
the 30 m spectrum, we calculated that the interferometer is missing about 20% of the flux
of the low energy lines, showing that there is an extended component. For this reason, we
adopt the beam filling solution. We looked for the isomer HCNO and the deuterated compound
DNCO, but unfortunately they do not have intense transitions in the sampled frequency
range.
4.3. Methyl formate: A-CH3OCHO, E-CH3OCHO
We detected more than sixty lines of A-CH3OCHO and E-CH3OCHO in our spectrum, both in the vt =
0,1 vibrational states, the latter at
Evib =
188.40 K. We tried to fit a rotational diagram to each vibrational
state separately in order to measure the rotation and vibrational temperatures
independently, but this was not possible. The dynamical range of Eu within each
vibrational level is very small and the uncertainties in the integrated intensities are
too large to obtain a good fit. However, we could get a reasonable fit by considering the
two vibrational levels together (see Table 2). We
measured  K, slightly lower than that of CH3CN, but still in good agreement taking into account the
associated uncertainties. We fixed the temperature and varied the source size to fit the
lines. The best fit was obtained with a size of ~0.1″.
Even with this small size, the opacities of the CH3OCHO ν = 0 lines are always
≤1.3 suggesting that our
estimate of the rotation temperature is reliable. Unfortunately, the lines of the
13C isotopologues
are blended with other species and it was not possible to have an estimate of their column
densities. We used a weak feature at 128.952 GHz to derive an upper limit to the total
column density of 13CH3OCHO of <3.0 × 1017 cm-2 in the ~0.1″
core, which would imply an upper limit to the total (A- +E-) main isotopologue column
density of <2.0 × 1019 cm-2 assuming 12C/13C = 65. This allows us to say that the methyl formate
column density is accurate within a factor of 4. When considering deuteration, we have
three detected lines at 219 242 MHz, 218 730 MHz, and 219 132 MHz that would correspond to
CH3OCDO and
CH2DOCHO. The
first two lines are blended with lines of EE-(CH3)2CO which makes the derived deuterium fraction more
uncertain. Taking into account the contribution of acetone, we fitted the intensities of
the three lines assuming a deuterium fraction of ~0.06.
K, slightly lower than that of CH3CN, but still in good agreement taking into account the
associated uncertainties. We fixed the temperature and varied the source size to fit the
lines. The best fit was obtained with a size of ~0.1″.
Even with this small size, the opacities of the CH3OCHO ν = 0 lines are always
≤1.3 suggesting that our
estimate of the rotation temperature is reliable. Unfortunately, the lines of the
13C isotopologues
are blended with other species and it was not possible to have an estimate of their column
densities. We used a weak feature at 128.952 GHz to derive an upper limit to the total
column density of 13CH3OCHO of <3.0 × 1017 cm-2 in the ~0.1″
core, which would imply an upper limit to the total (A- +E-) main isotopologue column
density of <2.0 × 1019 cm-2 assuming 12C/13C = 65. This allows us to say that the methyl formate
column density is accurate within a factor of 4. When considering deuteration, we have
three detected lines at 219 242 MHz, 218 730 MHz, and 219 132 MHz that would correspond to
CH3OCDO and
CH2DOCHO. The
first two lines are blended with lines of EE-(CH3)2CO which makes the derived deuterium fraction more
uncertain. Taking into account the contribution of acetone, we fitted the intensities of
the three lines assuming a deuterium fraction of ~0.06.
4.4. Ethyl cyanide: CH3CH2CN
The detection of eight lines of CH3CH2CN strongly confirms the identification of this species. Although three of them are heavily blended, the other five lines are sufficient to identify this species. The lines belong to the ground state and to the lowest energy vibrational states at Evib = 297.12 K (Daly et al. 2013). We tried to fit the rotational diagram, but unfortunately the points did not follow a clear pattern and we could not determine the rotation temperature. Hence, we fixed the rotation temperature to a value of 200 K (a reasonable value from the rotational temperatures measured with the other species; see Table 2) and fitted the column density. A beam averaged column density value of 5.2 × 1014 cm-2 was derived from the intensity of the most intense lines. The fit improved assuming that the emission comes from a compact source with a diameter of ~0.1″, because some lines become optically thick. This is the solution we finally adopted (see Table 3). We searched for the lines of the 13C isotopologues and the deuterated species, but the lines were too weak to obtain a significant upper limit to their column densities.
4.5. Methanol: A- and E-CH3OH, A- and E- 13CH3OH, CH2DOH
Only five lines of methanol (including the A- and E- species and their vibrational
states) were detected and their intensities were not consistent with LTE. This is not
unexpected since the emission of the low energy lines is optically thick and extended (see
Table 1). We searched for the lines of
13CH3OH and the deuterated species CH2DOH. Ten lines of
CH2DOH were
detected. We removed from our fit the lines that could be blended with other more intense
lines and we still kept four clean lines that allowed us to derive the results shown in
Fig. 2 and Table 2. The rotation temperature of CH2DOH, ~157 K is lower than that of CH3CN, suggesting that it arises from a different region
within the hot core. Based on the different spatial distribution of the high excitation
and low excitation lines of methanol, FU05 proposed the existence of two components: a hot
component towards the hot core and a colder component that extends along the outflow
direction. Although the two components are expected to contribute to the total
CH2DOH emission,
its low rotation temperature suggests that it is dominated by the extended one.
K is lower than that of CH3CN, suggesting that it arises from a different region
within the hot core. Based on the different spatial distribution of the high excitation
and low excitation lines of methanol, FU05 proposed the existence of two components: a hot
component towards the hot core and a colder component that extends along the outflow
direction. Although the two components are expected to contribute to the total
CH2DOH emission,
its low rotation temperature suggests that it is dominated by the extended one.
For 13CH3OH, we detected two lines of the νt = 0 vibrational state (220 323 and 221 282 MHz) and one (221 424 MHz) of the νt = 1 state. Although the emissions of the low energy lines of the main isotopologue are extended (see Table 1), we considered that the emissions of the 13-methanol lines come mainly from the compact source. The line at 220 323 MHz is heavily blended and cannot be used to estimate the 13-methanol column density. Using the other two lines we fitted a vibrational/rotation temperature of ~238 K and a total 13CH3OH νt = 0,1 column density of 5.3 × 1018 cm-2. In order to estimate the uncertainty in our estimate of the 13-methanol column density, we repeated the fit by fixing the rotation temperature to 200 K and 400 K. The derived column densities are 3.0 × 1018 cm-2 and 6.1 × 1018 cm-2, respectively, which suggests that our estimate of the 13C-methanol column density is accurate within a factor of 2.
Since the CH3OH lines are optically thick, we derived the methanol column density from 13CH3OH assuming that all the 13CH3OH emission comes from the compact component and 12C/13C = 65. Then we added an extended component to fit the rest of lines. The value obtained for the CH3OH column density in the extended component is not reliable because the intensities of the main isotopologue lines are affected by spatial filtering and opacity effects. Moreover, the separation of the methanol emission in these two components is model-dependent since we fixed the size of the compact core in our calculations. The beam average CH3OH column density derived from 13CH3OH is, however, reliable as long as the 13C-isotopologue is optically thin regardless of the detailed spatial distribution of methanol within the observational beam. For this reason, we used this value to calculate the deuterium fraction, [CH2DOH]/[CH3OH] = 0.02. This is an average value within the hot core.
4.6. Trans- and gauche-ethanol: T- and G-CH3CH2OH
We detected six ethanol lines which includes four from T-CH3CH2OH and two from the G conformer that is at 60 K above the T state. However, only three lines are clearly detected (at 218 554, 218 655, and 220 155 MHz) since the other are significantly blended with transitions from other species or U lines. Because of this, we could not apply the rotational diagram technique. Instead, we assumed a rotation temperature of Trot = 200 K, and derived the column densities using the most intense lines. We assumed a size of ~0.1″ to more accurately fit the data published by FU05 (see Sect. 5). The results are shown in Table 3.
4.7. Acetone: AA-(CH3)2CO, AE-(CH3)2CO, EA-(CH3)2CO, EE-(CH3)2CO
Several lines of acetone were detected in our spectrum (218 773, 219 076, 219 220, 219 242, 219 264, 220 355, 220 466, 220 764, 220 962 MHz), the most intense being at 219 220, 219 242, and 219 264 MHz. Because many of them are blended, it is not possible to determine an accurate rotation temperature. We assumed Trot = 200 K and obtained a total (AA+EA+AE+EE) beam average column density of 1.0 × 1015 cm-2.
4.8. Formaldehyde: H2CO
Three lines of p-H2CO and one of o-H213CO were detected in the PdBI spectrum. The lines of the main isotopologue are optically thick and most of their emission has been filtered by the interferometer (see Table 1). Because of the large fraction (85%) of missing flux in the main isotopologue line, we are surely missing an extended component. As can be seen in Fig. 1, the emission of the o-H213CO is unresolved by our observations. In addition, FU05 derived a size of 0.58 ± 0.24′′× 0.40 ± 0.24′′ for the D2CO emission. Based on these results, we were able to fit all the lines of this work and FU05 with an (ortho+para)-H213CO column density of 1.1 × 1016 cm-2 and (ortho+para)- D2CO column density of 5.9 × 1015 cm-2, and a source with a diameter of 0.34″ (~426 AU ). We assume Trot = 200 K and an ortho-to-para ratio of 3.
There are no H2C18O and HDCO lines in the frequency range of our observations that we could use to further constrain our model.
4.9. Carbonyl sulfide: OCS, O13CS
NGC 7129 FIRS 2 hot core model.
The J = 19 → 18 rotational lines of the ground vibrational states of OCS and O13CS lie in the range of wavelengths covered by our observations. We measured Tb[OCS 19 → 18]/ Tb[O13CS 19 → 18 ] ~ 5. Comparing the 30 m and PdB spectra, we discarded the possibility that this low intensity ratio is a consequence of the spatial filtering. The opacity of the OCS 19 → 18 line must be very high, τ ~ 12. Assuming Trot = 200 K, we derived a OCS column density of ~ 2 × 1018 cm-2 and a source size of ≈0.32″ (400 AU), four times that derived for the compact component of CH3CN. In our spectrum, we also detected two lines of the OCS ν2 = 1 vibrational state at Evib = 748.8 K (see Table A.1). Assuming the same source size, the intensities of these lines imply a vibrational temperature, Tvib = 170 K, in agreement with the rotational temperature we assumed. The same assumptions are used to fit the OC33S J = 19 → 18 line in FU05.
4.10. Sulfur monoxide: SO, S18O
Only the intense line of SO at 219 949 MHz was detected. From its intensity and assuming Trot = 200 K, we derived a beam averaged SO column density of 2.4 × 1015 cm-2. The emission of this line is extended (see Table 1 and Fig. 1) and, most likely, optically thick. There are no lines of 34SO, 33SO, and/or S18O in the spectrum that could be used to determine the line opacity. As commented in Sect. 5 a possible detection of S18O in the spectrum published by FU05 suggests that the column density could be as much as a factor of ~600 higher (see Sect. 5 and Table 3). Unfortunately, this line is blended with other intense lines and this makes the estimate uncertain. We consider our fitted value as a lower limit to the real one.
4.11. Sulfur dioxide: SO2, 34SO2
One SO2 line at 219 276 MHz and two 34SO2 lines at 219 355 and 221 115 MHz, respectively were detected. These lines are reasonably fitted using Trot = 200 K, a beam averaged SO2 column density of 6 × 1015 cm-2 and 32S/34S = 22. The SO2 line is optically thin providing a good estimate of the total number of SO2 molecules within our beam. On the other hand, we could not estimate an accurate value of the opacity that would allow us to constrain the size of the emitting region; however, we checked that the SO2 line would be optically thin even if all the emission arises from the 0.1″ compact core.
4.12. Cyanoacetylene: HCCCN,HCCCN ν7 = 1, DCCCN, HCCNC
We detected one HC3N line at 218 325 MHz and two lines of the vibrational state ν7 = 1 at 218 861 MHz and 219 174 MHz, respectively, although the one at 219 174 MHz is blended with an intense ethanol line. In addition, we tentatively detected the H13CCCN 25 → 24 line. Unfortunately, the frequency of the H13CCCN line is close to that of the 13CO 2 → 1 line and could have some contribution from its wing. Assuming that the isotopologue line is not blended with 13CO, we fit this line with Trot = 200 K and N(H13CCCN) = 8.8 × 1014 cm-2 and a source size of ~0.20″ which implies an upper limit to the HC3N column density of <5.7 × 1016 cm-2. This value, however, overestimates the intensity of the lines of the main isotopologue, which are better fitted with N(HCCCN) = 2.0 × 1016 cm-2. We adopt this latter solution and conclude that our column density is accurate within a factor of 3. There is a weak feature at 219 490 MHz that could correspond to DCCCN J = 26 → 25. Since this line is very weak and there is no other DCCCN line in the spectrum that could confirm the detection, we will consider it as a tentative detection and use its intensity to derive an upper limit to the DCCCN column density of N(DCCCN)/N(HCCCN) < 0.016. We might have detected one line of HCCNC at 218 558 MHz, but it is blended with an intense ethanol line. Therefore, we can only derive a lower limit to the N(HCCCN)/N(HCCNC) column density ratio of >13.
4.13. Acetaldehyde: CH3CHO
Very few intense lines of CH3CHO are found in the observed wavelength range and some of them are blended with others from abundant species. We detected without blending the 220 446 MHz line of E-CH3CHO, and marginally the 221 222 MHz line of A-CH3CHO νt = 1, the 219 780 MHz line of A-CH3CHO νt = 2, and the 221 216 MHz line of E-CH3CHO νt = 2. All these lines were fitted assuming Tvib = 100 K. Making the additional assumption that Trot = Tvib, we derived a total beam averaged A+E CH3CHO column density of 4 × 1015 cm-2 in the ν = 0 ground state. In this case, the lines of the 13C isotopologue were not detected. As for other oxygenated molecules, we assumed that the source is extended relative to our beam. Although the firm detections in the 218–221 GHz frequency range are only a few, this model is fully confirmed by the good match to the data published by FU05 (see Sect. 5).
4.14. Formic acid: HCOOH
Two lines of HCOOH, one at 218 938 MHz and the other at 220 038 MHz, were detected in our spectrum. However, their line intensities were not consistent with thermalized optically thin emission. Since the two lines have very similar Eu, this discrepancy cannot be due to a wrong rotation temperature. Spatial filtering cannot be the cause of this discrepancy, because such an intense line should have been detected in the 30 m spectrum. However, the Einstein spontaneous emission coefficient, Aij, of the 220 038 MHz line is ten times lower than that of the 218 938 MHz line which results in a higher opacity of the former for the same physical conditions. We propose that the high opacity of the line at 220 038 MHz causes the anomalous line intensity ratio. The detection of H13COOH at 219 341.849 MHz also argues in favor of a high column density of HCOOH in this source. We can reasonably fit both lines of HCOOH and that of H13COOH assuming Trot = 100 K, a total HCOOH column density of 9.5 × 1018 cm-2, and a source size of ~0.1″. The profile of the H13COOH line is wider than expected (see Fig. A.2), suggesting some contribution from the outflow or partial blending with other line. Because of this possible blending, the integrated intensity of this line is uncertain by a factor of 2. We selected the solution that best fitted the 218 938 MHz line. The fit to the HCOOH line at 220 038 MHz is not perfect, but this is not worrying because our model is not adequate to reproduce the profile of very optically thick lines. The intensity of this line is not sensitive to the HCOOH column density in the range of column densities we are dealing with. Some HCOOH lines were also observed by FU05. As seen in Fig. 5, the lines are reasonably reproduced with our values. We have searched for the DCOOH and HCOOD lines in our spectrum and found one transition of HCOOD at 218 541 MHz from which we derive N(HCOOD)/N(HCOOH) ≈ 0.01 as long as both species come from the same region. Since we have only one line of HCOOD and it is at 4σ, we indicated this detection as tentative in Table 3.
4.15. Dimethyl ether: CH3OCH3
We detected four unblended lines of CH3OCH3, at 218 492, 219 301, 220 847, and 220 893 MHz. The other lines of this species are blended with intense lines. Assuming that the source is filling the beam, we derived Trot = 500 K and N(CH3OCH3) = 2 × 1016 cm-2. We considered that this apparently high rotation temperature was an opacity effect and obtained a better fit assuming Trot = 200 K, N(CH3OCH3) = 4 × 1018 cm-2 and a source diameter of 0.1″. These parameters are consistent with the non-detection of the 13C isotopologues and we adopted them.
4.16. Ethylene glycol: aGg’-(CH2OH)2, gGg’-(CH2OH)2
The aGg’ conformer of ethylene glycol, together with methyl formate, is one of those with the highest number of lines in our spectrum. We detected twelve lines, and seven were unblended. We used these seven unblended lines to derive a rotation temperature of 145 K and a beam averaged column density of N(aGg’-(CH2OH)2) = 2.3 × 1015 cm-2 (see Fig. 2 and Table 2). The line at 218 576 MHz was removed from the final fit since it was very far from the intensity traced by the other lines (see Fig. 2) and is certainly blended with something else. In this case, we did not have information about the transitions of the 13C-isotopologues and deuterated species. The emission is compatible with the beam filling assumption, although we cannot discard a smaller size.
We also searched for gGg’-(CH2OH)2 in our spectrum. We have a good match with eight lines that can be assigned to this species (218 712, 219 097, 219 389, 219 410, 220 763, 220 448, 220 887, 221 596 MHz). Modeling the spectrum, we obtain that five additional lines are also present in our data but blended with other species. However there are two lines, at 218 144 MHz and 220 249 MHz, that should have been detected and do not appear in the spectrum. These lines have similar energies to the previous ones and their absence cannot be explained with a simple excitation argument. This species has not been detected in any other source thus far. Waiting for confirmation, we do not include it in the model.
4.17. Ketene: H2CCO
We detected one o-H2CCO line at 220 177 MHz and one p-H2CCO at 221 545 MHz with similar intensity. The first transition is at Eu = 62.4 K and the second one Eu = 894.8 K. It is not possible to fit both lines assuming reasonable physical conditions and optically thin emission. One possibility is that the line at 221 545 MHz is not ketene. In this case, we can fit the other line assuming a rotation temperature of Trot = 200 K and a beam averaged ortho+para H2CCO column density of 6.7 × 1014 cm-2, where we have assumed an ortho-to-para ratio of 3. Another possibility is that the emission is optically thick in both lines. In this case, we need a ketene column density of 4.0 × 1018 cm-2 in a compact ~0.1′′ region. There is no line of the 13C isotopologue in the observed frequency range that would allow us to determine the opacities. The deuterated compounds have no intense transitions in the observed wavelength range either. We selected the optically thin case adopting a conservative approach. Taking into account the uncertainty in its column density, we do not use this species in our comparison with other sources.
4.18. Glycolaldehyde: CH2OHCHO, Formamide: NH2CHO
There are thirteen intense lines of glycolaldehyde in the sampled wavelength range. From these, six are not blended with other features and do not have any other likely identification. Assuming Trot = 200 K, we estimated a beam averaged column density of 1.0 × 1015 cm-2. Only one line of NH2CHO lies in our spectrum. It is at 218 459 MHz and is blended with a line of T-ethanol. Our fit to T-ethanol failed to predict the high intensity of the observed feature suggesting some contribution from NH2CHO. The total intensity would be consistent with a beam averaged formamide column density of 3.0 × 1014 cm-2.
4.19. Vinyl cyanide: CH2CHCN
We detected two rotational lines, at 218 675 MHz and 220 345 MHz, that could correspond to CH2CHCN. The intense line at 220 345 MHz is overlapped with one of CH3CN. Some features of the ν11 = 1 vibrational state at an energy of 328.4 K could have also been detected but are blended with other more intense lines. Since we could not determine the rotation temperature, we assumed the fixed value of Trot = 200 K and the same source size as the chemically related species CH3CN, i.e., a diameter of ~0.1″, but our fit was very bad. The relative intensities of the lines at 220 345 MHz and 218 675 MHz cannot be accounted for by LTE models. We were not able to obtain a better fit by varying the rotation temperature and/or the source size. One possibility is that the intensity of one of the lines is incorrect because of baseline uncertainties or spatial filtering. The second possibility is that our identification is false. Since we do not have a better candidate for the 220 345 MHz line, we derived an upper limit to the vinyl cyanide column density using its line intensity and fixing the rotation temperature to 200 K. This compound is quite abundant in massive hot cores (see López et al. 2014), and this upper limit is interesting for comparison with these objects.
5. The hot core model
Based on the calculations explained in Sect. 4, we propose the hot core model shown in Table 3. This model is not unique and some parameters, especially source sizes, are quite uncertain. However, it cannot be done better. Higher spatial resolution is required to better constrained the spatial structure. Fortunately, the total number of molecules in our beam is well constrained, especially when we have detected the 13C isotopologue or the emision is optically thin, which is the case for most species. Our model is self-consistent; i.e., once a molecule is included, its isotopologues and deuterated compounds are also included. For isotopologues, we assume 12C/13C = 65, 16O/18O = 650, 32S/34S = 22, and 34S/33S = 6 (Chin et al. 1995; Milam et al. 2005). The column densities of the deuterated species are calculated independently to determine the deuterium fractions. When possible we directly compare the deuterated compound with the 13C isotopologue, which is expected to have similar fractional abundance, in order to avoid opacity effects in the derived column density ratio. The obtained values of deuterium fractions are ~0.06 for methyl formate, ~0.02 for methanol, ~0.008 for the doubly deuterated formaldehyde, ~0.01 for DC3N, and <0.01 for HCOOD (see Table 3). These are average values in the hot core since the hydrogenated and deuterated species could have different spatial distributions. Using MADEX, we have synthesized the total spectrum assuming LTE, the parameters shown in Table 3 and convolving with a circular beam of ~1.4″. The obtained spectrum is compared with observations in Fig. A.1. Our fit is reasonably good taking into account the simplicity of our model. There are, however, two frequency ranges, 218.0–219.12 GHz and 221.46–221.62, where the agreement is poor. One reason is possible observational errors. We note that the second region is at the end of the observed frequency range where the passband calibration is more uncertain, but the existence of intense U lines suggests the existence of a population of COMs that have not been identified yet.
An important test for our model is to reproduce the interferometric observations published by FU05 with a higher angular resolution of 0.63″ × 0.46″. We synthesized the spectrum assuming the same parameters as in Table 3 but convolving with a smaller beam, ~0.52″, and compared with FU05 observations (see Fig. A.5). We find a remarkably good agreement for most of the species which confirmed that our model was not far from reality.
We identified the line at 231 143 MHz in FU05 as H CS
providing an estimate of the H2CS abundance in the hot core (see Table 3). However, we have only one line of the 13C isotopologue and the
identification could be wrong. A similar situation occurs for S18O. We have detected one line at
228 272 MHz, but it is blended with intense CH3OCHO and CH3OCOD features. From this line we estimate a
S18O column density
of 8 × 10¹⁵
cm-2 within the
~0.52″ (~650 AU) beam. Because of the blending, this estimate is model-dependent
and suffers from larger uncertainty.
CS
providing an estimate of the H2CS abundance in the hot core (see Table 3). However, we have only one line of the 13C isotopologue and the
identification could be wrong. A similar situation occurs for S18O. We have detected one line at
228 272 MHz, but it is blended with intense CH3OCHO and CH3OCOD features. From this line we estimate a
S18O column density
of 8 × 10¹⁵
cm-2 within the
~0.52″ (~650 AU) beam. Because of the blending, this estimate is model-dependent
and suffers from larger uncertainty.
An important discrepancy between our model and FU05 observations comes from G+ethanol. There are two predicted G+ethanol lines, 228 491 MHz and 228 560 MHz that do not appear in the FU05 spectrum while all the T−ethanol lines are correctly reproduced. One possibility is that we have a lower kinetic temperature than assumed since the G+ethanol is 60 K higher in energy than T−ethanol. But the temperature would have to be unreasonably low, <50 K, to reproduce the observations.These lines are close to the edge of the spectral band and could suffer from some instrumental effects.
Comparison of rotation temperatures between hot cores and hot corinos.
In Table A.2 we give a list with our new identifications of the data published by FU05. In this work we have identified more lines and found some misidentifications. The lines previously identified as c-C3D are instead carried by CH3CHO. In fact, CH3CHO is the carrier of most of the lines in the band centered at 231.3 GHz. We have a handful of lines around the 13CS frequency without any plausible identification. One possibility is that we are observing high velocity gas emitting in the 13CS 5 → 4 line, but this would imply an outflow with velocities as high as 50 km s-1. We have not seen such high velocities in the CO single-dish and interferometric spectra (Fuente et al. 2001, FU05). Therefore, we think that there are still some unidentified lines at these frequencies. The intense lines at 228 307 MHz, 228 363 MHz, 228 427 MHz, and 228 467 MHz, although identified, are poorly reproduced by our model. We have not found any simple way to improve the agreement between our model and observations. Either these lines are far from the LTE approximation or we are still missing important species. Additional observations could help to discern their origin.
The observations presented in this paper have significantly contributed to the understanding of the spectra published by FU05 proving that observations in a large range of frequencies are needed for the correct line identification.
6. Discussion
6.1. Physical conditions
It is known that hot cores are heterogenous objects where different species come from different regions with different physical conditions (see, e.g., Beuther et al. 2011; Brouillet et al. 2013; Bell et al. 2014). For this reason, we only compare rotation temperatures measured with the same molecular species.
Methyl cyanide is easily thermalized for the densities prevailing in hot cores and hence a good thermometer of the molecular gas. The rotational diagram shows that the temperature in the FIRS 2 hot core is ≈400 K. This temperature is similar to that measured in massive hot cores. Beuther et al. (2011) proposed the existence of a warm component of 600 ± 200 K in the Orion hot core based on submillimeter CH3CN lines as observed with the Submillimeter Array (SMA). More recently, Bell et al. (2014) estimated a rotation temperature of ~220 K towards IRc2 and ~400 K in the hot spot located ~14″ NE using data from the 30 m telescope. Lower temperatures, however, are found in hot corinos. Bisschop et al. (2008) derived an upper limit of <390 K in IRAS 16293-2422 A and B based on interferometric SMA data. Fuente et al. (2009) derived a rotation temperature of 97 ± 25 K in the hot core located in the IM protocluster IC 1396 N. A similar rotation temperature, ~100 K, was derived by Sánchez-Monge et al. (2010) in the hot core associated with IRAS 22198+6336. Although the luminosity of FIRS 2 is similar, our observations suggest the existence of a warmer gas component (~400 K) in FIRS 2 than in IC 1396 N and IRAS 22198+6336. IC 1396 N is a protocluster with three young stellar objects (YSOs). Although the total luminosity is similar to that of FIRS 2, the luminosity of each YSO is lower and probably closer to that of an Ae star, i.e., <100 L⊙. IRAS 22198+6336 is morphologically similar to FIRS 2. Sánchez-Monge et al. (2010) detected only the K lines with Eu = 100 − 300 K, while we used lines with Eu> 600 K in this study. It is possible that a warmer component remains hindered in IRAS 22198+6336 and would require higher sensitivity observations of transitions with higher Eu to be detected. In fact, FU05 determined a gas temperature of 50−100 K in FIRS 2 from lower sensitivity observations of the CH3CN 5K → 4K ladder, from lines with Eu = 13−154 K.
The rotational diagrams of the oxygenated species give lower rotation temperatures than with CH3CN. We derived rotation temperatures between 100 K and 200 K from the CH2DOH, CH3CHO, and aGg’-(CH3OH)2 lines and between 200 K and 300 K from CH3OCHO and HNCO. Palau et al. (2011) derived rotation temperatures of ~100−150 K in the IM hot cores in IRAS 22198+6336 and AFGL 5142 from the ethanol lines. Rotation temperatures of around 100 K are also derived in Orion from CH3OCH3, methyl formate, deuterated methanol, and OCS (Tercero et al. 2010; Peng et al. 2012; Brouillet et al. 2013). Therefore, we do not detect significant differences between the rotation temperatures measured with these O-bearing species between IM and massive hot cores. Lower rotation temperatures, ~50 K, are measured with CH3OCHO in IRAS 16293-2422 (Pineda et al. 2012).
Average fractional abundances.
In Table 4, we show a summary of the rotation temperatures derived from different molecules and for different hot cores. The comparison is not totally fair since CH3CN and the O-bearing molecules could come from different regions. This is the case of IRAS 16293-2422, where CH3CN comes mainly from the southern component (A) and the O-bearing molecules from the northern one (B) (Bisschop et al. 2008). As commented above, different regions are associated with O- and N-bearing molecules in Orion. Towards the other hot cores, the spatial resolution provided by the existing observations is lower, preventing us from resolving regions with different chemistries. Nevertheless, it seems that there is a weak trend with the maximum gas temperature increasing from low to massive hot cores as measured with CH3CN. There is no trend for the O-bearing molecules.
This suggests a scenario in which the O-bearing molecules are more abundant in extended regions with temperatures ~100 K in both hot cores and corinos. Instead, CH3CN probes the hottest region of the core, and its rotation temperature increases with the luminosity. Of course, there is a problem with the spatial scales that are different for low-mass and massive stars, but, taking into account that massive stars are more distant, this would favor the interpretation of higher temperatures in the massive stars. Therefore, within the limitations of our analysis, we can conclude that there is a trend of increasing temperature from hot corinos to massive hot cores. This trend is not so clear between IM and massive stars. As we have already discussed, there is no obvious difference between FIRS 2 and Orion.
Comparison between FIRS 2 and Orion KL.
Another important parameter is the total amount of gas in the hot core. One possibility is to calculate it from the dust continuum emission assuming a dust temperature and a dust emissivity value. FU05 adopted a dust temperature of Tdust = 100 K and κν = 0.015 (1300/λ (μm)) cm2 g-1 and derived a total gas+dust mass of 2 M⊙ in the hot core FIRS 2. More recently, Palau et al. (2013) derived a similar value (1.8 M⊙) assuming Tdust = 50 K and κ1.3 mm = 0.00899 cm2 g-1. Our results suggest that at least a fraction of the dust must be at Tdust = 400 K. Assuming Tdust = 400 K and κ1.3 mm = 0.01 cm2 g-1, we obtain a lower limit to the gas+dust mass of 0.46 M⊙. Therefore, the total gas+dust mass of the FIRS 2 hot core is uncertain in a factor of ~4. In Table 5 we show the average molecular abundances in a region of 1.4″ assuming M = 1.8 M⊙ and 0.46 M⊙ for the hot core mass, respectively. When detected, we used the 13C isotopologue to determine the total average molecular column density which is more reliable. As discussed in Sect. 4, the uncertainties in the molecular column densities would add an error of a factor ≤4−5 to these values.
6.2. Comparison with the Orion hot core
The hot core associated with FIRS 2 is extraordinarily rich in complex molecules. We have detected glycolaldehyde and tentatively formamide; these compounds had only been detected in a few objects thus far. Glycolaldehyde was detected in Sgr B2 (Hollis et al. 2000; Halfen et al. 2006; Requena-Torres et al. 2008), the massive hot core G31.41+0.31 (Beltrán et al. 2009) and more recently towards the hot corino IRAS 16293-2422B (Jorgensen et al. 2012; Zapata et al. 2013). Formamide has been detected in Orion (Motiyenko et al. 2012), Sgr B2 (Belloche et al. 2013), a handful of massive prototypical hot cores (Adande et al. 2013), and IRAS 16293-2422 (Kahane et al. 2013). In Fig. A.1, we compare the FIRS 2 spectrum with that of the Orion hot core as observed with the 30 m telescope (Tercero et al. 2010). Surprisingly, there is a good match between the spectra, in number of lines and relative line intensities, suggesting that both hot cores have similar chemical characteristics. Of course, this is a qualitative comparison and we need to put it on quantitative grounds to establish firm conclusions.
In Table 6 and Fig. 3 we compare the molecular column densities in FIRS 2 and Orion KL. For this comparison, in FIRS 2, we have used the average column densities in a region of 1.4″. The reason is that the sizes of the emitting regions are not determined for most of the species (see Table 3). One needs to know the rotation temperature and the line opacities independently, to be able to determine the source size. In many cases we have not detected the 13C isotopologue that would allow us to derive the line opacities. In others, the number of unblended lines is not sufficient to determine the rotation temperature and we had to assume a reasonable value. On the contrary, the number of molecules per beam is a quite well determined parameter as long as the emission is optically thin which is a reasonable assumption for many complex species. When detected, we used the 13C isotopologue to determine the total average column density.
Towards Orion KL, the molecular emission is formed of four physically different components: hot core, plateau, compact ridge, and extended ridge. The plateau has a chemistry characteristic of a shocked region and is considered to be associated with the shocks produced by a past eruptive episode. The extended ridge is the parent cloud that hosts the cluster of young stars. The compact ridge is a small (~15″) U-shaped feature that is characterized as being very rich in complex O-bearing molecules. The hot core is a very compact source (6″–10″) particularly rich in complex N-bearing molecules. We cannot resolve different regions within the FIRS 2 hot core; therefore, we consider that the FIRS 2 hot core is comparable to the hot core (HC) and the compact ridge (CR) Orion components together. In Table 6 we show the average column densities of the HC+CR Orion components in a region of 15″. To estimate this value, we have summed up the column densities of the HC and CR weighted by their respective filling factors: 0.44 for HC (assuming a size of 10″) and 1 for the CR. When possible, we used the 13C isotopologues to determine the Orion column densities (see Table 6). We assume 12C/13C = 50 for Orion (Comito et al. 2005; Tercero et al. 2010). Some authors, like Neill et al. (2013) and Comito et al. (2005) used a size of 10″ for the CR. We have multiplied their column densities by 0.44 to account for the different adopted source sizes. For CH3CHO we have adopted the value of Turner (1991). This author did not distinguish among the different Orion components (hot core, plateau, compact ridge, and extended ridge) and we have taken the total value. For this reason this point is drawn as an empty circle in Fig. 3. In the case of D2CO, Turner (1990) assumed a source size of 15″ × 25″ that is consistent with ours.
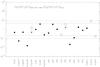 |
Fig. 3 Comparison of the molecular abundances in FIRS 2 and the Orion hot core (see Table 6). All the molecular abundances have been normalized to that of CH3OH. Black horizontal lines indicate the loci of the FIRS 2 values that differ by less than a factor of 5 from those of Orion. Red lines indicate the same but for a factor of 10. Empty circles indicate doubtful values. |
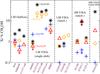 |
Fig. 4 Abundance of complex organic molecules relative to CH3OH for different types of sources, after Öberg et al. (2011): from left to right, low-mass outflows, low-mass YSOs observed with single-dish (tracing envelopes), low-mass YSOs observed with interferometers (tracing the inner envelope/disk at ~500 AU spatial scale), intermediate-mass YSOs observed with interferometers (also at 500 AU spatial scale, this work and Palau et al. 2011), and Orion (references in Table 6). Symbols with cold colors correspond to HCO-rich molecules (black: CH3OCHO; blue: CH3CHO), and symbols with warm colors correspond to CH3/2-rich molecules (orange: CH3OCH3; red: CH3CH2OH). |
In Fig. 3 we compare the column densities of FIRS 2 and Orion normalized to methanol. Normalization is required if one wants to compare the relative abundances of the different species in the warm gas. Methanol is commonly used to make this kind of normalization in hot cores (Öberg et al. 2011). Instead we could have used methyl cyanide for the normalization but we would have obtained essentially the same trend. As is clearly seen in Table 6, it would simply produce an increase in all the ratios by a factor of 2.
Most of the relative molecular abundances in FIRS 2 agree with those in Orion within a factor of 5, which is quite good taking into account the uncertainty due to the unknown spatial structure of the molecular emission and opacity effects. Only a few molecules have abundances significantly different in both hot cores: CH3OCHO, CH3CH2CN, HNCO, and SO2 have fractional abundances more than 10 times lower in FIRS 2 than in Orion. In the case of CH3OCHO, we have not detected the 13C isotopologues in FIRS 2 and our column density could be slightly underestimated. As discussed in Sect. 4.3, our estimate is accurate within a factor of 4. Increasing the methyl formate by a factor of 4 would push the methyl formate back to the region within the two black lines in Fig. 3, although still in the lower end. In the case of HNCO, the lines of the main isotologue are blended with those of the 13C isotopologue preventing us from a direct estimate of the line opacities. Looking at the top of the figure, there is a group of molecules that are more abundant in FIRS 2 by more than a factor of 4−5. These molecules are CH2DOH, D2CO, and CH3CHO. As commented above, the value of CH3CHO in Orion is uncertain. However, the differences observed in CH2DOH and D2CO could be significant. In the following section, we discuss possible scenarios to explain these differences.
6.3. Sequential formation of complex molecules in hot cores/corinos
Although gas phase reactions can play a role, surface chemistry dominates the formation of COMs. The large sensitivity of surface chemistry on physical parameters, especially the dust temperature, can also explain the observed chemical differentiation within a hot core and among different hot cores. For example, Caselli et al. (1993) found that complex N-bearing species are more easily formed if the dust temperature (Tdust) is about 40 K during the collapse phase. This is primarily due to the higher mobility of carbon and the shortage of hydrogen (H, H2) on the grain surfaces. A similar argument has been used by Öberg et al. (2011) to explain the over-abundance of CH2/3-rich molecules in hot cores and corinos compared with molecular ouflows. Öberg et al. (2011) studied a number of cores associated with outflows, low-mass cores observed with single-dish telescopes (tracing envelopes at ~5000 AU spatial scales), low-mass cores observed with interferometers (tracing warmer material at ~500 AU), and an average of high-mass hot molecular cores from Bisschop et al. (2007), and they found that HCO-rich molecules are in general more abundant than CH3/2-rich molecules in outflows and envelopes of low-mass YSOs, while the situation is reversed for low-mass inner envelopes/disks and high-mass YSOs. They proposed a sequential formation of complex molecules, starting with HCO-rich molecules as long as CO ice is abundant, followed by CH3/2-rich molecules at higher ice temperatures.
In Fig. 4 we present an updated version of the figure by Öberg et al. (2011) complemented with abundances of three intermediate-mass hot cores observed with interferometers (at ~500 AU scales, from this work and Palau et al. 2011), and the new Orion data. In the figure, symbols in warm colors (orange, red) correspond to CH3/2-rich molecules, while symbols in cold colors (blue/black) correspond to HCO-rich molecules. Our new results for the intermediate-mass hot core FIRS 2 are in line with previous measurements towards IM hot cores at disk-scales (~500 AU). Putting all these data together, we do not find a clear trend for the abundances of the CH3/2-rich and HCO-rich molecules with the stellar mass. Considering only interferometric observations, the CH3CHO abundance seems to decrease with the stellar mass. However, the abundance of methyl formate, the only other HCO-rich molecule considered, is larger in Orion than in IM hot cores and hot corinos. Orion is the only source in which we have been able to use the 13C isotopologue to derive the methyl formate abundance. If the methyl formate lines were typically optically thick in hot cores/corinos, this would have produced an underestimate of the CH3OCHO abundance in the rest of objects. Using the upper limit to the emission of the 13C isotopologue, we have estimated that the methyl formate abundance in FIRS 2 is accurate within a factor of 4. Even considering an uncertainty of a factor of 4 in the CH3OCHO abundances towards low-mass and IM YSOs, the [CH3OCHO]/[CH3OH] ratio would be larger in Orion than in these objects. In addition, the [CH3OCHO]/[CH3OH] ratio seems to increase from the low-mass to the IM sample. We can only compare two HCO-rich molecules in Fig. 4. Therefore we cannot know if methyl formate is a special case (see also Taquet et al. 2012). Further observations in IM and massive hot cores are required to have a deeper insight into the chemistry of this molecule and other HCO-rich species.
We have yet to discuss the deuterium fractions in FIRS 2 and Orion. Deuterated species whose deuteration requires surface chemistry, such as D2CO, present higher abundances in the warm regions associated with low-mass protostars. Loinard et al. (2003) searched for the doubly deuterated form of formaldehyde (D2CO) in a large sample of young stellar objects; D2CO was detected in all low-mass protostars, with [D2CO]/[H2CO] ratios of 2−40%. On the other hand, no detection was obtained towards massive protostars (where [D2CO]/[H2CO] < 0.5%). This is consistent with the value reported by Turner (1990) in Orion. If the hot cores associated with massive stars are older and/or significantly denser than those surrounding low-mass objects, gas phase chemistry could have had the time to reset the deuterium fractions to values close to the cosmic D/H ratio. The longer time of the evaporated molecules in gas phase would also affect the abundances of the COMs that can be formed in warm gas-phase chemistry (e.g., CH2CHCN).
An alternative explanation could be that the temperature of the envelope material
accreting onto the high-mass protostars is larger than 30 K (Fontani et al. 2002). In this
case the deuterium fractionation efficiency in the gas phase is strongly reduced before
the hot core phase as the standard H2D+ route (H +HD
→ H2D+ + H2) also starts to proceed from
left to right. Moreover, at Tdust> 30 K
there is no way that deuteration can be enhanced on the grain surfaces. The reason is that
H and D are easily evaporated before reacting on the surface (see e.g. Cazaux et al. 2011). The higher temperature during the collapse would
also affect the formation of COMs in grain mantles. As CO does not efficiently freeze out
at these values of Tdust, the formation of HCO-rich
molecules would be strongly diminished too. As commented above, methyl formate could be an
exception to this rule.
+HD
→ H2D+ + H2) also starts to proceed from
left to right. Moreover, at Tdust> 30 K
there is no way that deuteration can be enhanced on the grain surfaces. The reason is that
H and D are easily evaporated before reacting on the surface (see e.g. Cazaux et al. 2011). The higher temperature during the collapse would
also affect the formation of COMs in grain mantles. As CO does not efficiently freeze out
at these values of Tdust, the formation of HCO-rich
molecules would be strongly diminished too. As commented above, methyl formate could be an
exception to this rule.
6.4. Carbon budget
We have used the column densities shown in Table 3 to estimate the carbon gas phase budget in the FIRS 2 hot core. Apart from CO and its isotopologues, most of the carbon is locked in methanol with a total column density of ~3.4 × 1020 cm-2 in the compact component of the hot core. Taking into account the rest of molecules, the carbon column density reaches to ~4 × 1020 cm-2 in this small region. One problem in deriving absolute abundances is that we do not know the total column density of gas in the inner R< 0.05″ region. Based on higher angular resolution observations, FU05 derived a size of 0.72″ × 0.52″ for the continuum source that account for 75% of the continuum emission and a point source that contributes to 25% of the flux. Adopting this value for the fraction of continuum flux coming from the compact component of the hot core and a total gas mass of 0.46 M⊙ (see Sect. 6.1), the total column density of molecular hydrogen would be 2 × 1025 cm-2 and the fractional abundance of the carbon locked in COMs relative to H nuclei, ~1.0 × 10⁻⁵. This value is 36 times lower than the solar value of the carbon abundance (C/H ~3.6 × 10⁻⁴; Anders & Grevesse 1989) and suggests that methanol and COMs (at least those considered in this paper) are not the main reservoirs of carbon in hot cores.
It is also useful to compare methanol with C18O. Again we have the problem of the unknown spatial distribution of the C18O emission within our interferometric beam. We can derive a lower limit to the C18O abundance assuming that the emission is optically thin and fills the beam. Adopting Trot = 400 K, we derive N(C18O) = 1.5 × 1017 cm-2 and N(CO) = 9.4 × 1019 cm-2. This solution, however, is not compatible with the non-detection of the C18O 9 → 8 line by Fuente et al. (2012) and we cannot reconcile the PdBI and Herschel results by lowering the temperature down to Trot = 200 K. The optically thick solution seems more reasonable. Assuming again that the gas temperature is 400 K and that the C18O emission is optically thick (TB ≈ Trot), we derive an effective diameter of 0.15″ for the C18O emitting region. In this case, our results are compatible with the Herschel upper limit to the C18O 9 → 8 line and the column density of CO would be >1022 cm-2 in the compact component of the hot core.
7. Conclusions
The protostar FIRS 2 is probably the youngest IM protostar studied thus far and, as such, is an excellent template on which to base interpretations of other IM and massive star forming regions. The interferometric observations presented in this paper proved that this IM protostar hosts a hot core extraordinarily rich in complex molecules.The gas kinetic temperature as measured with methyl cyanide, is around 400 K, similar to that of the Orion hot core and higher than typical rotation temperatures in hot corinos. A detailed comparison of the chemistry of FIRS 2 with Orion shows that the fractional abundances of most molecules relative to that of CH3OH agree within a factor of 5, which is reasonable taking into account the uncertainties of our column density estimates. Only CH3CH2CN, HNCO, SO2, CH2DOH, D2CO, and CH3CHO present a significant disagreement; CH3CH2CN, HNCO, and SO2 are more abundant in Orion, and CH2DOH, D2CO, and CH3CHO, in FIRS 2. Since the physical conditions are similar in both hot cores, only different initial conditions (warmer pre-collapse and collapse phase in the case of Orion) and/or different crossing time of the gas in the hot core can explain this behavior. FIRS 2 is a YSO in which most of the accreting envelope still maintains an overall temperature lower than 30 K, allowing deuteration to proceed unhindered, while complex N-bearing molecules like CH3CH2CN are not efficiently formed, unlike the Orion hot core.
Online material
Appendix A
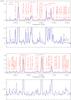 |
Fig. A.1 Comparison of the interferometric spectra towards NGC 7129 – FIRS 2 (black line)
with the single-dish spectrum of Orion KL (red line). The Orion spectra were
provided by B. Tercero and J. Cernicharo and multiplied by a factor 0.43 for an
easier comparison. The spectrum was observed towards:
|


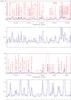 |
Fig. A.1 continued. |
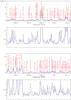 |
Fig. A.1 continued. |
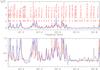 |
Fig. A.1 continued. |
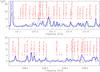 |
Fig. A.2 In blue, our synthetic spectrum superposed on the interferometric spectra published by FU05. |
Line identifications.
Line identifications (FU05).
CH3CN ν = 0 line parameters.
CH3CN ν8 = 1 (Evib = 525.17 K) line parameters.
CH3OCHO line parameters.
CH2DOH line parameters.
HNCO line parameters.
aGg’-(CH2OH)2 line parameters.
Acknowledgments
We thank the Spanish MINECO for funding support from grants CSD2009-00038, AYA2009-07304, and AYA2012-32032. D.J. is supported by the National Research Council of Canada and by a Natural Sciences and Engineering Research Council of Canada (NSERC) Discovery Grant. A.P. is supported by the Spanish MICINN grant AYA2011-30228-C03-02 (co-funded with FEDER funds), and by the AGAUR grant 2009SGR1172 (Catalonia).
References
- Adande, G. R., Woolf, N. J., & Ziurys, L. M. 2013, Astrobiology, 13, 439 [NASA ADS] [CrossRef] [Google Scholar]
- Alonso-Albi, T., Fuente, A., Crimier, N., et al. 2010, A&A, 518, A52 [NASA ADS] [CrossRef] [EDP Sciences] [Google Scholar]
- Anders, E., & Grevesse, N. 1989, Geochim. Cosmochim. Acta, 53, 197 [Google Scholar]
- Bell, T. A., Cernicharo, J., Viti, S., et al. 2014, A&A, 564, A114 [NASA ADS] [CrossRef] [EDP Sciences] [Google Scholar]
- Belloche, A., Müller, H. S. P., Menten, K. M., Schilke, P., & Comito, C. 2013, A&A, 559, A47 [NASA ADS] [CrossRef] [EDP Sciences] [Google Scholar]
- Beltrán, M. T., Codella, C., Viti, S., Neri, R., & Cesaroni, R. 2009, ApJ, 690, L93 [NASA ADS] [CrossRef] [Google Scholar]
- Beuther, H., Zhang, Q., Greenhill, L. J., et al. 2005, ApJ, 632, 355 [NASA ADS] [CrossRef] [Google Scholar]
- Beuther, H., Zhang, Q., Reid, M. J., et al. 2006, ApJ, 636, 323 [NASA ADS] [CrossRef] [Google Scholar]
- Bisschop, S. E., Jørgensen, J. K., Bourke, T. L., Bottinelli, S., & van Dishoeck, E. F. 2008, A&A, 488, 959 [NASA ADS] [CrossRef] [EDP Sciences] [Google Scholar]
- Blake, G. A., Sutton, E. C., Masson, C. R., & Phillips, T. G. 1987, ApJ, 315, 621 [NASA ADS] [CrossRef] [Google Scholar]
- Bottinelli, S., Ceccarelli, C., Neri, R., et al. 2004a, ApJ, 617, L69 [NASA ADS] [CrossRef] [Google Scholar]
- Bottinelli, S., Ceccarelli, C., Lefloch, B., et al. 2004b, ApJ, 615, 354 [NASA ADS] [CrossRef] [Google Scholar]
- Bottinelli, S., Ceccarelli, C., Williams, J. P., & Lefloch, B. 2007, A&A, 463, 601 [NASA ADS] [CrossRef] [EDP Sciences] [Google Scholar]
- Brouillet, N., Despois, D., Baudry, A., et al. 2013, A&A, 550, A46 [NASA ADS] [CrossRef] [EDP Sciences] [Google Scholar]
- Carvajal, M., Margulès, L., Tercero, B., et al. 2009, A&A, 500, 1109 [NASA ADS] [CrossRef] [EDP Sciences] [Google Scholar]
- Cazaux, S., Tielens, A. G. G. M., Ceccarelli, C., et al. 2003, ApJ, 593, L51 [NASA ADS] [CrossRef] [Google Scholar]
- Cazaux, S., Caselli, P., & Spaans, M. 2011, ApJ, 741, L34 [NASA ADS] [CrossRef] [Google Scholar]
- Cernicharo, J. 2012, in Proc. Eur. Conf. Laboratory Astrophysics, EAS Pub. Ser., eds. C. Stehlé, C. Joblin, & L. d’Hendecourt [Google Scholar]
- Cernicharo, J., Kahane, C., Guelin, M., & Gómez-Gonzalez, J. 1988, A&A, 189, L1 [NASA ADS] [Google Scholar]
- Cernicharo, J., Tercero, B., Fuente, A., et al. 2013, ApJ, 771, L10 [NASA ADS] [CrossRef] [Google Scholar]
- Chin, Y.-N., Henkel, C., Whiteoak, J. B., Langer, N., & Churchwell, E. B. 1995, VizieR Online Data Catalog [Google Scholar]
- Comito, C., Schilke, P., Phillips, T. G., et al. 2005, ApJS, 156, 127 [NASA ADS] [CrossRef] [Google Scholar]
- Daly, A. M., Bermúdez, C., López, A., et al. 2013, ApJ, 768, 81 [NASA ADS] [CrossRef] [Google Scholar]
- Demyk, K., Bottinelli, S., Caux, E., et al. 2010, A&A, 517, A17 [NASA ADS] [CrossRef] [EDP Sciences] [Google Scholar]
- Esplugues, G. B., Tercero, B., Cernicharo, J., et al. 2013a, A&A, 556, A143 [NASA ADS] [CrossRef] [EDP Sciences] [Google Scholar]
- Esplugues, G. B., Cernicharo, J., Viti, S., et al. 2013b, A&A, 559, A51 [NASA ADS] [CrossRef] [EDP Sciences] [Google Scholar]
- Fich, M., Johnstone, D., van Kempen, T. A., et al. 2010, A&A, 518, L86 [NASA ADS] [CrossRef] [EDP Sciences] [Google Scholar]
- Fuente, A., Neri, R., Martín-Pintado, J., et al. 2001, A&A, 366, 873 [NASA ADS] [CrossRef] [EDP Sciences] [Google Scholar]
- Fuente, A., Neri, R., & Caselli, P. 2005a, A&A, 444, 481 (FU05) [NASA ADS] [CrossRef] [EDP Sciences] [Google Scholar]
- Fuente, A., Rizzo, J. R., Caselli, P., Bachiller, R., & Henkel, C. 2005b, A&A, 433, 535 [NASA ADS] [CrossRef] [EDP Sciences] [Google Scholar]
- Fuente, A., Castro-Carrizo, A., Alonso-Albi, T., et al. 2009, A&A, 507, 1475 [NASA ADS] [CrossRef] [EDP Sciences] [Google Scholar]
- Fuente, A., Caselli, P., McCoey, C., et al. 2012, A&A, 540, A75 [NASA ADS] [CrossRef] [EDP Sciences] [Google Scholar]
- Halfen, D. T., Apponi, A. J., Woolf, N., Polt, R., & Ziurys, L. M. 2006, ApJ, 639, 237 [NASA ADS] [CrossRef] [Google Scholar]
- Haykal, I., Carvajal, M., Tercero, B., et al. 2014, A&A, in press, DOI: 10.1051/0004-6361/201322937 [Google Scholar]
- Hollis, J. M., Lovas, F. J., & Jewell, P. R. 2000, ApJ, 540, L107 [NASA ADS] [CrossRef] [Google Scholar]
- Johnstone, D., Fich, M., McCoey, C., et al. 2010, A&A, 521, L41 [NASA ADS] [CrossRef] [EDP Sciences] [Google Scholar]
- Kahane, C., Ceccarelli, C., Faure, A., & Caux, E. 2013, ApJ, 763, L38 [Google Scholar]
- Kolesniková, L., Tercero, B., Cernicharo, J., et al. 2014, ApJ, 784, L7 [NASA ADS] [CrossRef] [Google Scholar]
- Jørgensen, J. K., Bourke, T. L., Myers, P. C., et al. 2005, ApJ, 632, 973 [NASA ADS] [CrossRef] [Google Scholar]
- Jørgensen, J. K., Bourke, T. L., Myers, P. C., et al. 2007, ApJ, 659, 479 [NASA ADS] [CrossRef] [Google Scholar]
- Loinard, L., Castets, A., Ceccarelli, C., et al. 2003, SFChem 2002: Chemistry as a Diagnostic of Star Formation, 351 [Google Scholar]
- López, A., Tercero, B., Kisiel, Z., et al. 2007, A&A, submitted [Google Scholar]
- Marcelino, N., Cernicharo, J., Tercero, B., & Roueff, E. 2009, ApJ, 690, L27 [NASA ADS] [CrossRef] [Google Scholar]
- Margulès, L., Huet, T. R., Demaison, J., et al. 2010, ApJ, 714, 1120 [NASA ADS] [CrossRef] [Google Scholar]
- Milam, S. N., Savage, C., Brewster, M. A., Ziurys, L. M., & Wyckoff, S. 2005, ApJ, 634, 1126 [NASA ADS] [CrossRef] [Google Scholar]
- Motiyenko, R. A., Tercero, B., Cernicharo, J., & Margulès, L. 2012, A&A, 548, A71 [NASA ADS] [CrossRef] [EDP Sciences] [Google Scholar]
- Müller, H. S. P., Thorwirth, S., Roth, D. A., & Winnewisser, G. 2001, A&A, 370, L49 [NASA ADS] [CrossRef] [EDP Sciences] [Google Scholar]
- Müller, H. S. P., Schlöder, F., Stutzki, J., & Winnewisser, G. 2005, J. Mol. Struct., 742, 215 [NASA ADS] [CrossRef] [Google Scholar]
- Neill, J. L., Crockett, N. R., Bergin, E. A., Pearson, J. C., & Xu, L.-H. 2013, ApJ, 777, 85 [NASA ADS] [CrossRef] [Google Scholar]
- Neri, R., Fuente, A., Ceccarelli, C., et al. 2007, A&A, 468, L33 [NASA ADS] [CrossRef] [EDP Sciences] [Google Scholar]
- Palau, A., Fuente, A., Girart, J. M., et al. 2011, ApJ, 743, L32 [NASA ADS] [CrossRef] [Google Scholar]
- Palau, A., Fuente, A., Girart, J. M., et al. 2013, ApJ, 762, 120 [NASA ADS] [CrossRef] [Google Scholar]
- Parise, B., Castets, A., Herbst, E., et al. 2004, A&A, 416, 159 [NASA ADS] [CrossRef] [EDP Sciences] [Google Scholar]
- Peng, T.-C., Despois, D., Brouillet, N., et al. 2013, A&A, 554, A78 [NASA ADS] [CrossRef] [EDP Sciences] [Google Scholar]
- Pickett, H. M. 1991, J. Molec. Spectr., 148, 371 [NASA ADS] [CrossRef] [Google Scholar]
- Pickett, H. M., Poynter, R. L., Cohen, E. A., et al. 1998, J. Quant. Spectr. Rad. Trans., 60, 883 [Google Scholar]
- Pineda, J. E., Maury, A. J., Fuller, G. A., et al. 2012, A&A, 544, L7 [NASA ADS] [CrossRef] [EDP Sciences] [Google Scholar]
- Öberg, K. I., van der Marel, N., Kristensen, L. E., & van Dishoeck, E. F. 2011, ApJ, 740, 14 [NASA ADS] [CrossRef] [Google Scholar]
- Requena-Torres, M. A., Martín-Pintado, J., Martín, S., & Morris, M. R. 2008, ApJ, 672, 352 [NASA ADS] [CrossRef] [Google Scholar]
- Sánchez-Monge, Á., Palau, A., Estalella, R., et al. 2010, ApJ, 721, L107 [NASA ADS] [CrossRef] [Google Scholar]
- Shevchenko, V. S., & Yakubov, S. D. 1989, Sov. Ast, 33, 370 [Google Scholar]
- Taquet, V., Ceccarelli, C., & Kahane, C. 2012, A&A, 538, A42 [NASA ADS] [CrossRef] [EDP Sciences] [Google Scholar]
- Tercero, B., Cernicharo, J., Pardo, J. R., & Goicoechea, J. R. 2010, A&A, 517, A96 [NASA ADS] [CrossRef] [EDP Sciences] [Google Scholar]
- Tercero, B., Vincent, L., Cernicharo, J., Viti, S., & Marcelino, N. 2011, A&A, 528, A26 [NASA ADS] [CrossRef] [EDP Sciences] [Google Scholar]
- Tercero, B., Kleiner, I., Cernicharo, J., et al. 2013, ApJ, 770, L13 [Google Scholar]
- Turner, B. E. 1990, ApJ, 362, L29 [Google Scholar]
- Turner, B. E. 1991, ApJS, 76, 617 [NASA ADS] [CrossRef] [Google Scholar]
- Vastel, C., Phillips, T. G., Ceccarelli, C., & Pearson, J. 2003, ApJ, 593, L97 [NASA ADS] [CrossRef] [Google Scholar]
- Zapata, L. A., Loinard, L., Rodríguez, L. F., et al. 2013, ApJ, 764, L14 [NASA ADS] [CrossRef] [Google Scholar]
All Tables
All Figures
|
Fig. 1 Middle: PdBI spectrum towards the emission peak. Top and
bottom: integrated intensity maps of the most intense lines in the
portion of spectrum between 219.5 GHz and 220.7 GHz. In all the panels the contours
start and increases at steps of 3 ×
σ. Sigma and peak values in Jy/beam
× km s-1 are: 0.10, 2.47
(C18O 2–1);
0.12, 2.12 (HNCO 100–90); 0.21, 8.65 (SO 56–45); 0.22, 7.28
(13CO 2–1);
0.08, 2.20 (CH3CN 124–114); 0.11, 1.04 (HNCO 103–93); 0.12, 2.13 (HNCO
102–92); 0.11, 1.18
(H |
| In the text | |
|
Fig. 2 Results of the rotational diagrams for CH3CN ν = 0, CH3CN ν8 = 1, CH3OCHO, HNCO, CH2DOH and aGg’-(CH2OH)2. The high rotation temperature fitted to the CH3CN ν = 0 rotational diagram is the consequence of the lines being optically thick and is not considered in our modeling (see Sect. 4.1). In the rotational diagram of the CH3CN ν8 = 1 vibrational state we use different symbols for: blended lines (empty circles), isolated or partially blended lines (filled circles), and the points with Erot> 400 K (triangles). The three straight lines correspond to the least squares fittings with all the points (black), only unblended lines (red), and unblended lines with Erot< 400 K (blue). For CH3OCHO, the points corresponding to the ν = 0 lines are indicated with filled circles and νt = 1 with empty circles. The parameters of the transitions used in the rotation diagrams are listed in Tables A.3–A.8. Red points have not been used in the least squares fitting because they correspond to heavily blended lines. |
| In the text | |
|
Fig. 3 Comparison of the molecular abundances in FIRS 2 and the Orion hot core (see Table 6). All the molecular abundances have been normalized to that of CH3OH. Black horizontal lines indicate the loci of the FIRS 2 values that differ by less than a factor of 5 from those of Orion. Red lines indicate the same but for a factor of 10. Empty circles indicate doubtful values. |
| In the text | |
|
Fig. 4 Abundance of complex organic molecules relative to CH3OH for different types of sources, after Öberg et al. (2011): from left to right, low-mass outflows, low-mass YSOs observed with single-dish (tracing envelopes), low-mass YSOs observed with interferometers (tracing the inner envelope/disk at ~500 AU spatial scale), intermediate-mass YSOs observed with interferometers (also at 500 AU spatial scale, this work and Palau et al. 2011), and Orion (references in Table 6). Symbols with cold colors correspond to HCO-rich molecules (black: CH3OCHO; blue: CH3CHO), and symbols with warm colors correspond to CH3/2-rich molecules (orange: CH3OCH3; red: CH3CH2OH). |
| In the text | |
|
Fig. A.1 Comparison of the interferometric spectra towards NGC 7129 – FIRS 2 (black line)
with the single-dish spectrum of Orion KL (red line). The Orion spectra were
provided by B. Tercero and J. Cernicharo and multiplied by a factor 0.43 for an
easier comparison. The spectrum was observed towards:
|
| In the text | |
|
Fig. A.1 continued. |
| In the text | |
|
Fig. A.1 continued. |
| In the text | |
|
Fig. A.1 continued. |
| In the text | |
|
Fig. A.2 In blue, our synthetic spectrum superposed on the interferometric spectra published by FU05. |
| In the text | |
Current usage metrics show cumulative count of Article Views (full-text article views including HTML views, PDF and ePub downloads, according to the available data) and Abstracts Views on Vision4Press platform.
Data correspond to usage on the plateform after 2015. The current usage metrics is available 48-96 hours after online publication and is updated daily on week days.
Initial download of the metrics may take a while.