Fig. 4
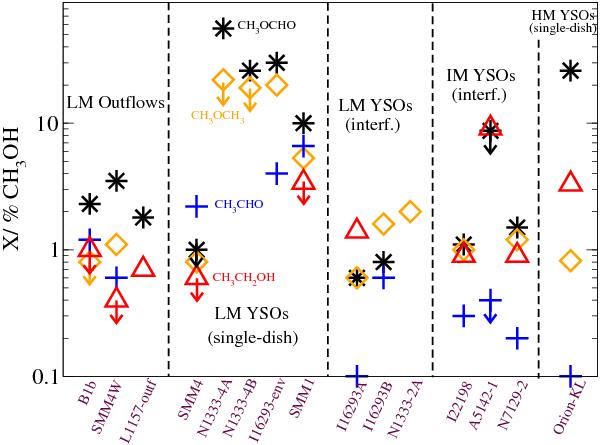
Abundance of complex organic molecules relative to CH3OH for different types of sources, after Öberg et al. (2011): from left to right, low-mass outflows, low-mass YSOs observed with single-dish (tracing envelopes), low-mass YSOs observed with interferometers (tracing the inner envelope/disk at ~500 AU spatial scale), intermediate-mass YSOs observed with interferometers (also at 500 AU spatial scale, this work and Palau et al. 2011), and Orion (references in Table 6). Symbols with cold colors correspond to HCO-rich molecules (black: CH3OCHO; blue: CH3CHO), and symbols with warm colors correspond to CH3/2-rich molecules (orange: CH3OCH3; red: CH3CH2OH).
Current usage metrics show cumulative count of Article Views (full-text article views including HTML views, PDF and ePub downloads, according to the available data) and Abstracts Views on Vision4Press platform.
Data correspond to usage on the plateform after 2015. The current usage metrics is available 48-96 hours after online publication and is updated daily on week days.
Initial download of the metrics may take a while.