Fig. 3
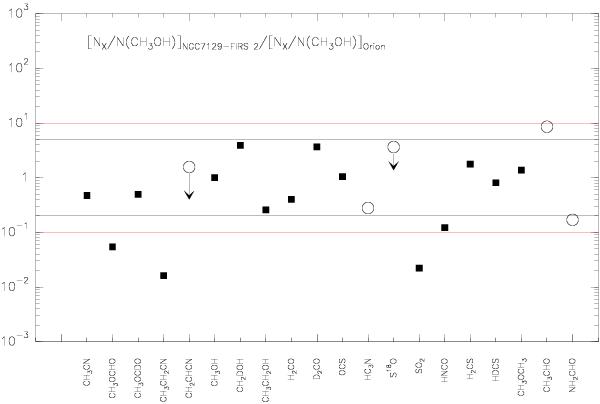
Comparison of the molecular abundances in FIRS 2 and the Orion hot core (see Table 6). All the molecular abundances have been normalized to that of CH3OH. Black horizontal lines indicate the loci of the FIRS 2 values that differ by less than a factor of 5 from those of Orion. Red lines indicate the same but for a factor of 10. Empty circles indicate doubtful values.
Current usage metrics show cumulative count of Article Views (full-text article views including HTML views, PDF and ePub downloads, according to the available data) and Abstracts Views on Vision4Press platform.
Data correspond to usage on the plateform after 2015. The current usage metrics is available 48-96 hours after online publication and is updated daily on week days.
Initial download of the metrics may take a while.