Fig. 1
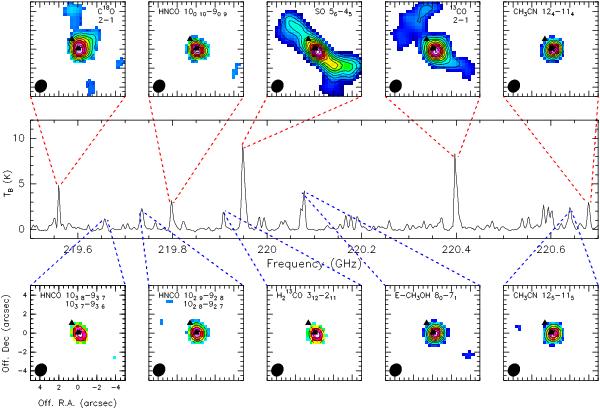
Middle: PdBI spectrum towards the emission peak. Top and
bottom: integrated intensity maps of the most intense lines in the
portion of spectrum between 219.5 GHz and 220.7 GHz. In all the panels the contours
start and increases at steps of 3 ×
σ. Sigma and peak values in Jy/beam
× km s-1 are: 0.10, 2.47
(C18O 2–1);
0.12, 2.12 (HNCO 100–90); 0.21, 8.65 (SO 56–45); 0.22, 7.28
(13CO 2–1);
0.08, 2.20 (CH3CN 124–114); 0.11, 1.04 (HNCO 103–93); 0.12, 2.13 (HNCO
102–92); 0.11, 1.18
(H CO
31,2–21,1);
0.14, 3.95 (E-CH3OH 80–71); 0.13, 2.5 (CH3CN 125–115). Filled triangles
indicate the water masers as observed with the NRAO Very Large Array (Aina Palau,
priv. comm.). The masers trace the direction of the youngest outflow (Fuente et al.
2001) that is also clearly seen in the SO
and 13CO
images. The (0, 0) position is the phase center of the interferometric observations:
CO
31,2–21,1);
0.14, 3.95 (E-CH3OH 80–71); 0.13, 2.5 (CH3CN 125–115). Filled triangles
indicate the water masers as observed with the NRAO Very Large Array (Aina Palau,
priv. comm.). The masers trace the direction of the youngest outflow (Fuente et al.
2001) that is also clearly seen in the SO
and 13CO
images. The (0, 0) position is the phase center of the interferometric observations:
 ,
,
 (J2000).
Current usage metrics show cumulative count of Article Views (full-text article views including HTML views, PDF and ePub downloads, according to the available data) and Abstracts Views on Vision4Press platform.
Data correspond to usage on the plateform after 2015. The current usage metrics is available 48-96 hours after online publication and is updated daily on week days.
Initial download of the metrics may take a while.