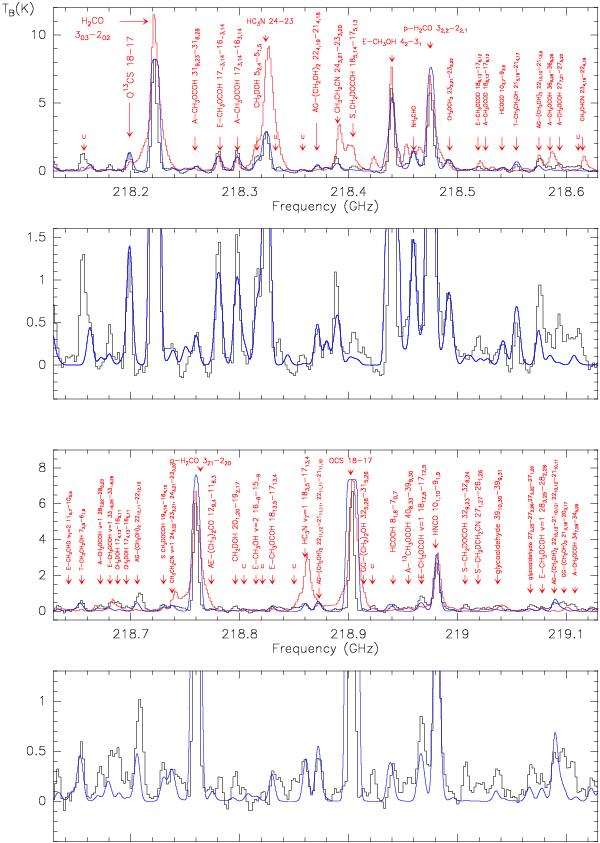
Fig. A.1

Comparison of the interferometric spectra towards NGC 7129 – FIRS 2 (black line)
with the single-dish spectrum of Orion KL (red line). The Orion spectra were
provided by B. Tercero and J. Cernicharo and multiplied by a factor 0.43 for an
easier comparison. The spectrum was observed towards:
 ,
,
 (J2000) and is centered at
a velocity of 7 km s-1. Lines are labeled in red. When several lines
are blended, only the most intense ones are indicated. The spectra synthesized
with the parameters shown in Table 3 are in blue. The intensity scale is
brightness temperature.
Current usage metrics show cumulative count of Article Views (full-text article views including HTML views, PDF and ePub downloads, according to the available data) and Abstracts Views on Vision4Press platform.
Data correspond to usage on the plateform after 2015. The current usage metrics is available 48-96 hours after online publication and is updated daily on week days.
Initial download of the metrics may take a while.


