| Issue |
A&A
Volume 567, July 2014
|
|
|---|---|---|
| Article Number | A84 | |
| Number of page(s) | 18 | |
| Section | Stellar structure and evolution | |
| DOI | https://doi.org/10.1051/0004-6361/201220872 | |
| Published online | 16 July 2014 | |
GRB 120711A: an intense INTEGRAL burst with long-lasting soft γ-ray emission and a powerful optical flash⋆
1
Space Science Group, School of Physics, University College
Dublin, Belfield,
Dublin 4, Ireland
email:
This email address is being protected from spambots. You need JavaScript enabled to view it.
2
University of North Carolina at Chapel Hill,
Campus Box 3255,
Chapel Hill
NC
27599-3255,
USA
3
APC, Université Paris Diderot, CNRS/IN2P3, CEA/DSM,
Obs. Paris, 13 rue
Watt, 75205
Paris Cedex 13,
France
4
Universe Cluster, Technische Universität München,
Boltzmannstraße 2,
85748
Garching,
Germany
5
Max-Planck-Institut für extraterrestrische Physik,
Giessenbachstrasse
1, 85748
Garching,
Germany
6
Thüringer Landessternwarte Tautenburg, Sternwarte 5,
07778
Tautenburg,
Germany
7
Department of Physics, North Carolina A&T State
University, 1601 E Market
St, Greensboro
NC
27411,
USA
8
INAF, Osservatorio Astronomico di Brera, via E. Bianchi 46,
23807
Merate,
Italy
9
Dark Cosmology Centre, Niels Bohr Institute, University of
Copenhagen, Juliane Maries Vej
30, 2100
Copenhagen,
Denmark
10
European Southern Observatory, Alonso de Córdova 3107, Vitacura, Casilla 19001,
Santiago 19,
Chile
11
INAF-IASF Bologna, Area della Ricerca CNR, via Gobetti 101,
40129
Bologna,
Italy
Received:
7
December
2012
Accepted:
2
May
2014
Abstract
A long and intense γ-ray burst (GRB) was detected by INTEGRAL on 11 July 2012 with a duration of ~115 s and fluence of 2.8 × 10⁻⁴ erg cm-2 in the 20 keV−8 MeV energy range. GRB 120711A was at z ~ 1.405 and produced soft γ-ray emission (>20 keV) for at least ~10 ks after the trigger. The GRB was observed by several ground-based telescopes that detected a powerful optical flash peaking at an R-band brightness of ~11.5 mag at ~126 s after the trigger, or ~9th magnitude when corrected for the host galaxy extinction (AV ~ 0.85). The X-ray afterglow was monitored by the Swift, XMM-Newton, and Chandra observatories from 8 ks to 7 Ms and provides evidence for a jet break at ~0.9 Ms. We present a comprehensive temporal and spectral analysis of the long-lasting soft γ-ray emission detected in the 20−200 keV band with INTEGRAL/IBIS, the Fermi/LAT post-GRB detection above 100 MeV, the soft X-ray afterglow and the optical/near-infrared detections from Watcher, Skynet/PROMPT, GROND, and REM. The prompt emission had a very hard spectrum (Epeak ~ 1 MeV) and yields an Eγ,iso ~ 1054 erg (1 keV−10 MeV rest frame), making GRB 120711A one of the most energetic GRBs detected so far. We modelled the long-lasting soft γ-ray emission using the standard afterglow scenario, which indicates a forward shock origin. The combination of data extending from the near-infrared to GeV energies suggest that the emission is produced by a broken power-law spectrum consistent with synchrotron radiation. The afterglow is well modelled using a stratified wind-like environment with a density profile k ~ 1.2, suggesting a massive star progenitor (i.e. Wolf-Rayet) with a mass-loss rate between ~10-5−10-6 M⊙ yr-1 depending on the value of the radiative efficiency (ηγ = 0.2 or 0.5). The analysis of the reverse and forward shock emission reveals an initial Lorentz factor of ~120−340, a jet half-opening angle of ~2°−5°, and a baryon load of ~10-5 − 10-6 M⊙ consistent with the expectations of the fireball model when the emission is highly relativistic. Long-lasting soft γ-ray emission from other INTEGRAL GRBs with high peak fluxes, such as GRB 041219A, was not detected, suggesting that a combination of high Lorentz factor, emission above 100 MeV, and possibly a powerful reverse shock are required. Similar long-lasting soft γ-ray emission has recently been observed from the nearby and extremely bright Fermi/LAT burst GRB 130427A.
Key words: gamma-ray burst: individual: GRB 120711A / gamma-ray burst: individual: GRB 041219A / gamma-ray burst: individual: GRB 130427A
Appendix A is available in electronic form at http://www.aanda.org
© ESO, 2014
1. Introduction
Gamma-ray bursts (GRBs) are the most luminous explosions in the Universe and have central engines that drive the outbursts in highly relativistic jets (e.g. Mészáros 2006). The durations of GRBs vary from milliseconds to hundreds of seconds with a few rare cases lasting more than 1000 s (e.g. Giblin et al. 2002). Long-lasting hard X-ray/γ-ray (>10 keV) emission from GRBs has been observed on several occasions with detections of up to ~4000 s (e.g. Connaughton 2002; Giblin et al. 2002). Evidence of emission up to ~1000 s after the trigger has been revealed with BATSE (Connaughton 2002) and Fermi/GBM (Fitzpatrick 2012) by stacking a large sample of long GRBs. Recently, Swift has observed several very long GRBs with prompt emission that lasted thousands of seconds, which seem to be part of a new population of ultra-long GRBs that might arise from progenitors different from those of standard GRBs (Levan et al. 2014). This population includes GRB 101225A (Thöne et al. 2011; Levan et al. 2014), which lasted >1.7 ks in the 15−150 keV band; GRB 111209A (Gendre et al. 2013), which was active for about 25 ks in the 0.3−10 keV energy band and is considered the longest GRB ever observed; GRB 121027A (Peng et al. 2013; Wu et al. 2013; Levan et al. 2014), whose X-ray flaring activity lasted ~104 s in the 0.3−10 keV band; and GRB 130925A, which showed highly variable γ- and X-ray emission extending over ~20 ks (Evans et al. 2014). These GRBs can be interpreted as the tail of the distribution of long GRBs (Virgili et al. 2013).
Since its launch, Swift (Gehrels et al. 2004) has helped to unravel the properties of early GRB afterglows in the X-ray and optical bands by providing fast localisations and extensive monitoring of X-ray afterglows up to ~107 s after the burst trigger (e.g. Nousek et al. 2006; Grupe et al. 2007, 2010). X-ray light curves are normally well sampled in the 0.3−10 keV energy range with a canonical shape consisting of 4−5 segments with different decay slopes (e.g. Nousek et al. 2006; Zhang et al. 2006). During the early parts (<100−1000 s post-trigger), the X-ray light curves are characterised by a fast-decaying phase commonly associated with high-latitude emission (e.g. Zhang et al. 2006; Genet & Granot 2009). This may be followed by a plateau phase that can be interpreted as late energy injection either from long-lived activity of the central engine (e.g. Zhang et al. 2006) or from the reverse shock (e.g. Uhm & Beloborodov 2007; Genet et al. 2007; Leventis et al. 2014). During these two phases and especially in the initial fast-decaying segment (Chincarini et al. 2010; Bernardini et al. 2011; Margutti et al. 2011), many GRBs have soft X-ray flares (e.g. Burrows 2005). The spectral lag-luminosity relationship observed in these X-ray flares may provide a link to the prompt emission (e.g. Margutti et al. 2010). At the end of the plateau phase the X-ray GRB afterglow decay steepens in a manner consistent with forward shock emission that becomes dominant, signalling the end of the prompt emission. The afterglow emission is then well described by synchrotron emission from the interaction of the forward shock with the surrounding medium (e.g. Sari et al. 1998; Chevalier & Li 2000; Granot & Sari 2002; Zhang et al. 2006). At late times (a few days), some GRBs show additional steepening that is consistent with either a jet break (e.g. Frail et al. 2001; Racusin et al. 2009) or shocks that no longer have sufficient energy to accelerate electrons that radiate in the 0.3−10 keV energy band (Sagi & Nakar 2012).
Long-lived soft γ-ray emission (above 10 keV) from individual GRBs has been reported in only a few cases. For example, Burenin et al. (1999a,b) observed emission for ~1000 s in the 35−300 keV energy range from GRB 920723 using the GRANAT/SIGMA observatory. Emission up to 60 keV was also detected from GRB 990123 using BeppoSAX (Maiorano et al. 2005). Using the INTEGRAL observatory, Grebenev & Chelovekov (2007) observed emission for about 20 s after the prompt emission had ended for GRB 060428C using IBIS (20−200 keV). In the cases of GRB 980923 (Giblin et al. 1999) and GRB 110918A (Frederiks et al. 2013), spectral evidence was found that supports an external/forward shock origin for these γ-ray emission tails. Recently, Martin-Carrillo & Hanlon (2013) reported emission of up to ~270 s after the end of the prompt emission using INTEGRAL/JEM-X (hereafter JEM-X) in several GRBs of the INTEGRAL sample.
Before the launch of Fermi (De Angelis 2001), long-lasting GeV emission was observed by EGRET from GRB 940217, with no corresponding emission at lower energies (Hurley et al. 1994). However, Fermi has now detected high-energy emission from several GRBs up to ~1000 s after the trigger, which is well modelled by an external shock mechanism at late times (100−1000 s post-trigger) (e.g. Kumar & Barniol Duran 2009; Ghisellini et al. 2010). These GRBs are characterised by photon indices ~2, and Eiso between ~2 × 1052 erg for GRBs with redshift <1.2 and ~>1054 erg for GRBs at higher redshifts (Ackermann et al. 2013).
In this paper, the characteristics of the long-lasting emission in GRB 120711A are described. This is the first GRB observed to have both long-lasting soft γ-ray emission and to be detected at GeV energies. The characteristics of GRB 120711A, the observations, and the data analysis are described in Sect. 2. The temporal and spectral results are given in Sect. 3 and are described using afterglow models in Sect. 4. The physical parameters derived from the best-fit model are given in Sect. 5. In Sect. 6, these results are compared with those obtained from other GRB observations, and a summary and conclusions are presented in Sect. 7.
X-ray observations of GRB 120711A.
The dependence of the flux on frequency, ν, and time, t, is described throughout by Fν ∝ ν−βt−α, where β is the spectral energy index that is related to the photon index, Γ, by Γ = β + 1. Thus, in this paper, a negative power-law index corresponds to a rising slope. All errors are quoted at the 1σ level for one parameter of interest. The cosmological parameters considered are H0 = 70 km s-1 Mpc-1, ΩM = 0.27, and ΩΛ = 0.73. When appropriate, the notation Qx is equivalent to Q × 10x.
2. GRB 120711A: observations and data analysis
At 02:44:48 UT (T0) on 11 July 2012, an extremely bright and long GRB was detected by INTEGRAL (RA = 06h18m48.7s, Dec = −71°00′04′′, Götz et al. 2012). Most unusually, the burst also had long-lasting emission up to ~1200 s after the trigger that was detected by both INTEGRAL/IBIS-ISGRI (hereafter IBIS) and INTEGRAL/SPI (hereafter SPI) in the 20−50 keV energy range (Bozzo et al. 2012; Hanlon et al. 2012, respectively). The burst was rapidly followed by several telescopes. Fermi/LAT observations started ~300 s after the trigger and emission was detected up to 2 GeV (Tam et al. 2012; Kocevski et al. 2012). Robotic optical telescopes detected a rapidly brightening optical counterpart, peaking at magnitude ~12 in the R and V bands (LaCluyzé et al. 2012) while the burst was still in progress. Spectroscopic observations of the optical afterglow using the Gemini-S Telescope derived a redshift of 1.405 for GRB 120711A (Tanvir et al. 2012). A 3σ radio upper limit of 96 μJy at 34 GHz using ATCA was reported at 3.78 days after the GRB by Hancock et al. (2012). No significant emission or absorption lines were found in the X-ray spectrum obtained with XMM-Newton 20 h after the GRB trigger (Giuliani & Mereghetti 2014).
2.1. INTEGRAL data
The ESA INTEGRAL observatory (Winkler et al. 2003) contains three high-energy instruments: IBIS, sensitive from ~20 keV to ~1 MeV (Lebrun et al. 2003); a high-resolution spectrometer SPI, sensitive in the 20 keV−8 MeV energy range (Vedrenne et al. 2003); and two X-ray monitors, JEM-X, operating in the 3−35 keV energy range (Lund et al. 2003). All three high-energy instruments have coded masks and operate simultaneously with the same pointing axis. However, the fields of view (FoV) are different for all instruments, with JEM-X having the lowest value of ~5°. INTEGRAL observations normally consist of a series of pointing observations (science windows) of duration ~3.5 ks (~1 h). Data from the region of GRB 120711A are available from one hour before the trigger to 12 h after the burst. The high intensity of the burst resulted in many telemetry gaps during the prompt emission phase in the IBIS data. Therefore we only used data from the SPI instrument for the analysis of the prompt emission. The large off-axis angle (9.5°) of the GRB at which the burst was observed precluded observations with JEM-X until ~T0 + 6 ks, where T0 is the trigger time. All INTEGRAL analysis was performed with the Offline Science Analysis (OSAv10)1.
2.2. Swift observations
Swift started observing GRB 120711A at ~T0 + 8 ks, with the XRT instrument (Burrows et al. 2005). Data were collected in the window-timing mode for the first package and in photon-counting mode for the remaining observations. The data were analysed using standard procedures through the xrtpipeline and the latest version of the calibration files (Burrows et al. 2005), and following the procedure described in Evans et al. (2007, 2009). Because of orbital constraints, Swift was unable to monitor the source after ~T0 + 200 ks. The list of all XRT observations of GRB 120711A considered in this analysis is shown in Table 1.
2.3. XMM-Newton observations
A target of opportunity was activated with XMM-Newton (Jansen et al. 2001) ~22 h after the trigger for a duration of ~50 ks. The first 10 ks of this observation was not considered because of the high background level. Two more XMM-Newton observations were granted (PI. Martin-Carrillo) to observe the late afterglow emission (>T0 + 1 Ms). The data from all EPIC cameras, one pn (Strüder et al. 2001) and two MOS (Turner et al. 2001), were analysed using the Science Analysis Software, SASv132 including the latest version of the calibration files. To help constrain the spectral parameters, the information from all instruments was combined for each observation. In all cases, source and background regions of 20′′ were taken to extract the source data. Standard filtering and screening criteria were then applied to create the final products. Table 1 summarises the key observational parameters.
2.4. Chandra observations
Four late follow-up observations (>T0 + 1 Ms) performed by Chandra (Weisskopf et al. 2002) are publicly available (Table 1). All observations were performed with the ACIS-S CCD (Garmire et al. 2003) in timed exposured/faint (TE-F) mode. The data were analysed using the latest version of the Chandra Interactive Analysis of Observations, CIAOv4.53 and the calibration database CALDBv4.5.9. The source and background regions were extracted in all the cases from a 3′′ circle centred on the GRB coordinates and close-by source-free regions.
2.5. Fermi/LAT observations
The Fermi/LAT detector (Atwood et al. 2009) observed the field of view of the GRB from ~T0 + 300 s until ~T0 + 1.1 ks, when the position of the burst was occulted by Earth. A second set of observations was made after the occultation phase between ~T0 + 2.5 ks and ~T0 + 7.2 ks. Because of background constraints, only photons with energies above 100 MeV were used in this analysis.
2.6. Watcher observations
The Watcher robotic telescope is located at Boyden Observatory in South Africa (French et al. 2004). The 40 cm telescope is equipped with an Electron Multiplying CCD (EMCCD) Andor iXon camera with a field of view of 8′ × 8′. The EMCCD camera can operate in a high-gain mode as well as in conventional mode. In the high-gain mode, photoelectrons go through an avalanche process with a gain of up to a factor of 255, permitting frames to be co-added without a read noise penalty.
Watcher began observing the field of GRB 120711A with a clear filter 60 s after the GRB trigger using 5 s exposures with EMCCD mode on and subsequently 30 s exposures with EMCCD mode off. The data were analysed using the standard photometry pipeline developed for this telescope (Ferrero et al. 2010). After ~T0 + 200 s, the images were stacked until a 3σ detection was obtained. The source was calibrated in the R-band using the same nearby standard stars as PROMPT (Sect. 2.7). Magnitudes were taken from the USNO-B catalogue. The difference between the GRB afterglow spectrum and the reference star spectrum in the transformation from the clear filter to R-band typically results in a shift of ~+0.15 magnitudes. The resulting error in magnitude includes the error in the calculation of the zero-point, sky background, and read-noise of the camera. In the EMCCD mode, the contribution from read-noise is negligible. An additional correction of +0.35 mag was applied to the calculated R-band Watcher magnitudes to match the PROMPT R-band data. This final adjustment was to simultaneously fit the light curve with both data sets. The shift arises from applying different transformations (clear to R-band in the case of Watcher and r′ to R-band in the case of PROMPT) and the use of different catalogues in the photometry pipeline of each telescope (USNO-B and APASS). The optical observations presented in this paper are summarised in Table 2. The observational log is given in online Table A.1..
Summary of optical/NIR observations of GRB 120711A.
2.7. Skynet/PROMPT observations
Skynet/PROMPT (Reichart et al. 2005) consists of twelve Ritchey-Chrétien telescopes of diameters ranging from 0.41 m to 0.80 m located at the Cerro Tololo Inter-American Observatory (CTIO) and Siding Spring Observatory. These telescopes are designed to respond quickly to GRB alerts and perform quasi-simultaneous multi-filter observations in the optical/near-infrared (NIR) band. Four PROMPT telescopes (see Table 2) were used to monitor the optical afterglow of GRB 120711A from T0+39 s. The photometry in the BVRI bands was calibrated using four stars from the APASS DR7 catalogue (Henden et al. 2011). Since APASS was created using the BVg′r′i′ filters, transformations to convert the r′ and i′ magnitudes into the R and I filters are required. The observational log is given in online Table A.2..
2.8. GROND observations
GRB 120711A was observed in three sets of observations spanning 350 ks in total (see Table 2) with the seven-channel Gamma-Ray burst Optical and Near-infrared Detector (GROND) mounted on the 2.2 m MPG/ESO telescope stationed in La Silla, Chile (Greiner et al. 2008). The first epoch (reported by Elliott et al. 2012) was delayed by several hours because the position of the GRB was very southerly and lay close to the Sun, so that it only rose above the pointing limit of the telescope near morning twilight. Even so, all observations were obtained at a high airmass and under mediocre to poor seeing conditions.
The GROND optical and NIR image reduction and photometry was performed by calling on standard IRAF tasks (Tody 1993) using the custom GROND pipeline (Küpcü Yoldaş et al. 2008), similar to the procedure described in Krühler et al. (2008). Optical photometric calibration was performed relative to the magnitudes of over forty secondary standards in the GRB field. During photometric conditions (more than a month after the GRB occurred, to allow observations at lower airmass), an SDSS field (Aihara et al. 2011) at RA (J2000) = 06:59:33.6, Dec (J2000) = −17:27:00 was observed within a few minutes of the observations of the GRB field. The obtained zero-points were corrected for atmospheric extinction and used to calibrate stars in the GRB field. The apparent magnitudes of the afterglow were measured with respect to these secondary standards. The absolute calibration of JHKS bands was obtained with respect to magnitudes of the Two Micron All Sky Survey (2MASS) catalogue using stars within the GRB field (Skrutskie et al. 2006) and converted to AB magnitudes. The observational log is given in online Table A.3..
2.9. REM observations
Early-time NIR data starting 129 s after the GRB trigger (see Table 2) were also collected using the 60 cm robotic telescope REM (Zerbi et al. 2001; Covino et al. 2004) located at the European Southern Observatory (ESO) La Silla observatory (Chile). The data were reduced by using standard procedures and calibrated by isolated unsaturated 2MASS stars in the field. The observational log is given in online Table A.4..
3. Results
3.1. Prompt emission
As shown in Fig. 1, GRB 120711A was a long and bright GRB with a T90 of ~115 s in the SPI 20−200 keV energy range. It had a peak flux of 32 ph cm-2 s-1 in the 20 keV−8 MeV band and 27 ph cm-2 s-1 in the 20−200 keV band. The burst consisted of a hard precursor followed by a soft flare at ~T0 + 40 s, mostly visible below 50 keV, and then ~60 s of long multi-peaked and overlapping pulses with emission above 1 MeV (Fig. 1). The prompt emission was analysed using only SPI data because of significant telemetry gaps in IBIS due to buffer saturation.
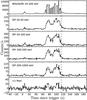 |
Fig. 1 Energy-resolved light curves of GRB 120711A. The top panel shows the 20−200 keV IBIS light curve that is severely affected by telemetry gaps. The lower panels show the SPI light curves in five energy bands. In all cases, the light curves are binned over 1 s. The vertical dashed line at T0 + 115 s represents the end of the T90 duration. |
The time-averaged spectrum over the T90 emission is best fit using a
power-law with exponential cutoff (χ2/d.o.f. = 35/30) with photon index
Γ, of 1.05 ± 0.02 and a peak energy of
1130 keV,
making it the hardest GRB (in terms of peak energy) triggered by INTEGRAL (Foley et al. 2008; Vianello et al. 2009). The total fluence measured over T90 is
(2.8 ± 0.4) ×
10-4 erg cm-2 in the 20 keV−8 MeV energy band, and (4.4 ± 0.5) ×
10-5 erg cm-2 in the 20−200 keV band.
keV,
making it the hardest GRB (in terms of peak energy) triggered by INTEGRAL (Foley et al. 2008; Vianello et al. 2009). The total fluence measured over T90 is
(2.8 ± 0.4) ×
10-4 erg cm-2 in the 20 keV−8 MeV energy band, and (4.4 ± 0.5) ×
10-5 erg cm-2 in the 20−200 keV band.
3.2. Post-GRB emission properties
3.2.1. Temporal analysis
The background-subtracted IBIS light curve in four energy bands (20−40 keV, 40−60 keV, 60−100 keV and 100−200 keV) is shown in Fig. 2 with a bin size that increases with time up to a highest value of 1 ks. The emission is detected above 3σ in each time bin for ~10 ks in the 20−40 keV band and up to ~2 ks in the 60−100 keV band. Emission at the 5σ level in the 20−40 keV energy band is found at even later times by combining IBIS data from three science windows from T0+10 ks to T0 + 27.8 ks.
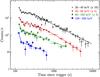 |
Fig. 2 Energy-resolved IBIS light curves of GRB 120711A with a maximum bin size of 1 ks. The solid lines represent the best-fit model to the data. In all cases, the light curves show the temporal behaviour in each band up to the time of the last significant detection (3σ above background). The upper three curves are re-normalised for display purposes. |
The data in all four energy bands can be fit using a series of smoothly connected power-laws (see Appendix A of Schulze et al. 2011), where the simplest model (single power-law) is initially used and additional power-law segments are added when necessary (Margutti et al. 2013). The best-fit temporal parameters for the four energy bands are given in Table 3. All energy bands show a short steep decay that ends at ~T0 + 140 s (Fig. 2). This steep decay phase is followed by a slower decay, which may then break again depending on the energy band considered (Fig. 2).
In the softest energy band, 20−40 keV, the best fit consists of three power-laws (χ2/d.o.f. = 63/52). The F-test probability of a chance improvement of this model is 3 × 10⁻⁶ (>4σ) over one with a single temporal break (χ2/d.o.f. = 123/58) and 10-4 (> 3σ) over a model with two breaks (χ2/d.o.f. = 98/56). The 40−60 keV energy range is best fit using a two-break model (χ2/d.o.f. = 27/23), with an F-test probability of chance improvement of 2.5 × 10⁻³ (~3σ) over a single-break model (χ2/d.o.f. = 51/26). Although not required statistically, the model derived from the IBIS 20−40 keV band can also adequately describe the higher-energy light curves. The observed differences may be caused by the reduced temporal sensitivity above 40 keV.
Best-fit temporal parameters for the long-lasting emission from GRB 120711A observed with IBIS.
All the X-ray data share a common energy band (0.3−10 keV), and thus are fit as a single data set as shown in Fig. 3. The spectrum from the whole Swift/XRT-PC data set (see Table 4) is used to convert count rates to flux units assuming no spectral evolution during the afterglow phase. This results in a best fit consisting of a broken power-law (χ2/d.o.f. of 116/96) with break time tbreak,3 = 860 ± 500 ks and temporal indices αX,1 = 1.65 ± 0.04 and αX,2 = 1.96 ± 0.22. The F-test probability for this model compared with a single power-law decay (χ2/d.o.f. of 129/98) is 6 × 10⁻³ (~3σ). It should be noted that the large error on the break time is mainly due to the lack of X-ray data from ~T0 + 200 ks to ~T0 + 1 Ms. Figure 4 shows the flux density light curve post-GRB using data from IBIS in the 20−40 keV energy band, Swift/XRT, XMM-Newton, Chandra, Fermi, and optical data from Watcher, PROMPT (both using the R-filter band), and GROND in the r′ band. The Fermi/LAT data is best fit using a single power-law decay with index αFermi = 1.30 ± 0.13, consistent with temporal decays for long-lasting emission observed by Fermi/LAT (Ackermann et al. 2013).
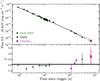 |
Fig. 3 Top panel: X-ray light curve of the observed flux in the 0.3−10 keV band using Swift, XMM-Newton, and Chandra observations. The solid line corresponds to the best-fit model (broken power-law), while the dashed line shows the fit when a single power-law model is considered. Bottom panel: photon index evolution during the X-ray follow-up observations. The dashed line is the photon index (Γ = 2.06) obtained by the joint spectral fit to the IBIS and Swift data. The 1σ error (± 0.05) is shown as a grey area. |
Thus, the post-GRB emission from X-rays to γ-rays shows four distinct temporal segments as shown in Fig. 4, determined by the break times obtained from the two high-energy temporal fits.
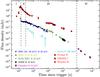 |
Fig. 4 Afterglow light curves of GRB 120711A as observed at soft γ-rays, X-rays, optical R-band and above 100 MeV. The vertical dashed lines give the break times observed in the soft γ/X-ray light curves that form the 4 temporal segments (I to IV). |
The multi-band optical/NIR light curve plotted in Fig. 5 shows a fast-rising optical flash peaking at an R brightness of ~11.5 mag ~T0 + 126 s. The peak is followed by a steep decay that seems to break at later times. The behaviour of the optical/NIR light curve after ~T0 + 10 ks is complex, with small fluctuations especially evident in the R-filter. In fact, during the second epoch of GROND observations, the optical/NIR afterglow seems to re-brighten in all filters, indicating late activity on top of the standard afterglow decay.
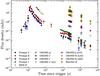 |
Fig. 5 Multi-band optical/NIR light curve observed with Watcher, Skynet/PROMPT, GROND, and REM. The z′JHK bands are scaled for display purposes. |
Little or no colour change is seen throughout the entire optical/NIR observing campaign. Therefore we fit the optical/NIR data using the R-band only where the light curve is best sampled by combining Watcher and PROMPT data. For times <T0 + 1 ks, the best-fit model (χ2/d.o.f. of 30/24) consists of a fast-rising power-law of index αopt,1 = −9 ± 2 that peaks at T0 +126 ± 5 s and decays as a broken power-law with αopt,2 = 3.30 ± 0.20, αopt,3 = 1.80 ± 0.13 and tbreak,opt = 215 ± 14 s. The F-test probability of this test over a model with a single power-law decay after the optical peak (χ2/d.o.f. of 74/26) is 2 × 10⁻⁵ (~4σ).
The late-time optical/NIR data (>T0 + 1 ks) can
be fit by considering a single power-law decay of index αopt,4 = 1.00 ± 0.05 using the simultaneous multi-band
data from GROND. This implies a temporal break in the optical/NIR somewhere around
~T0 +1 ks. As
shown in Fig. 6, the decay between T0 + 215 s and
~T0 + 1 ks
(αopt,3 ~ 1.80) can be explained by the
contribution from the decay of two broken power-laws, one with temporal decay
αopt,2 and peaking
at T0 + 126 s, consistent with reverse
shock (RS) emission, and the second with the late decay, αopt,4, consistent with
forward shock (FS) emission. This FS component is best fit with a rising power-law index
of αopt,FS,1 = −1.23 ± 0.5 and peaking at T0 + 238 s.
s.
The unusually fast rising power-law index of the optical flash is obtained with the data referring to the trigger time, T0, which corresponds to the time at which the precursor was detected. As discussed by Zhang et al. (2006), for multi-peaked GRBs, it seems more reasonable to refer to the beginning of the main emission than to the trigger time. This results in a power-law index αopt,1 ~ 5.4, more consistent with those expected from a reverse shock in a homogeneous environment (Kobayashi & Zhang 2003).
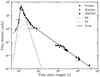 |
Fig. 6 R-band optical light curve of GRB 120711A. The best-fit model (solid line) consists of two components: a reverse shock (RS, dashed line) and a forward shock (FS, dash-dotted line). |
3.2.2. Spectral analysis
Time-averaged spectral analysis was performed for the four segments of the decaying high-energy light curve (Fig. 4). For the soft X-ray observations, two absorption components were considered, consisting of an intrinsic absorption fixed at z = 1.405 and the Galactic absorption of NH = 7.9 × 1020 cm-2 at the GRB sky coordinates (Kalberla et al. 2005). For INTEGRAL and Fermi data, where the absorption is no longer relevant, a single power-law model was adopted. The parameters obtained from the spectral analysis for the four segments are given in Table 4. For segments where data from more than one instrument are available, the spectral results are shown independently for each instrument. For the data in segment IV, the intrinsic absorption cannot be constrained and the data were fitted assuming only the Galactic contribution. This model is favoured over a model with a fixed intrinsic absorption, especially for the XMM-Newton observation at T0 + 1.5 Ms (see Table 4). This lack of intrinsic absorption at late times could indicate evolution of NH,intr with time. However, in this case it is more likely to be due to the poorly constrained fit caused by the low number of counts during this segment.
Spectral analysis of GRB 120711A per segment and instrument.
The IBIS spectrum for segment I (T0 + 115 s to T0 + 130 s) is shown in Fig. 7. The null-hypothesis probability that the single power-law model is not the best fit is 0.8 (χ2/d.o.f. = 35/28). As seen in Fig. 7 (bottom panel), the distribution of the residuals suggests that an additional soft component is required. The F-test probability of a chance improvement of a two-component model (blackbody plus power-law or broken power-law) with respect to the single power-law model is ~10-4 (see Table 4). There is no significant difference between a fit using a blackbody+power-law and a broken power-law. A similar result is obtained for segment II (Table 4). In this case, the F-test probability of a chance improvement is ~10-2, and we note that all three models tested result in a poor fit for segment II (Table 4). The spectrum of the forward shock emission consists of a series of power-law segments with breaks caused by self-absorption, characteristic and cooling frequencies when crossing the observed band. During segments I and II, the observed change of the spectral index is Δβ ~ 1, which is higher than the value expected for the spectral breaks predicted in the forward shock model (Δβ ~ 0.5). A thermal component is not expected either in the forward shock spectrum. Therefore the spectral evolution during segments I and II may be caused by either late activity from the central engine or by the reverse shock.
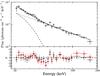 |
Fig. 7 IBIS spectrum from 20 keV to 200 keV of GRB 120711A during segment I (T0 + 115 s to T0 + 130 s). The best-fit model is shown as a solid line. The model includes blackbody and power-law components that are shown as dashed and dotted lines. The bottom panel shows the residuals from the blackbody+power-law fit (dots) and the single power-law fit (diamonds). |
The joint spectral fit from T0 + 2.5 ks to T0 + 20 ks
(segment III) using Swift/XRT, JEM-X, and IBIS is shown in Fig. 8. It is well fit by a single power-law of photon index
Γ = 2.06 ± 0.05 (χ2/d.o.f. = 67/51) including two
absorption components at soft X-rays, a Galactic component (fixed), and intrinsic
absorption with a value of  cm-2. We note that a broken
power-law model would also satisfy the data with a break energy at ~1.3 keV fixing Δβ = 0.5 (χ2/d.o.f. = 64/50). However, the fit is
limited by the uncertainty in the normalisation between the instruments and the
degeneracy between the intrinsic X-ray absorption and the low-energy power-law
component.
cm-2. We note that a broken
power-law model would also satisfy the data with a break energy at ~1.3 keV fixing Δβ = 0.5 (χ2/d.o.f. = 64/50). However, the fit is
limited by the uncertainty in the normalisation between the instruments and the
degeneracy between the intrinsic X-ray absorption and the low-energy power-law
component.
The evolution of the photon index during the X-ray observation campaign with Swift, XMM-Newton and Chandra (see Fig. 3, bottom panel) shows little spectral evolution when compared with the resulting photon index from the joint spectral fit (Fig. 8). However, these variations of the photon index are consistent within 2σ. Therefore we consider the X-ray photon index to be constant during segment III.
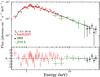 |
Fig. 8 Broadband spectral fit from 0.3 keV to 45 keV during the time interval between
T0 +
2.5 ks and T0 + 20 ks using data from
Swift/XRT, JEM-X, and IBIS. The data are well fit by a single
power-law of Γ =
2.06 ± 0.05 that
includes soft X-ray absorption from our galaxy and an intrinsic absorption of
|
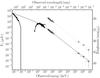 |
Fig. 9 Spectral energy distributions at two different time intervals. The SED for IBIS and Fermi/LAT data from T0 + 300 s to T0 + 1050 s (light-grey stars), and the SED for GROND and Swift/XRT at T0 + 26 ks (black circles). The IBIS and Fermi/LAT data are also shown rescaled (dark-grey stars) to the GROND-Swift/XRT SED to illustrate the single-spectra component from X-rays to GeV. |
3.2.3. Spectral energy distributions
Figure 9 shows that the spectral energy
distribution (SED) determined by GROND is very red, showing clear signs of rest-frame
dust extinction. A joint fit with the X-ray data shows that the best fit is given by a
broken power-law, with the cooling frequency νc between the optical and the X-ray
bands (νc = 2.37 keV).
The data were corrected for the Galactic foreground extinction of E(B −
V) = 0.08 (Schlegel et al. 1998) and Galactic hydrogen column density
NH = 7.9 ×
1020 cm-2 (Kalberla et al.
2005) for this fit. The SED was determined at 26 ks, using direct GROND
observations and X-ray data for which the SED was determined over a broader time-frame
(no spectral evolution is seen), and then scaled to the same time as the GROND data.
Table 5 shows the different models considered
under the three common extinction curves (Milky Way, SMC, and LMC). The best fit is
found using the LMC dust (χ2/d.o.f. = 436/490), with
βopt = 0.53 ±
0.02 (βX =
βopt + 0.5), AV = 0.85 ±
0.06, and
keV).
The data were corrected for the Galactic foreground extinction of E(B −
V) = 0.08 (Schlegel et al. 1998) and Galactic hydrogen column density
NH = 7.9 ×
1020 cm-2 (Kalberla et al.
2005) for this fit. The SED was determined at 26 ks, using direct GROND
observations and X-ray data for which the SED was determined over a broader time-frame
(no spectral evolution is seen), and then scaled to the same time as the GROND data.
Table 5 shows the different models considered
under the three common extinction curves (Milky Way, SMC, and LMC). The best fit is
found using the LMC dust (χ2/d.o.f. = 436/490), with
βopt = 0.53 ±
0.02 (βX =
βopt + 0.5), AV = 0.85 ±
0.06, and 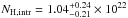 cm-2. The soft X-ray intrinsic
absorption found in this fit is consistent with that obtained using X-ray data alone
(see Table 4). The 2175 Å bump lies between the
g′ and the r′ filter, so
there is no direct detection of this bump in the data set. However, in the SMC fit, the
r′-band flux is significantly
overestimated, whereas the g′-band flux is similarly
underestimated. These two bands are fit excellently in the LMC model.
cm-2. The soft X-ray intrinsic
absorption found in this fit is consistent with that obtained using X-ray data alone
(see Table 4). The 2175 Å bump lies between the
g′ and the r′ filter, so
there is no direct detection of this bump in the data set. However, in the SMC fit, the
r′-band flux is significantly
overestimated, whereas the g′-band flux is similarly
underestimated. These two bands are fit excellently in the LMC model.
Resulting parameters from the SED fit between optical/NIR and X-ray data at T0 + 26 ks using a broken power-law model.
Figure 9 also shows the simultaneous IBIS and Fermi data between T0 + 300 s and T0 + 1050 s, during segment III. The data are well fit by a single power-law with photon index of ~2, which is consistent with synchrotron radiation. However, the error on the Fermi/LAT photon index is quite large (Table 4). An analysis where the normalisation between both instruments was allowed to vary showed that the results from both instruments are consistent with each other. The lack of spectral data over more than two decades in energy between INTEGRAL and Fermi makes it difficult to completely rule out inverse Compton or hadronic components that peak at energies below 100 MeV.
4. Interpretation of the post-GRB emission
The soft γ/X-ray and optical light curves for GRB 120711A exhibit several interesting features including an optical flash, a short plateau phase at soft γ-rays; a high-energy light curve consisting of four segments; a spectral break between the optical and the X-ray emission due to νc (Fig. 9); and a single power-law spectral model between INTEGRAL and Fermi. The shape of the high-energy light curve in Fig. 4 resembles those usually observed in GRB afterglows. However, for GRB 120711A the emission is observed above 20 keV during the first 10 ks. The 20−40 keV energy band provides the most sensitive light curve, and the temporal parameters used to model the IBIS light curve were obtained from this energy band. The properties of the emission are studied in the following sections in the context of the standard afterglow model (e.g. Sari et al. 1998; Chevalier & Li 2000; Granot & Sari 2002; Zhang et al. 2006).
4.1. Segments I and II
Segments I and II span the time interval from ~T0 + 115−283 s, which includes the high-energy early steep decay and plateau phases and the optical flash.
The spectral index during the soft γ-ray fast decay is βγ,1 = 0.38 ± 0.10 with an additional softer component
in the form of a second power-law of index,  ~ 1.2 (Table 4). This additional component seems to preclude the simple relation between
spectral and temporal indices that is typically used to identify high-latitude emission
(α = 2 +
β, Fenimore &
Sumner 1997; Kumar & Panaitescu
2000a; Zhang et al. 2006), which assumes
a single power-law. However, as reported by Rossi et al.
(2011), this relationship can be recovered assuming that the flux and the peak
energy of the high-latitude emission depend on the viewing angle (i.e. the electron
population is not constant for all angles). For GRB 120711A, the main pulse consists of
two broad peaks that contribute to the high-latitude emission. This multi-peaked behaviour
can lead to temporal indices that do not follow the simple correlation between the
spectral and temporal indices (Genet & Granot
2009). Steeper decays than the one expected from the simple approximation have
also been reported for several GRBs in the Swift sample (Margutti et al. 2013).
~ 1.2 (Table 4). This additional component seems to preclude the simple relation between
spectral and temporal indices that is typically used to identify high-latitude emission
(α = 2 +
β, Fenimore &
Sumner 1997; Kumar & Panaitescu
2000a; Zhang et al. 2006), which assumes
a single power-law. However, as reported by Rossi et al.
(2011), this relationship can be recovered assuming that the flux and the peak
energy of the high-latitude emission depend on the viewing angle (i.e. the electron
population is not constant for all angles). For GRB 120711A, the main pulse consists of
two broad peaks that contribute to the high-latitude emission. This multi-peaked behaviour
can lead to temporal indices that do not follow the simple correlation between the
spectral and temporal indices (Genet & Granot
2009). Steeper decays than the one expected from the simple approximation have
also been reported for several GRBs in the Swift sample (Margutti et al. 2013).
The high-energy plateau phase in GRB 120711A is unusually short when compared with the Swift GRB sample (Margutti et al. 2013). Assuming late activity of the central engine (e.g. Zhang 2007), the energy injection parameter in the case of fast or slow cooling is q = 0.3 ± 0.3, where αγ,2 = 0.26 ± 0.30 and is either βγ,2 = 0.93 ± 0.15 or βγ,2 = 1.35 ± 0.08, when the cooling frequency is lower than that of the IBIS band. Nevertheless, the X-ray plateau can also be linked with reverse shocks in the optical band (Uhm & Beloborodov 2007; Genet et al. 2007). For GRB 120711A, a powerful optical flash is observed in the optical/NIR light curve (Fig. 5) that may be responsible for this high-energy plateau.
The optical/NIR light curve during these temporal segments shows a very steep increase of
flux that peaks at ~T0 + 126 s and then decays with a
temporal index α,opt,2 ~ 3.3. This behaviour resembles that of a
type-II reverse shock (Zhang et al. 2003; Jin & Fan 2007). This hypothesis is also
supported by the lack of chromatic evolution around the peak (Fig. 5). In this type of reverse shock, the forward and reverse shocks are
expected to peak at similar times with the reverse shock outshining the forward shock. The
observed increases of the reverse and forward shock emission are steeper than those
expected in a wind environment,  and
and  (Chevalier & Li 2000; Kobayashi & Zhang 2003), which could suggest an
ISM environment. However, this steep increase in the flux can also be achieved in a wind
environment if self-absorption cannot be ignored (Chevalier & Li 2000). Additionally, the rising slope of the forward
shock model is not well constrained for GRB 120711A.
(Chevalier & Li 2000; Kobayashi & Zhang 2003), which could suggest an
ISM environment. However, this steep increase in the flux can also be achieved in a wind
environment if self-absorption cannot be ignored (Chevalier & Li 2000). Additionally, the rising slope of the forward
shock model is not well constrained for GRB 120711A.
Regardless of the environment, in this type of reverse-forward shock emission, a flattening of the light curve is expected at later times when the forward shock dominates, with a temporal index ~1.1. For GRB 120711A, a break in the decay is seen by the end of segment II (~T0 + 215 s). However, the new temporal decay index is steeper than that expected for pure forward shock emission (α,opt,3 ~ 1.80). The interpretation of this part of the optical/NIR light curve is discussed in Sect. 4.2.
In the on-axis GRB model, the time at which the reverse shock finishes crossing the ejecta can be interpreted as the deceleration time of the jet, tdec. For GRB 120711A this time (tpeak ~ T0 + 126 s) is similar to the duration of the burst (~115 s). Therefore, GRB 120711A seems to be in an intermediate state between the so-called thin-shell case for which tpeak > T90, and the thick-shell case for which tpeak < T90 (e.g. Sari & Piran 1999; Zou et al. 2005; Mészáros 2006). The time of the peak of the forward shock (tpeak ~ T0 + 240 s) can be interpreted as the onset of the afterglow emission and thus it can also be used to estimate tdec (e.g. Mészáros 2006; Molinari et al. 2007).
4.2. Segment III: multi-wavelength afterglow emission
Segment III spans most of the afterglow emission from ~T0 + 283 s to ~T0 + 900 ks with data available from near-infrared, optical, X-rays, soft γ-rays, and photons with energies >100 MeV.
The SED shown in Fig. 9, which combines optical/NIR and X-ray data, indicates that a break is needed between the two energy bands. Considering that the peak of the forward shock occurred at ~T0 + 126 s, νm < νopt < νc ~ νX < νγ during most of segment III, where νm is the characteristic frequency and νc the cooling frequency. In an ISM environment, νc is expected to decrease with time as νc ∝ t−1/2, while in a wind environment νc is expected to increase with time as νc ∝ t1/2 (e.g. Chevalier & Li 2000; Granot & Sari 2002; Zhang et al. 2006).
As mentioned, there are two possible environments depending on the density profile
ρ =
Ar− k,
homogeneous or ISM when k = 0 and wind when k = 2. An estimate of the
real k-index
can be obtained if the observed frequency is below νc (Starling et al. 2008). At T0 + 26 ks, the
optical temporal and spectral indices are αopt,4 = 1.00 ± 0.05 and βopt = 0.53 ± 0.02, respectively. Thus, the index of the
density profile, k given by Eq. (1) is 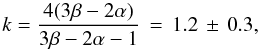 (1)which
corresponds to an intermediate case between ISM and wind environments at a ~4 σ confidence level.
(1)which
corresponds to an intermediate case between ISM and wind environments at a ~4 σ confidence level.
In the IBIS data, νc < νγ, which means that, the ISM and wind environments cannot be distinguished. The relationship between the spectral and temporal index in the slow-cooling regime is αth,γ4 = (3βγ − 1)/2 = 1.03 ± 0.09. This value is consistent with the observed temporal decay of the IBIS data (αγ,3 = 1.13 ± 0.04). Thus, the IBIS soft γ-ray data during this segment are consistent with forward shock emission. Similarly, the Fermi/LAT data are also consistent with forward shock emission. The marginal difference between the IBIS and Fermi/LAT temporal decays could be explained by the reduced efficiency of the shock to accelerate electrons that emit at energies above 100 MeV (Sagi & Nakar 2012).
If the optical/NIR data simultaneous with IBIS are considered as pure forward shock emission, then αopt,3 > αγ,3, favouring the wind environment. However, the closure relation in slow cooling for the wind environment is not compatible with the observed decay. As mentioned in Sect. 3.2.1 (see Fig. 6), the optical decay index of αopt,3 ~ 1.80 can be obtained from a combination of the fast-decaying reverse shock and the forward shock with temporal index αopt,4, which is similar to αγ,3. This lack of a temporal break between the optical and soft γ-ray bands is incompatible with the ISM or wind environments when νopt < νc < νγ (Δαth ~ 0.25). However, if a more complete set of closure relations is considered where k = 1.2 (Starling et al. 2008), the expected temporal index for the optical band becomes αth,opt = [6βopt(4 − k + 2k)]/4(4−k) ~ 1.01, which is consistent with αopt,4. As previously mentioned, αth,γ does not depend on k and is consistent with the negligible difference between the optical and γ-ray temporal indices found for GRB 120711A. Therefore, the afterglow emission of GRB 120711A is consistent with a mildly stratified wind-like environment. Note that the late-time variability in the optical emission reported in Sect. 3.2.1 may imply that αopt,4 is actually steeper than measured, which could lead to an environment more like the classic wind profile (i.e. k = 2).
The electron spectral index, p, can be derived from the IBIS and optical data for a wind-like environment of k ~ 1.2 as p = 2 βγ = 2.04 ± 0.12 (βγ = 1.02 ± 0.06) and p = 2 βopt + 1 = 2.06 ± 0.04 (βopt = 0.53 ± 0.02), respectively.
The X-ray data in segment III show a much steeper temporal decay than the IBIS data with no significant spectral change. The location of νc within the X-ray band precludes the closure relations between the spectral and temporal indices, since they are defined for cases above and below the break frequencies.
The smoothing parameter, s of the spectral break caused by νc is determined by the electron spectral index as s = (0.80−0.03 p) ~ 0.7 (Granot & Sari 2002). Such a smooth break (the lower | s |, the smoother the break) is extremely difficult to identify in the narrow X-ray band of 0.3−10 keV or even in the joint spectral fit shown in Fig. 8 from 0.3−40 keV. The fact that a broken power-law was fitted using a single power-law component when using only X-ray data might explain the 2σ variations of the photon index shown in Fig. 3 (bottom panel) and the relative softening seen at >T0 + 1 Ms.
Granot & Sari (2002) described the flux
density near νc as ![Mathematical equation: \begin{equation} \label{eq:flux} \begin{array}{l} F_{\nu}=F_{\nu_{\rm c}} \left[\left(\dfrac{\nu}{\nu_{\rm c}}\right)^{-s\beta_1} + \left(\dfrac{\nu}{\nu_{\rm c}}\right)^{-s\beta_2} \right]^{-1/s}. \end{array} \end{equation}](/articles/aa/full_html/2014/07/aa20872-12/aa20872-12-eq171.png) (2)This
means that near the spectral break caused by νc, the temporal evolution of the
observed flux is Fν ∝ Fνc ∝ t1/2−p ~ t-1.6, which is different from the
temporal evolution predicted by the closure relations when νobs > νc, t(2−3p)/4 ~ t-1.1. This steeper temporal decay is
consistent with the observed X-ray decay of αX,1 = 1.65 ± 0.04. The lack of X-ray spectral evolution
can be explained by the mildly stratified environment with k ~ 1.2 in GRB 120711A. As mentioned earlier,
for a wind environment the cooling frequency is expected to evolve as νc ∝ t1/2. However, a
non-evolving νc can be found when k ~ 1.5, suggesting that for GRB 120711A,
νc remains within the X-ray band for the
entire observation (see also GRB 130427A, Perley et al.
2014). The time evolution of νc might also be modified if the
microphysical parameters of the afterglow emission are time dependent (Panaitescu et al. 2006; Filgas et al. 2011).
(2)This
means that near the spectral break caused by νc, the temporal evolution of the
observed flux is Fν ∝ Fνc ∝ t1/2−p ~ t-1.6, which is different from the
temporal evolution predicted by the closure relations when νobs > νc, t(2−3p)/4 ~ t-1.1. This steeper temporal decay is
consistent with the observed X-ray decay of αX,1 = 1.65 ± 0.04. The lack of X-ray spectral evolution
can be explained by the mildly stratified environment with k ~ 1.2 in GRB 120711A. As mentioned earlier,
for a wind environment the cooling frequency is expected to evolve as νc ∝ t1/2. However, a
non-evolving νc can be found when k ~ 1.5, suggesting that for GRB 120711A,
νc remains within the X-ray band for the
entire observation (see also GRB 130427A, Perley et al.
2014). The time evolution of νc might also be modified if the
microphysical parameters of the afterglow emission are time dependent (Panaitescu et al. 2006; Filgas et al. 2011).
The closure relations when νobs < νc in an ISM environment predict a temporal index consistent with that found using only the Swift X-ray data (αth,opt = (3p − 2)/4 ~ 1.5), which leads to p ~ 3. However, this model is rejected when combining the X-ray data with all the multi-wavelength data obtained for GRB 120711A. Hence, it is possible that GRBs with limited optical/NIR observations might be described with an ISM model when in reality they occur in a wind-like environment.
4.3. Segments IV: late X-ray afterglow
The X-ray light curve steepens in this last segment. The values of the temporal and spectral indices are αX,2 = 1.96 ± 0.22 and βX,2 = 1.5 ± 0.5. No significant spectral change is seen during the break at T0 ~ 1 Ms, which suggests the occurrence of a jet break. The change in the temporal index with the previous segment is ΔαX = 0.31 ± 0.22 when compared with the X-ray decay. This value is consistent with the expected change due to a jet break for the wind model (~0.4 Kumar & Panaitescu 2000b). For a non-spreading jet in a wind environment with νX > νc, the expected temporal index is αth = 3βX/ 2 ~ 2.3 ± 1.5, consistent with the observed decay after the break. As expected for a jet break, the observed temporal decay after the break is consistent with the electron spectral index (Kumar & Panaitescu 2000b).
Even though there is good agreement between the model and the data in the case of a jet break, the tendency towards a softer spectrum after the break could also be attributed to the inefficiency of the shock to accelerate X-ray emitting electrons (Sagi & Nakar 2012).
5. Emission parameters of GRB 120711A in a wind environment
The standard afterglow model in a stratified wind-like environment contains four free parameters (e.g. Chevalier & Li 2000; Granot & Sari 2002): the kinetic energy, Ek, the energy equipartition fractions of electrons and magnetic field, ϵe and ϵB, and the wind parameter, A∗. A∗ is defined by A∗ = (ṀW /4 π VW)/(5 × 1011) g cm-1, where ṀW is the mass-loss rate, and VW is the wind velocity of a typical Wolf-Rayet star (VW = 1000 km s-1). Although studies have shown that the microphysical parameters can be time dependent (Panaitescu et al. 2006), for GRB 120711A they are considered as constants. From Eq. (1), the best density profile in this case is k = 1.2 ± 0.3. The formulation by Granot & Sari (2002) considers the two cases k = 0 and 2. A complete derivation for k = 1.2 is beyond the scope of this work. The parameter most affected by the k value is the initial bulk Lorentz factor, which varies by a factor of ~2 when comparing the two extreme cases of k = 0 and k = 2. Therefore, to allow calculation of the microphysical parameters in this case, we assumed k = 2 and an electron spectral index of ~2.1.
Considering the formulation from Granot & Sari (2002) to describe the forward shock emission, three constraints on the fireball parameters can be obtained as follows: at T0 + 26 ks, νc ~ 2.37 keV with an unabsorbed flux of Fνc ~ 5.33 μJy; and at T0 + 238 s the forward shock peaks and the location of νm can be established at νm ~ 4.68 × 10¹⁴ Hz. These constraints result in the following three conditions:
 (3)where
the luminosity distance dL,28 = 3.18 cm calculated for a redshift
of 1.405 (Tanvir et al. 2012) has been taken into
account.
(3)where
the luminosity distance dL,28 = 3.18 cm calculated for a redshift
of 1.405 (Tanvir et al. 2012) has been taken into
account.
A fourth condition must be imposed to find all unknown parameters in Eq. (3). The lack of a constraint on the location of the self-absorption frequency (νsa) requires that one parameter must be fixed. The radiative efficiency, ηγ, to convert total energy, Etotal, into radiation is defined as ηγ = Eγ/Etotal, where Etotal = Eγ + Ek. Most long GRBs are well fitted with ηγ < 0.2 (Zhang et al. 2007). However, Racusin et al. (2011) reported that while that statement is true for most Swift/BAT GRBs, for Fermi/LAT GRBs it might not be valid because higher efficiencies are required (ηγ ~ 0.5 or even higher in a few cases). In these studies all other microphysical parameters were assumed to be the same for all GRBs in the sample. Considering the ambiguity on ηγ and that GRB 120711A is also a Fermi/LAT GRB, all physical parameters were calculated for two cases, ηγ ~ 0.2 and ηγ ~ 0.5.
Using the data from the prompt emission, the rest-frame k-corrected isotropic energy radiated during the T90 in the 1 keV−10 MeV energy band is Eγ,iso = 1.65 × 1054 erg. Thus, assuming ηγ ~ 0.2 (0.5), the isotropic kinetic energy is Ek,iso = 6.6 × 1054 erg (1.65 × 1054 erg). Applying this result to Eq. (3) gives ϵB = 2 × 10⁻³ (4 × 10⁻⁵), ϵe = 0.03 (0.12), and A∗ = 0.11 (1.6). These values are consistent with those reported for other GRBs (e.g. Panaitescu & Kumar 2002; Zhang et al. 2007). The estimated wind parameter implies a mass-loss rate for the progenitor of GRB 120711A of ṀW ~ 10-6 M⊙ yr-1 (10-5 M⊙ yr-1), which is consistent with the expected mass-loss rate of an evolved Wolf-Rayet star at the end of its life (Langer 1989; Chevalier & Li 1999). This model also predicts the location of the self-absorption frequency, νsa, at the time of the ATCA radio observation (T0 + 3.78 days) at 51 GHz (241 GHz), which is higher than the frequency used for the observation (34 GHz, Hancock et al. 2012). Accodingly, the lack of a detection of the radio afterglow emission from GRB 120711A might be due to self-absorption.
The peak emission from the reverse shock corresponds to the time when the shock has
finished crossing the ejecta and therefore is a good indicator of the deceleration time.
From Zou et al. (2005), the Lorentz factor at this
time can be expressed as 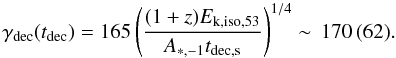 (4)At
the deceleration time, the initial bulk Lorentz factor, γ0, is expected to
be twice the Lorentz factor at tdec (e.g. Sari & Piran 1999; Mészáros
2006), which results in γ0 = 2 γdec ~ 340 (124).
(4)At
the deceleration time, the initial bulk Lorentz factor, γ0, is expected to
be twice the Lorentz factor at tdec (e.g. Sari & Piran 1999; Mészáros
2006), which results in γ0 = 2 γdec ~ 340 (124).
The initial bulk Lorentz factor can also be constrained by considering that the peak of the forward shock (~T0 + 238 s) is the onset of the afterglow emission and marks the deceleration of the fireball. Using the expressions from Molinari et al. (2007) for the thin-shell case (tpeak > T90), the initial Lorentz factor is γ0 ~ 402 (260). These values are slightly higher (more than × 2 in the case of ηγ ~ 0.5) than those measured using the peak of the reverse shock. However, considering the large uncertainty on the time of the forward shock peak, they can be considered to be compatible.
The deceleration radius, Rdec, in a wind environment expressed as a
function of the initial Lorentz factor (Chevalier &
Li 2000) can be estimated as 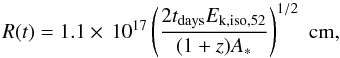 (5)which
results in Rdec = 3 ×
1017 cm (3 × 1016 cm), consistent with that reported for other GRBs (e.g.
Zhang 2006).
(5)which
results in Rdec = 3 ×
1017 cm (3 × 1016 cm), consistent with that reported for other GRBs (e.g.
Zhang 2006).
In Sect. 4.3, the last temporal segment in the X-ray
light curve can be explained by a jet break. At the time of the jet break (tjet ~ T0 + 0.9 Ms), the jet half-opening angle
can be assumed to be θjet ~ γ-1(tjet).
Therefore, the jet half-opening angle using the wind model (Chevalier & Li 2000; Ghirlanda et al.
2006) can be expressed as 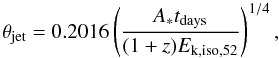 (6)which
results in θjet ~ 0.03 rad (2°) for ηγ ~ 0.2 and θjet ~ 0.09 rad (5°) for ηγ ~ 0.5. This corresponds to a Lorentz factor at
the time of the jet break of γjet = 30 (11). The high Lorentz factor
obtained at the jet break for ηγ ~ 0.2 could indicate that ηγ > 0.2 may be preferred
for GRB 120711A.
(6)which
results in θjet ~ 0.03 rad (2°) for ηγ ~ 0.2 and θjet ~ 0.09 rad (5°) for ηγ ~ 0.5. This corresponds to a Lorentz factor at
the time of the jet break of γjet = 30 (11). The high Lorentz factor
obtained at the jet break for ηγ ~ 0.2 could indicate that ηγ > 0.2 may be preferred
for GRB 120711A.
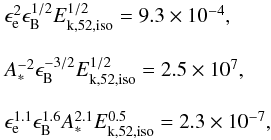
The collimation factor, fb, is then fb = 1−cos θjet = 4 × 10⁻⁴ (4 × 10⁻³). Therefore, the corrected radiative and kinetic energies are Eγ = Eγ,isofb = 7 × 1050 erg (7 × 1051 erg) and Ek = Ek,isofb = 3 × 1051 erg (7 × 1051 erg). The total energy of the fireball is then Etotal = Eγ + Ek ~ 4 × 1051 erg (1.4 × 1052 erg). As a result of these values, either ηγ ~ 0.2 is preferred or GRB 120711A approaches the class of hyper-energetic GRBs suggested by Cenko et al. (2011).
The baryon load Mfb is described as a function of the
corrected kinetic energy of the blast-wave and the initial Lorentz factor by
 (7)and
gives a value of Mfb = 5 × 10⁻⁶ M⊙ (3 × 10⁻⁵ M⊙) for GRB 120711A, using the
beam-corrected Ek. Mfb is consistent
with the value expected from the fireball model (e.g. Piran
2005, and references therein).
(7)and
gives a value of Mfb = 5 × 10⁻⁶ M⊙ (3 × 10⁻⁵ M⊙) for GRB 120711A, using the
beam-corrected Ek. Mfb is consistent
with the value expected from the fireball model (e.g. Piran
2005, and references therein).
The emission parameters obtained for GRB 120711A are given in Table 6.
Emission parameters obtained for GRB 120711A for two cases with different radiation efficiencies, ηγ.
6. Discussion
6.1. GRB 120711A as a member of the long GRB population
The large number of GRBs triggered by BATSE provide one of the best samples to study the distribution of observed Epeak for long GRBs (Kaneko et al. 2006). Despite possible observational biases, the BATSE Epeak distribution peaked around 200−400 keV, with a high-energy tail extending up to ~3 MeV. Similar results have recently been published using Fermi/GBM data (Goldstein et al. 2012). In these distributions GRB 120711A is one of the hardest GRBs observed to date. GRB 120711A is the hardest GRB triggered by INTEGRAL (Foley et al. 2008; Vianello et al. 2009). In the rest frame, GRB 120711A belongs to the top 1% of the hardest GRBs with known redshift and also to the top 1% of the brightest GRBs in terms of Eγ,iso (e.g. Ghirlanda et al. 2012). It should be noted that some of the most powerful GRBs including GRB 120711A are also detected by Fermi/LAT (McBreen et al. 2010; Racusin et al. 2011; Ackermann et al. 2013).
The emission from GRB 120711A is well modelled using a density profile of k ~ 1.2, which corresponds to an intermediate case between the ISM and wind environments. A stratified environment seems to be the preferred model for most Fermi/LAT GRBs (Cenko et al. 2011). This is in contrast to the vast majority of GRBs that are consistent with a homogeneous environment (Schulze et al. 2011). A similar intermediate environment has been found in the powerful GRB 130427A (Perley et al. 2014). Recent analysis of the Swift GRB sample also indicates that the wind environment seems to be preferred over a homogeneous density medium for highly energetic bursts (De Pasquale et al. 2013).
The analysis of several GRBs with known redshifts (Ghirlanda et al. 2012) indicates that the initial bulk Lorentz factor seems to depend strongly on the environment, with an average value of γ0 of 138 and 66 for the ISM and wind environments. Ghirlanda et al. (2012) also found a trend towards higher γ0 in Fermi/LAT GRBs with the average values increasing to ~299 in the wind model. The results presented here indicate that GRB 120711A falls in this category with high γ0. The result found for GRB 120711A is also consistent with the γ0 distribution presented in the first Fermi/LAT catalogue (Ackermann et al. 2013).
The typical jet half-opening angle of GRBs is ~5° with some values as high as 24° (Racusin et al. 2009), which is consistent with the values of 2° and 5° derived for GRB 120711A. In a large sample of Swift GRBs, Racusin et al. (2009) reported an average time of the jet break of 1−2 days post trigger, with a paucity of GRBs with jet breaks at times >10 days. The lack of GRBs with breaks at late times is probably a bias caused by the lack of observations at times >2 Ms. Currently, only 5% of GRBs monitored by Swift have observations at these times. In fact, in GRB 120711A, the candidate jet break found at ~10 days was detected using late observations performed by XMM-Newton and Chandra.
GRB 120711A satisfies the so-called Ghirlanda correlation (Ghirlanda et al. 2007) with an expected radiative energy, Eγ consistent with our measurements. Interestingly, the Epeak − Eγ,iso − tjet correlation (Liang & Zhang 2005; Ghirlanda et al. 2007) predicts a jet break at much earlier times (~5 days after trigger in the observer’s frame).
The product of the jet half-opening angle and the initial bulk Lorentz factor, θjetγ0, provides insight into the jet geometry. Ghirlanda et al. (2012) found two distributions of θjetγ0 depending on the environment, with a wind environment resulting in a smaller product (~×6) than the ISM environment (~×20). For GRB 120711A, the product θjetγ0 is ~11 regardless of ηγ. This value falls in the tail of the θjetγ0 distribution in the wind environment reported by Ghirlanda et al. (2012). However, the θjetγ0 product obtained for GRB 120711A is not as high as the values reported for the hyper-energetic population (Cenko et al. 2011).
The isotropic energy radiated in the afterglow emission is Es − γ,iso = 3.7 × 1052 erg in the 20−200 keV band (rest frame) during the IBIS data in segment III, and EX,iso = 1.51 × 1051 erg in the 0.3−30 keV band (rest frame) during the entire Swift campaign. Therefore, the energy in the afterglow of GRB 120711A during the long-lived soft γ-ray emission is ~2% of the total bolometric energy radiated during the prompt phase and ~0.1% during the X-ray afterglow. GRB 120711A is consistent with the EX,iso − Eγ,iso–Epeak correlation (Bernardini et al. 2012; Margutti et al. 2013) when the IBIS data are extrapolated to the 0.3−30 keV band (rest frame) and taking into account the absorption at soft X-rays. Thus, the observed X-ray isotropic energy becomes EX,iso = 5.4 × 1052 erg (~3% of the total bolometric energy) consistent with the expected value of EX,iso,th ~ 6 × 1052 erg.
The optical absorption at the source rest-frame obtained for GRB 120711A is one of the highest observed when compared with the large GRB samples presented by Kann et al. (2010) and Greiner et al. (2011). The absorption value of AV ~ 0.85 is caused by dust extinction in the host galaxy at z ~ 1.4, which is close to the expected peak of the star formation rate (Covino et al. 2013). Following the method of Kann et al. (2006), it can be shown that the magnitude shift, dRc, between what is observed and how bright the afterglow would be if the GRB had occurred at z=1 and with no dust extinction is dRc = −2.70 ± 0.13 mag for GRB 120711A. This implies that the optical flash would have peaked at an unobscured value of ≈9th magnitude. This is fainter than the peak magnitudes of some other GRBs with reverse-shock flashes such as GRB 990123, GRB 050904, and GRB 080319B, but much brighter than GRB 060729, GRB 061121, and GRB 070802 (Kann et al. 2010). Although the optical/NIR absorption is high, the intrinsic soft X-ray absorption from the host galaxy is not particularly large when compared with a large GRB sample (e.g. Watson et al. 2007).
6.2. Long-lasting soft γ-ray emission in GRBs
An upper limit of 2.7 × 10⁻⁵ erg cm-2, during the first 5400 s post-GRB, was obtained with BATSE in the 20−300 keV energy band for the burst GRB 940217 with long-lasting GeV emission (Hurley et al. 1994). A previous study by Topinka et al. (2009) placed upper limits on bright INTEGRAL GRBs of ~5 × 10⁻⁶ erg cm-2 in the 20−400 keV energy band at 1 hour after the burst. For GRB 041219A, the brightest GRB detected by INTEGRAL, McBreen et al. (2006) reported a 3σ upper limit of ~10-5 erg cm-2 in the 20−200 keV range between ~1−2 ks after the burst using SPI data. In a re-analysis of the IBIS data from GRB 041219A, we improved this upper limit to ~10-6 erg cm-2 during the same time interval. For GRB 120711A, the detected fluence, measured in segment III for 1.2 ks, is ~10-5 erg cm-2 in the 20−200 keV energy band. Therefore, GRB 041219A did not have long-lasting soft γ-ray emission at a comparable level to GRB 120711A. There were no observations of GRB 041219A above 100 MeV.
Since the launch of Fermi, only GRB 080723B was observed with similar brightness by INTEGRAL and Fermi simultaneously. No LAT emission was detected from this GRB and no soft γ-ray late emission was observed in the IBIS data with a 3σ upper limit of ~10-6 erg cm-2 in the 20−200 keV range between ~1−2 ks after the burst. The lower initial bulk Lorentz factor of ~200, predicted for ISM environments with the γ0–Eγ,iso correlation (Liang et al. 2010), seems consistent with the concept that a high value of γ0 is required for both LAT detection and long-lived soft γ-ray afterglow emission.
GRB 120711A and GRB 130427A (e.g. Laskar et al. 2013; Perley et al. 2014; Preece et al. 2014; Vestrand et al. 2014; Ackermann et al. 2014) are two powerful bursts with Eγ,iso ~ 1054 erg in the 1 keV−10 MeV energy range (about one order of magnitude higher than that estimated for GRB 041219A (McBreen et al. 2006; Götz et al. 2011)) and long-lived soft γ-ray afterglow emission (~10 ks for GRB 120711A and ~1 ks for GRB 130427A). The soft γ-ray detection from GRB 130427A is most likely limited by the Swift/BAT sensitivity considering that the LAT emission was detectable for longer than a day. In both GRBs the LAT emission seems to be consistent with synchrotron emission (Kouveliotou et al. 2013). Figure 10 shows the k-corrected isotropic luminosity light curves of GRB 120711A and GRB 130427A in the rest-frame energy band from 0.3−100 keV. Both afterglows are among the most luminous detected to date and show similar afterglow luminosities, with GRB 120711A being ~5 times brighter than GRB 130427A at 1 ks. At T0 + 1 ks GRB 120711A still had significant emission above 60 keV (Fig. 2) while most of the emission from GRB 130427A was detected in the 0.3−10 keV band. At later times, both GRBs become comparable, with GRB 120711A steepening at ~0.9 Ms because of a jet break, which is not evident in the light curve of GRB 130427A (Fig. 10). However, a jet break has been claimed for GRB 130427A at T0 +37 ks corresponding to a jet half-opening angle of ~3.4° (Maselli et al. 2014), which is compatible with the jet half-opening angle found for GRB 120711A.
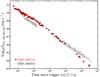 |
Fig. 10 Isotropic luminosity light curves for the afterglow emission of GRB 120711A and GRB 130427A in the rest-frame energy band from 0.3−100 keV. The light curve for GRB 120711A consists of data from INTEGRAL, Swift, and XMM-Newton. All data points for GRB 130427A were measured with the Swift/XRT instrument using data obtained from http://www.swift.ac.uk. |
7. Conclusions
GRB 120711A triggered by INTEGRAL was observed as a bright (32 ph cm-2 s-1 in the 20 keV−8 MeV band) and hard (Epeak ~ 1 MeV) GRB with a duration of ~115 s and showed unprecedented long-lasting soft γ-ray emission above 60 keV until 3 ks post-trigger and above 20 keV for at least 10 ks. The burst was also detected by Fermi/LAT in observations that started 300 s post-trigger. A powerful optical flash was observed peaking at an R magnitude of ~11.5 at ~T0 + 126 s that is consistent with a reverse shock with contribution from the masked forward shock peak. GRB 120711A was found to be highly absorbed with AV ~ 0.85 in the GRB rest-frame. The X-ray afterglow was monitored using Swift, XMM-Newton, and Chandra with observations spanning the range from ~8 ks to ~7 Ms. Spectroscopic observations of the optical afterglow located the GRB at a redshift of 1.405, yielding an isotropic energy of ~1054 erg in the rest-frame energy band from 1 keV to 10 MeV.
The extended γ-ray emission is explained by forward shocks, except for the first ~300 s when late activity from the central engine seems to be present. Therefore, GRB 120711A does not appear to be part of the newly proposed ultra-long GRB population (e.g. Levan et al. 2014). This hypothesis is also supported by the resemblance of the light curve seen by Swift/XRT in the softer energy band of 0.3−10 keV and the consistence of the estimated EX,iso from the IBIS data to the EX,iso − Eγ,iso − Epeak correlation.
The combined optical/NIR, X-ray and γ-ray afterglow light curve was adequately modelled as synchrotron emission in an intermediate ISM-wind environment with a density profile of k ~ 1.2. At ~0.9 Ms after the trigger, the afterglow light curve shows evidence of a jet break corresponding to a jet half-opening angle of 2°−5°.
The detection of GRB 120711A by Fermi/LAT is consistent with the observed trend that LAT GRBs have high Lorentz factors and stratified wind-like environments. In particular, GRB 120711A has a Lorentz factor between 120−340, with a mass-loss rate between ~10-5−10-6 M⊙ yr-1 depending on the radiation efficiency range considered. The baryon load is ~10-5−10-6 M⊙, consistent with that expected in the fireball model when the emission is highly relativistic.
At this time GRB 120711A is the only GRB with soft γ-ray emission (>20 keV) detected up to 10 ks after the trigger. The recently detected GRB 130427A also has long-lasting emission above 20 keV, although only for ~1 ks. The lack of long-lasting soft γ-ray emission from INTEGRAL GRBs with higher peak fluxes than GRB 120711A such as GRB 041219A indicates that brightness is not the primary factor in the presence of such long-lived soft γ-ray emission. Both GRB 120711A and GRB 130427A have high isotropic energies and high Lorentz factors. GRB 080723B is the only other bright GRB detected simultaneously with INTEGRAL–Fermi/LAT, and it does not have the properties associated with GRB 120711A and GRB 130427A. The existence of LAT emission and high Lorentz factors seems to be a requirement to produce soft γ-ray afterglow emission. Additionally, the fact that GRB 120711A and GRB 130427A had reverse shocks also suggests that these properties can be important in the production of harder afterglow emission.
Online material
Appendix A : Logs of the optical/NIR observations of GRB 120711A
Watcher observations of the afterglow of GRB 120711A.
PROMPT observations of the afterglow of GRB 120711A.
GROND observations of the afterglow of GRB 120711A.
REM observations of the afterglow of GRB 120711A.
The underscript “th” is used to indicate expected values from the closure relations.
Acknowledgments
We would like to thank the referee for helpful comments and suggestions. We would also like to thank N. Tanvir (Leicester) for his useful comments on the redshift measurement. This research is based on observations with INTEGRAL, an ESA project with instruments and science data centre funded by ESA member states (especially the PI countries: Denmark, France, Germany, Italy, Switzerland, Spain), Poland and with the participation of Russia and the USA. The XMM-Newton project is an ESA Science Mission with instruments and contributions directly funded by ESA Member States and the USA (NASA). This work made use of data supplied by the UK Swift Science Data Centre at the University of Leicester. This research has made use of the XRT Data Analysis Software (XRTDAS) developed under the responsibility of the ASI Science Data Centre (ASDC), Italy; and of Fermi data, a NASA project with international collaboration from France, Japan, Italy, and Sweden. The scientific results reported in this article are partly based on data obtained from the Chandra Data Archive. We would like to thank N. Schartel and the anonymous TAC member who carefully studied our ToO proposal to follow this GRB. A.M.C. and L.H. acknowledge support from Science Foundation Ireland under grant 09/RFP/AST/2400 and L.H. and C.W. from 11/RFP/AST/3188. L.H. and M.T. acknowledge support from the EU FP7 under grant number 283783. T.K. acknowledges support by the European Commission under the Marie Curie Intra-European Fellowship Programme. The Dark Cosmology Centre is funded by the Danish National Research Foundation. Part of the funding for GROND (both hardware and personnel) was generously granted from the Leibniz-Prize to G. Hasinger (DFG grant HA 1850/28-1). A.R. acknowledges support by the Thüringer Landessternwarte Tautenburg. P.S. acknowledges support through the Sofja Kovalevskaja Award from the Alexander von Humboldt Foundation of Germany. S.K. acknowledge support by DFG grant Kl 766/16-1. D.A.K. acknowledges support by the DFG cluster of excellence “Origin and Structure of the Universe”. We acknowledge the excellent support of INTEGRAL project scientist Chris Winkler.
References
- Ackermann, M., Ajello, M., Asano, K., et al. 2013, ApJS, 209, 11 [NASA ADS] [CrossRef] [Google Scholar]
- Ackermann, M., Ajello, M., Asano, K., et al. 2014, Science, 343, 42 [NASA ADS] [CrossRef] [PubMed] [Google Scholar]
- Aihara, H., Allen de Prieto, C., An, D., et al. 2011, ApJS, 193, 29 [NASA ADS] [CrossRef] [Google Scholar]
- Atwood, W. B., Abdo, A. A., Ackermann, M., et al. 2009, ApJ, 697, 1071 [NASA ADS] [CrossRef] [Google Scholar]
- Bernardini, M. G., Margutti, R., Chincarini, G., Guidorzi, C., & Mao, J. 2011, A&A, 526, A27 [NASA ADS] [CrossRef] [EDP Sciences] [Google Scholar]
- Bernardini, M. G., Margutti, R., Zaninoni, E., & Chincarini, G. 2012, MNRAS, 425, 1199 [NASA ADS] [CrossRef] [Google Scholar]
- Bozzo, E., Götz, D., Mereghetti, S., et al. 2012, GRB Coordinates Network, Circular Service, 13435 [Google Scholar]
- Burenin, R. A., Vikhlinin, A. A., Gilfanov, M. R., et al. 1999a, A&A, 344, L53 [NASA ADS] [Google Scholar]
- Burenin, R. A., Vikhlinin, A. A., Terekhov, O. V., et al. 1999b, A&AS, 138, 443 [NASA ADS] [CrossRef] [EDP Sciences] [Google Scholar]
- Burrows, D. N. 2005, Science, 309, 1833 [NASA ADS] [CrossRef] [PubMed] [Google Scholar]
- Burrows, D. N., Hill, J. E., Nousek, J. A., et al. 2005, Space Sci. Rev., 120, 165 [NASA ADS] [CrossRef] [Google Scholar]
- Cardelli, J. A., Clayton, G. C., & Mathis, J. S. 1989, ApJ, 345, 245 [NASA ADS] [CrossRef] [Google Scholar]
- Cenko, S. B., Frail, D. A., Harrison, F. A., et al. 2011, ApJ, 732, 29 [NASA ADS] [CrossRef] [Google Scholar]
- Chevalier, R. A., & Li, Z.-Y. 1999, ApJ, 520, L29 [NASA ADS] [CrossRef] [Google Scholar]
- Chevalier, R. A., & Li, Z.-Y. 2000, ApJ, 536, 195 [NASA ADS] [CrossRef] [Google Scholar]
- Chincarini, G., Mao, J., Margutti, R., et al. 2010, MNRAS, 406, 2113 [NASA ADS] [CrossRef] [Google Scholar]
- Connaughton, V. 2002, ApJ, 567, 1028 [NASA ADS] [CrossRef] [Google Scholar]
- Covino, S., Stefanon, M., Sciuto, G., et al. 2004, in Ground-based Instrumentation for Astronomy, eds. A. F. M. Moorwood, & M. Iye, Proc. SPIE, 5492, 1613 [Google Scholar]
- Covino, S., Melandri, A., Salvaterra, R., et al. 2013, MNRAS, 432, 1231 [NASA ADS] [CrossRef] [Google Scholar]
- De Angelis, A. 2001, in Proc. New worlds in astroparticle physics (Singapore: World Scientific), 140 [Google Scholar]
- De Pasquale, M., Schulze, S., Kann, D. A., Oates, S., & Zhang, B. 2013, EAS Pub. Ser., 61, 217 [CrossRef] [EDP Sciences] [Google Scholar]
- Elliott, J., Klose, S., & Greiner, J. 2012, GRB Coordinates Network, Circular Service, 13438 [Google Scholar]
- Evans, P. A., Beardmore, A. P., Page, K. L., et al. 2007, A&A, 469, 379 [NASA ADS] [CrossRef] [EDP Sciences] [Google Scholar]
- Evans, P. A., Beardmore, A. P., Page, K. L., et al. 2009, MNRAS, 397, 1177 [NASA ADS] [CrossRef] [Google Scholar]
- Evans, P. A., Willingale, R., Osborne, J. P., et al. 2014, MNRAS, submitted [arXiv:1403.4079] [Google Scholar]
- Fenimore, E., & Sumner, M. C. 1997, All-Sky X-Ray Observations in the Next Decade, eds. M. Matsuka & N. Kawai, 167 [Google Scholar]
- Ferrero, A., Hanlon, L., Felletti, R., et al. 2010, Adv. Astron., 2010, 715237 [NASA ADS] [CrossRef] [Google Scholar]
- Filgas, R., Greiner, J., Schady, P., et al. 2011, A&A, 535, A57 [NASA ADS] [CrossRef] [EDP Sciences] [Google Scholar]
- Fitzpatrick, G. 2012, in Proceedings of the Gamma-ray Bursts 2012 Conference, Munich (Germany), Proceedings of Science, 24 available at http://pos.sissa.it/cgi-bin/reader/conf.cgi?confid=152 [Google Scholar]
- Foley, S., McGlynn, S., Hanlon, L., McBreen, S., & McBreen, B. 2008, A&A, 484, 143 [NASA ADS] [CrossRef] [EDP Sciences] [Google Scholar]
- Frail, D. A., Kulkarni, S. R., Sari, R., et al. 2001, ApJ, 562, L55 [NASA ADS] [CrossRef] [Google Scholar]
- Frederiks, D. D., Hurley, K., Svinkin, D. S., et al. 2013, ApJ, 779, 151 [Google Scholar]
- French, J., Hanlon, L., McBreen, B., et al. 2004, AIP Conf. Proc., 727, 741 [Google Scholar]
- Garmire, G. P., Bautz, M. W., Ford, P. G., Nousek, J. A., & Ricker, G. R. 2003, X-Ray and Gamma-Ray Telescopes and Instruments for Astronomy, ed. J. E. Truemper, Proc. SPIE, 4851, 28 [Google Scholar]
- Gehrels, N., Chincarini, G., Giommi, P., et al. 2004, ApJ, 611, 1005 [NASA ADS] [CrossRef] [Google Scholar]
- Gendre, B., Stratta, G., Atteia, J. L., et al. 2013, ApJ, 766, 30 [NASA ADS] [CrossRef] [Google Scholar]
- Genet, F., Daigne, F., & Mochkovitch, R. 2007, MNRAS, 381, 732 [NASA ADS] [CrossRef] [Google Scholar]
- Genet, F., & Granot, J. 2009, MNRAS, 399, 1328 [NASA ADS] [CrossRef] [Google Scholar]
- Ghirlanda, G., Ghisellini, G., Firmani, C., et al. 2006, A&A, 452, 839 [NASA ADS] [CrossRef] [EDP Sciences] [Google Scholar]
- Ghirlanda, G., Nava, L., Ghisellini, G., & Firmani, C. 2007, A&A, 466, 127 [NASA ADS] [CrossRef] [EDP Sciences] [Google Scholar]
- Ghirlanda, G., Nava, L., Ghisellini, G., et al. 2012, MNRAS, 420, 483 [NASA ADS] [CrossRef] [Google Scholar]
- Ghisellini, G., Ghirlanda, G., Nava, L., & Celotti, A. 2010, MNRAS, 403, 926 [NASA ADS] [CrossRef] [Google Scholar]
- Giblin, T. W., van Paradijs, J., Kouveliotou, C., et al. 1999, ApJ, 524, L47 [NASA ADS] [CrossRef] [Google Scholar]
- Giblin, T. W., Connaughton, V., van Paradijs, J., et al. 2002, ApJ, 570, 573 [NASA ADS] [CrossRef] [Google Scholar]
- Giuliani, A., & Mereghetti, S. 2014, A&A, 563, A6 [NASA ADS] [CrossRef] [EDP Sciences] [Google Scholar]
- Goldstein, A., Burgess, J. M., Preece, R. D., et al. 2012, ApJS, 199, 19 [NASA ADS] [CrossRef] [Google Scholar]
- Götz, D., Covino, S., Hascoët, R., et al. 2011, MNRAS, 413, 2173 [NASA ADS] [CrossRef] [Google Scholar]
- Götz, D., Mereghetti, S., Bozzo, E., et al. 2012, GRB Coordinates Network, Circular Service, 13434 [Google Scholar]
- Granot, J., & Sari, R. 2002, ApJ, 568, 820 [NASA ADS] [CrossRef] [Google Scholar]
- Grebenev, S. A., & Chelovekov, I. V. 2007, Astron. Lett., 33, 789 [NASA ADS] [CrossRef] [Google Scholar]
- Greiner, J., Bornemann, W., Clemens, C., et al. 2008, PASP, 120, 405 [NASA ADS] [CrossRef] [Google Scholar]
- Greiner, J., Krühler, T., Klose, S., et al. 2011, A&A, 526, A30 [NASA ADS] [CrossRef] [EDP Sciences] [Google Scholar]
- Grupe, D., Gronwall, C., Wang, X.-Y., et al. 2007, ApJ, 662, 443 [NASA ADS] [CrossRef] [Google Scholar]
- Grupe, D., Burrows, D. N., Wu, X.-F., et al. 2010, ApJ, 711, 1008 [NASA ADS] [CrossRef] [Google Scholar]
- Hancock, P., Murphy, T., Gaensler, B., et al. 2012, GRB Coordinates Network, Circular Service, 13485, 1 [Google Scholar]
- Hanlon, L., Martin-Carrillo, A., Zhang, X. L., & von Kienlin, A. 2012, GRB Coordinates Network, Circular Service, 13468 [Google Scholar]
- Henden, A. A., Levine, S. E., Terrell, D., Smith, T. C., & Welch, D. L. 2011, in Am. Astron. Soc. Meet. Abstr. #218, BAAS, 43, 126.01 [Google Scholar]
- Hurley, K., Dingus, B. L., Mukherjee, R., et al. 1994, Nature, 372, 652 [NASA ADS] [CrossRef] [Google Scholar]
- Jansen, F., Lumb, D., Altieri, B., et al. 2001, A&A, 365, L1 [NASA ADS] [CrossRef] [EDP Sciences] [Google Scholar]
- Jin, Z. P., & Fan, Y. Z. 2007, MNRAS, 378, 1043 [NASA ADS] [CrossRef] [Google Scholar]
- Kalberla, P. M. W., Burton, W. B., Hartmann, D., et al. 2005, A&A, 440, 775 [NASA ADS] [CrossRef] [EDP Sciences] [Google Scholar]
- Kaneko, Y., Preece, R. D., Briggs, M. S., et al. 2006, ApJSS, 166, 298 [NASA ADS] [CrossRef] [Google Scholar]
- Kann, D. A., Klose, S., & Zeh, A. 2006, ApJ, 641, 993 [NASA ADS] [CrossRef] [Google Scholar]
- Kann, D. A., Klose, S., Zhang, B., et al. 2010, ApJ, 720, 1513 [NASA ADS] [CrossRef] [Google Scholar]
- Kobayashi, S., & Zhang, B. 2003, ApJ, 597, 455 [NASA ADS] [CrossRef] [Google Scholar]
- Kocevski, D., Vianello, G., Omodei, N., & Digel, S. 2012, GRB Coordinates Network, Circular Service, 13452 [Google Scholar]
- Kouveliotou, C., Granot, J., Racusin, J. L., et al. 2013, ApJ, 779, L1 [NASA ADS] [CrossRef] [Google Scholar]
- Krühler, T., Küpcü Yoldaş, A., Greiner, J., et al. 2008, ApJ, 685, 376 [NASA ADS] [CrossRef] [Google Scholar]
- Kumar, P., & Barniol Duran, R. 2009, MNRAS, 400, L75 [NASA ADS] [CrossRef] [Google Scholar]
- Kumar, P., & Panaitescu, A. 2000a, ApJ, 541, L51 [NASA ADS] [CrossRef] [Google Scholar]
- Kumar, P., & Panaitescu, A. 2000b, ApJ, 541, L9 [NASA ADS] [CrossRef] [Google Scholar]
- Küpcü Yoldaş, A., Krühler, T., Greiner, J., et al. 2008, in AIP Conf. Proc. 1000, eds. M. Galassi, D. Palmer, & E. Fenimore, 227 [Google Scholar]
- LaCluyzé, A., Haislip, J., Ivarsen, K., et al. 2012, GRB Coordinates Network, Circular Service, 13430 [Google Scholar]
- Langer, N. 1989, A&A, 220, 135 [NASA ADS] [Google Scholar]
- Laskar, T., Berger, E., Zauderer, B. A., et al. 2013, ApJ, 776, 119 [NASA ADS] [CrossRef] [Google Scholar]
- Lebrun, F., Leray, J. P., Lavocat, P., et al. 2003, A&A, 411, L141 [NASA ADS] [CrossRef] [EDP Sciences] [Google Scholar]
- Levan, A. J., Tanvir, N. R., Starling, R. L. C., et al. 2014, ApJ, 781, 13 [NASA ADS] [CrossRef] [Google Scholar]
- Leventis, K., Wijers, R. A. M. J., & van der Horst, A. J. 2014, MNRAS, 437, 2448 [NASA ADS] [CrossRef] [Google Scholar]
- Liang, E., & Zhang, B. 2005, ApJ, 633, 611 [NASA ADS] [CrossRef] [Google Scholar]
- Liang, E.-W., Yi, S.-X., Zhang, J., et al. 2010, ApJ, 725, 2209 [NASA ADS] [CrossRef] [Google Scholar]
- Lund, N., Budtz-Jørgensen, C., Westergaard, N. J., et al. 2003, A&A, 411, L231 [NASA ADS] [CrossRef] [EDP Sciences] [Google Scholar]
- Maiorano, E., Masetti, N., Palazzi, E., et al. 2005, A&A, 438, 821 [NASA ADS] [CrossRef] [EDP Sciences] [Google Scholar]
- Margutti, R., Guidorzi, C., Chincarini, G., et al. 2010, MNRAS, 406, 2149 [NASA ADS] [CrossRef] [Google Scholar]
- Margutti, R., Chincarini, G., Granot, J., et al. 2011, MNRAS, 417, 2144 [NASA ADS] [CrossRef] [Google Scholar]
- Margutti, R., Zaninoni, E., Bernardini, M. G., et al. 2013, MNRAS, 428, 729 [NASA ADS] [CrossRef] [Google Scholar]
- Martin-Carrillo, A., & Hanlon, L. 2013, Proceedings of the 9th INTEGRAL Workshop, Paris (France), PoS, 176, 121 [arXiv:1302.0560] [Google Scholar]
- Maselli, A., Melandri, A., Nava, L., et al. 2014, Science, 343, 48 [NASA ADS] [CrossRef] [Google Scholar]
- McBreen, S., Hanlon, L., McGlynn, S., et al. 2006, A&A, 455, 433 [NASA ADS] [CrossRef] [EDP Sciences] [Google Scholar]
- McBreen, S., Krühler, T., Rau, A., et al. 2010, A&A, 516, A71 [NASA ADS] [CrossRef] [EDP Sciences] [Google Scholar]
- Mészáros, P. 2006, Rep. Prog. Phys., 69, 2259 [NASA ADS] [CrossRef] [Google Scholar]
- Molinari, E., Vergani, S. D., Malesani, D., et al. 2007, A&A, 469, L13 [NASA ADS] [CrossRef] [EDP Sciences] [Google Scholar]
- Nousek, J. A., Kouveliotou, C., Grupe, D., et al. 2006, ApJ, 642, 389 [NASA ADS] [CrossRef] [Google Scholar]
- Panaitescu, A., & Kumar, P. 2002, ApJ, 571, 779 [NASA ADS] [CrossRef] [Google Scholar]
- Panaitescu, A., Meszaros, P., Burrows, D., et al. 2006, MNRAS, 369, 2059 [NASA ADS] [CrossRef] [Google Scholar]
- Peng, F.-K., Hu, Y.-D., Xi, S.-Q., et al. 2013, ApJL, submitted [arXiv:1302.4876] [Google Scholar]
- Perley, D. A., Cenko, S. B., Corsi, A., et al. 2014, ApJ, 781, 37 [NASA ADS] [CrossRef] [Google Scholar]
- Piran, T. 2005, Rev. Mod. Phys., 76, 1 [Google Scholar]
- Preece, R., Burgess, J. M., von Kienlin, A., et al. 2014, Science, 343, 51 [NASA ADS] [CrossRef] [Google Scholar]
- Racusin, J. L., Liang, E. W., Burrows, D. N., et al. 2009, ApJ, 698, 43 [NASA ADS] [CrossRef] [Google Scholar]
- Racusin, J. L., Oates, S. R., Schady, P., et al. 2011, ApJ, 738, 138 [NASA ADS] [CrossRef] [Google Scholar]
- Reichart, D., Nysewander, M., Moran, J., et al. 2005, Il Nuovo Cimento C, 28, 767 [Google Scholar]
- Rossi, A., Schulze, S., Klose, S., et al. 2011, A&A, 529, A142 [NASA ADS] [CrossRef] [EDP Sciences] [Google Scholar]
- Sagi, E., & Nakar, E. 2012, ApJ, 749, 80 [NASA ADS] [CrossRef] [Google Scholar]
- Sari, R., & Piran, T. 1999, ApJ, 520, 641 [NASA ADS] [CrossRef] [Google Scholar]
- Sari, R., Piran, T., & Narayan, R. 1998, ApJ, 497, L17 [NASA ADS] [CrossRef] [Google Scholar]
- Schlegel, D. J., Finkbeiner, D. P., & Davis, M. 1998, ApJ, 500, 525 [NASA ADS] [CrossRef] [Google Scholar]
- Schulze, S., Klose, S., Björnsson, G., et al. 2011, A&A, 526, A23 [NASA ADS] [CrossRef] [EDP Sciences] [Google Scholar]
- Skrutskie, M. F., Cutri, R. M., Stiening, R., et al. 2006, AJ, 131, 1163 [NASA ADS] [CrossRef] [Google Scholar]
- Starling, R. L. C., van der Horst, A. J., Rol, E., et al. 2008, ApJ, 672, 433 [NASA ADS] [CrossRef] [Google Scholar]
- Strüder, L., Briel, U., Dennerl, K., et al. 2001, A&A, 365, L18 [NASA ADS] [CrossRef] [EDP Sciences] [Google Scholar]
- Tam, P. H. T., Li, K. L., & Kong, A. K. H. 2012, GRB Coordinates Network, Circular Service, 13444 [Google Scholar]
- Tanvir, N. R., Wiersema, K., Levan, A. J., et al. 2012, GRB Coordinates Network, Circular Service, 13441 [Google Scholar]
- Thöne, C. C., de Ugarte Postigo, A., Fryer, C. L., et al. 2011, Nature, 480, 72 [NASA ADS] [CrossRef] [PubMed] [Google Scholar]
- Tody, D. 1993, ASP Conf. Ser., 52, 173 [Google Scholar]
- Topinka, M., Meehan, S., Martin-Carrillo, A., et al. 2009, in Proc. Extreme sky: Sampling the Universe above 10 keV, Otranto (Italy), PoS, 96, 48 available at http://pos.sissa.it/cgi-bin/reader/conf.cgi?confid=96 [NASA ADS] [Google Scholar]
- Turner, M. J. L., Abbey, A., Arnaud, M., et al. 2001, A&A, 365, L27 [NASA ADS] [CrossRef] [EDP Sciences] [Google Scholar]
- Uhm, Z. L., & Beloborodov, A. M. 2007, ApJ, 665, L93 [NASA ADS] [CrossRef] [Google Scholar]
- Vedrenne, G., Roques, J.-P., Schönfelder, V., et al. 2003, A&A, 411, L63 [NASA ADS] [CrossRef] [EDP Sciences] [Google Scholar]
- Vestrand, W. T., Wren, J. A., Panaitescu, A., et al. 2014, Science, 343, 38 [NASA ADS] [CrossRef] [Google Scholar]
- Vianello, G., Götz, D., & Mereghetti, S. 2009, A&A, 495, 1005 [NASA ADS] [CrossRef] [EDP Sciences] [Google Scholar]
- Virgili, F. J., Mundell, C. G., Pal’shin, V., et al. 2013, ApJ, 778, 54 [NASA ADS] [CrossRef] [Google Scholar]
- Watson, D., Hjorth, J., Fynbo, J. P. U., et al. 2007, ApJ, 660, L101 [NASA ADS] [CrossRef] [Google Scholar]
- Weisskopf, M. C., Brinkman, B., Canizares, C., et al. 2002, PASP, 114, 1 [NASA ADS] [CrossRef] [Google Scholar]
- Winkler, C., Courvoisier, T. J.-L., Cocco, G. D., et al. 2003, A&A, 411, L1 [NASA ADS] [CrossRef] [EDP Sciences] [Google Scholar]
- Wu, X.-F., Hou, S.-J., & Lei, W.-H. 2013, ApJ, 767, L36 [NASA ADS] [CrossRef] [Google Scholar]
- Zerbi, R. M., Chincarini, G., Ghisellini, G., et al. 2001, Astron. Nachr., 322, 275 [NASA ADS] [CrossRef] [Google Scholar]
- Zhang, B. 2006, in COSPAR Meeting, 36th COSPAR Scientific Assembly, 36, 77 [Google Scholar]
- Zhang, B. 2007, Chin. J. Astron. Astrophys., 7, 1 [Google Scholar]
- Zhang, B., Kobayashi, S., & Mészáros, P. 2003, ApJ, 595, 950 [NASA ADS] [CrossRef] [Google Scholar]
- Zhang, B., Fan, Y. Z., Dyks, J., et al. 2006, ApJ, 642, 354 [NASA ADS] [CrossRef] [Google Scholar]
- Zhang, B., Liang, E., Page, K. L., et al. 2007, ApJ, 989 [NASA ADS] [CrossRef] [Google Scholar]
- Zou, Y. C., Wu, X. F., & Dai, Z. G. 2005, MNRAS, 363, 93 [NASA ADS] [CrossRef] [Google Scholar]
All Tables
Best-fit temporal parameters for the long-lasting emission from GRB 120711A observed with IBIS.
Resulting parameters from the SED fit between optical/NIR and X-ray data at T0 + 26 ks using a broken power-law model.
Emission parameters obtained for GRB 120711A for two cases with different radiation efficiencies, ηγ.
All Figures
|
Fig. 1 Energy-resolved light curves of GRB 120711A. The top panel shows the 20−200 keV IBIS light curve that is severely affected by telemetry gaps. The lower panels show the SPI light curves in five energy bands. In all cases, the light curves are binned over 1 s. The vertical dashed line at T0 + 115 s represents the end of the T90 duration. |
| In the text | |
|
Fig. 2 Energy-resolved IBIS light curves of GRB 120711A with a maximum bin size of 1 ks. The solid lines represent the best-fit model to the data. In all cases, the light curves show the temporal behaviour in each band up to the time of the last significant detection (3σ above background). The upper three curves are re-normalised for display purposes. |
| In the text | |
|
Fig. 3 Top panel: X-ray light curve of the observed flux in the 0.3−10 keV band using Swift, XMM-Newton, and Chandra observations. The solid line corresponds to the best-fit model (broken power-law), while the dashed line shows the fit when a single power-law model is considered. Bottom panel: photon index evolution during the X-ray follow-up observations. The dashed line is the photon index (Γ = 2.06) obtained by the joint spectral fit to the IBIS and Swift data. The 1σ error (± 0.05) is shown as a grey area. |
| In the text | |
|
Fig. 4 Afterglow light curves of GRB 120711A as observed at soft γ-rays, X-rays, optical R-band and above 100 MeV. The vertical dashed lines give the break times observed in the soft γ/X-ray light curves that form the 4 temporal segments (I to IV). |
| In the text | |
|
Fig. 5 Multi-band optical/NIR light curve observed with Watcher, Skynet/PROMPT, GROND, and REM. The z′JHK bands are scaled for display purposes. |
| In the text | |
|
Fig. 6 R-band optical light curve of GRB 120711A. The best-fit model (solid line) consists of two components: a reverse shock (RS, dashed line) and a forward shock (FS, dash-dotted line). |
| In the text | |
|
Fig. 7 IBIS spectrum from 20 keV to 200 keV of GRB 120711A during segment I (T0 + 115 s to T0 + 130 s). The best-fit model is shown as a solid line. The model includes blackbody and power-law components that are shown as dashed and dotted lines. The bottom panel shows the residuals from the blackbody+power-law fit (dots) and the single power-law fit (diamonds). |
| In the text | |
|
Fig. 8 Broadband spectral fit from 0.3 keV to 45 keV during the time interval between
T0 +
2.5 ks and T0 + 20 ks using data from
Swift/XRT, JEM-X, and IBIS. The data are well fit by a single
power-law of Γ =
2.06 ± 0.05 that
includes soft X-ray absorption from our galaxy and an intrinsic absorption of
|
| In the text | |
|
Fig. 9 Spectral energy distributions at two different time intervals. The SED for IBIS and Fermi/LAT data from T0 + 300 s to T0 + 1050 s (light-grey stars), and the SED for GROND and Swift/XRT at T0 + 26 ks (black circles). The IBIS and Fermi/LAT data are also shown rescaled (dark-grey stars) to the GROND-Swift/XRT SED to illustrate the single-spectra component from X-rays to GeV. |
| In the text | |
|
Fig. 10 Isotropic luminosity light curves for the afterglow emission of GRB 120711A and GRB 130427A in the rest-frame energy band from 0.3−100 keV. The light curve for GRB 120711A consists of data from INTEGRAL, Swift, and XMM-Newton. All data points for GRB 130427A were measured with the Swift/XRT instrument using data obtained from http://www.swift.ac.uk. |
| In the text | |
Current usage metrics show cumulative count of Article Views (full-text article views including HTML views, PDF and ePub downloads, according to the available data) and Abstracts Views on Vision4Press platform.
Data correspond to usage on the plateform after 2015. The current usage metrics is available 48-96 hours after online publication and is updated daily on week days.
Initial download of the metrics may take a while.