Fig. 9
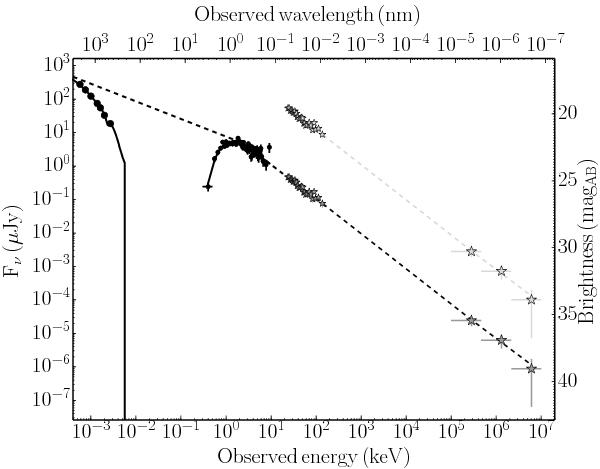
Spectral energy distributions at two different time intervals. The SED for IBIS and Fermi/LAT data from T0 + 300 s to T0 + 1050 s (light-grey stars), and the SED for GROND and Swift/XRT at T0 + 26 ks (black circles). The IBIS and Fermi/LAT data are also shown rescaled (dark-grey stars) to the GROND-Swift/XRT SED to illustrate the single-spectra component from X-rays to GeV.
Current usage metrics show cumulative count of Article Views (full-text article views including HTML views, PDF and ePub downloads, according to the available data) and Abstracts Views on Vision4Press platform.
Data correspond to usage on the plateform after 2015. The current usage metrics is available 48-96 hours after online publication and is updated daily on week days.
Initial download of the metrics may take a while.