Fig. 3
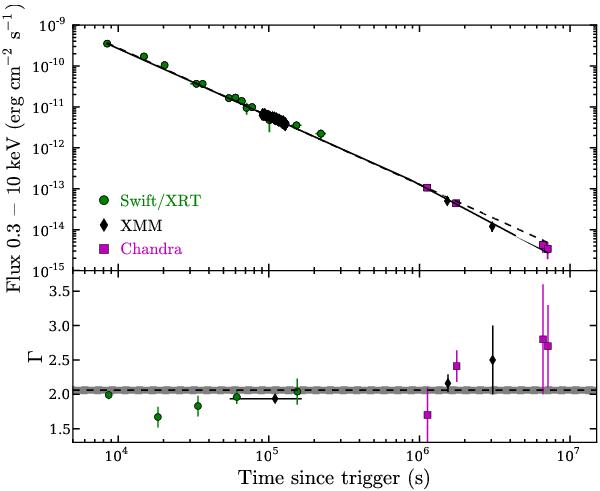
Top panel: X-ray light curve of the observed flux in the 0.3−10 keV band using Swift, XMM-Newton, and Chandra observations. The solid line corresponds to the best-fit model (broken power-law), while the dashed line shows the fit when a single power-law model is considered. Bottom panel: photon index evolution during the X-ray follow-up observations. The dashed line is the photon index (Γ = 2.06) obtained by the joint spectral fit to the IBIS and Swift data. The 1σ error (± 0.05) is shown as a grey area.
Current usage metrics show cumulative count of Article Views (full-text article views including HTML views, PDF and ePub downloads, according to the available data) and Abstracts Views on Vision4Press platform.
Data correspond to usage on the plateform after 2015. The current usage metrics is available 48-96 hours after online publication and is updated daily on week days.
Initial download of the metrics may take a while.