Fig. 1
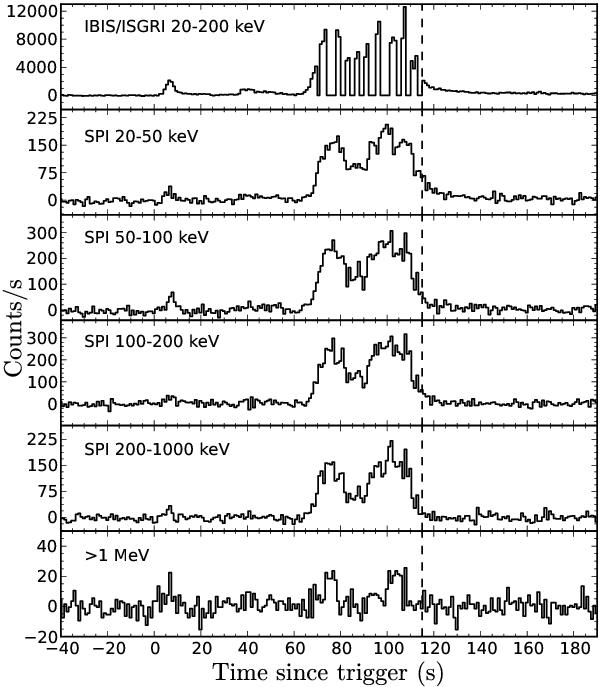
Energy-resolved light curves of GRB 120711A. The top panel shows the 20−200 keV IBIS light curve that is severely affected by telemetry gaps. The lower panels show the SPI light curves in five energy bands. In all cases, the light curves are binned over 1 s. The vertical dashed line at T0 + 115 s represents the end of the T90 duration.
Current usage metrics show cumulative count of Article Views (full-text article views including HTML views, PDF and ePub downloads, according to the available data) and Abstracts Views on Vision4Press platform.
Data correspond to usage on the plateform after 2015. The current usage metrics is available 48-96 hours after online publication and is updated daily on week days.
Initial download of the metrics may take a while.