Free Access
Fig. 4
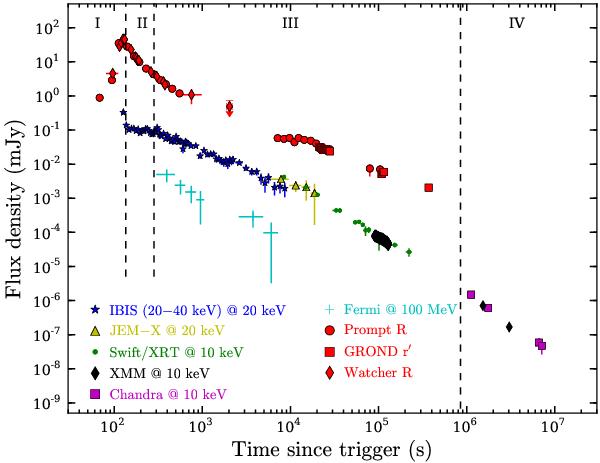
Afterglow light curves of GRB 120711A as observed at soft γ-rays, X-rays, optical R-band and above 100 MeV. The vertical dashed lines give the break times observed in the soft γ/X-ray light curves that form the 4 temporal segments (I to IV).
Current usage metrics show cumulative count of Article Views (full-text article views including HTML views, PDF and ePub downloads, according to the available data) and Abstracts Views on Vision4Press platform.
Data correspond to usage on the plateform after 2015. The current usage metrics is available 48-96 hours after online publication and is updated daily on week days.
Initial download of the metrics may take a while.