Fig. 2
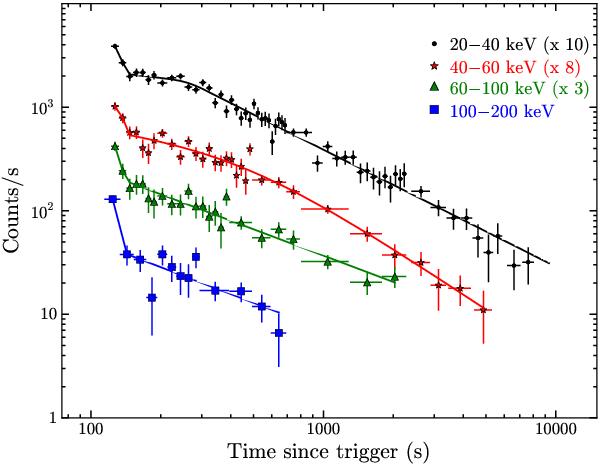
Energy-resolved IBIS light curves of GRB 120711A with a maximum bin size of 1 ks. The solid lines represent the best-fit model to the data. In all cases, the light curves show the temporal behaviour in each band up to the time of the last significant detection (3σ above background). The upper three curves are re-normalised for display purposes.
Current usage metrics show cumulative count of Article Views (full-text article views including HTML views, PDF and ePub downloads, according to the available data) and Abstracts Views on Vision4Press platform.
Data correspond to usage on the plateform after 2015. The current usage metrics is available 48-96 hours after online publication and is updated daily on week days.
Initial download of the metrics may take a while.