| Issue |
A&A
Volume 562, February 2014
|
|
|---|---|---|
| Article Number | A21 | |
| Number of page(s) | 25 | |
| Section | Extragalactic astronomy | |
| DOI | https://doi.org/10.1051/0004-6361/201322464 | |
| Published online | 31 January 2014 | |
Massive molecular outflows and evidence for AGN feedback from CO observations⋆,⋆⋆
1 Cavendish Laboratory, University of Cambridge, 19 J. J. Thomson Avenue, Cambridge CB3 0HE, UK
e-mail: This email address is being protected from spambots. You need JavaScript enabled to view it.
2 Kavli Institute for Cosmology, University of Cambridge, Madingley Road, Cambridge CB3 0HA, UK
3 Max Planck Institute für Extraterrestrische Physik (MPE), Giessenbachstraße 1, 85748 Garching, Germany
4 Institut de RadioAstronomie Millimétrique (IRAM), 300 rue de la Piscine, 38406 St. Martin d’Hères, Grenoble, France
5 Department of Earth and Space Sciences, Onsala Observatory, Chalmers University of Technology, 43992 Onsala, Sweden
6 Osservatorio Astronomico di Roma (INAF), via Frascati 33, 00040 Monteporzio Catone, Italy
7 Naval Research Laboratory, Remote Sensing Division, 4555 Overlook Ave SW, Washington, DC 20375, USA
8 Observatorio Astronómico Nacional (OAN), Observatorio de Madrid, Alfonso XII 3, 28014 Madrid, Spain
9 Universidad de Alcalá de Henares, Departamento de Física y Matemáticas, Campus Universitario, 28871 Alcalá de Henares, Madrid, Spain
10 California Institute of Technology, Mail Code 301-17, 1200 E. California Blvd., Pasadena, CA 91125, USA
11 Department of Astronomy, University of Maryland, College Park, MD 20742, USA
Received: 8 August 2013
Accepted: 7 November 2013
Abstract
We study the properties of massive, galactic-scale outflows of molecular gas and investigate their impact on galaxy evolution. We present new IRAM PdBI CO(1–0) observations of local ultra-luminous infrared galaxies (ULIRGs) and quasar-hosts: a clear signature of massive and energetic molecular outflows, extending on kpc scales, is found in the CO(1–0) kinematics of four out of seven sources, with measured outflow rates of several 100 M⊙ yr-1. We combine these new observations with data from the literature, and explore the nature and origin of massive molecular outflows within an extended sample of 19 local galaxies. We find that starburst-dominated galaxies have an outflow rate comparable to their star formation rate (SFR), or even higher by a factor of ~2–4, implying that starbursts can indeed be effective in removing cold gas from galaxies. Nevertheless, our results suggest that the presence of an active galactic nucleus (AGN) can boost the outflow rate by a large factor, which is found to increase with the LAGN/Lbol ratio. The gas depletion time scales due to molecular outflows are anti-correlated with the presence and luminosity of an AGN in these galaxies, and range from a few hundred million years in starburst galaxies down to just a few million years in galaxies hosting powerful AGNs. In quasar hosts, the depletion time scales due to the outflow are much shorter than the depletion time scales due to star formation. We estimate the outflow kinetic power and find that, for galaxies hosting powerful AGNs, it corresponds to about 5% of the AGN luminosity, as expected by models of AGN feedback. Moreover, we find that momentum rates of about 20 LAGN/c are common among the AGN-dominated sources in our sample. For “pure” starburst galaxies, our data tentatively support models in which outflows are mostly momentum-driven by the radiation pressure from young stars onto dusty clouds. Overall, our results indicate that, although starbursts are effective in powering massive molecular outflows, the presence of an AGN may strongly enhance such outflows, and therefore have a profound feedback effect on the evolution of galaxies by efficiently removing fuel for star formation, hence quenching star formation.
Key words: galaxies: active / galaxies: evolution / quasars: general / radio lines: ISM / ISM: molecules / galaxies: ISM
Appendix A is available in electronic form at http://www.aanda.org
The reduced datacubes are available at the CDS via anonymous ftp to cdsarc.u-strasbg.fr (130.79.128.5) or via http://cdsarc.u-strasbg.fr/viz-bin/qcat?J/A+A/562/A21
© ESO, 2014
1. Introduction
The recent discovery of massive, highly energetic, and kpc-scale molecular outflows in local AGN hosts and ultra-luminous infrared galaxies (ULIRGs; Feruglio et al. 2010; Fischer et al. 2010; Sturm et al. 2011; Alatalo et al. 2011; Aalto et al. 2012a; Cicone et al. 2012; Dasyra & Combes 2012; Nesvadba et al. 2010, 2011; Veilleux et al. 2013; Spoon et al. 2013; González-Alfonso et al. 2014; Combes et al. 2013) has provided strong evidence for negative feedback on star formation in action in galaxies (see also the review by Fabian 2012). The major breakthrough achieved by these studies is the confirmation that, regardless of the driving mechanism (AGN or star formation itself), these outflows affect the phase of the interstellar medium (ISM) out of which stars forms, i.e. the cold molecular gas. Therefore, such a feedback mechanism can have a significant impact on the evolution of the host galaxy, by regulating, through outflows, the amount of cold and dense gas available in the ISM for star formation and black hole accretion. In particular, negative feedback from quasars is believed to prevent massive galaxies from overgrowing (thus explaining the steep decline of the stellar mass function at high masses), to account for the “red-and-dead” properties of massive ellipticals (Cowie et al. 1996; Baldry et al. 2004; Pérez-González et al. 2008) and to drive the correlations between supermassive black holes and bulge properties that are observed in the local Universe (e.g. Magorrian et al. 1998; Marconi & Hunt 2003; Ferrarese & Ford 2005; Kormendy & Ho 2013).
Description of the IRAM PdBI CO(1–0) observations.
Indeed, most theoretical models propose that, during its bright active phase (“quasar-mode” feedback) characterised by a high accretion rate, the super massive black hole can expel the ISM out of the host galaxy, and it eventually clears the galaxy of its cold gas reservoir, although the details of the mechanism responsible for coupling the quasar radiation with the galactic ISM are still being debated (e.g. Silk & Rees 1998; Granato et al. 2004; Lapi et al. 2005; Di Matteo et al. 2005; Springel et al. 2005; Croton et al. 2006; Hopkins et al. 2008; Menci et al. 2008; Narayanan et al. 2008; Fabian et al. 2009; King 2010; Zubovas & King 2012; Faucher-Giguère & Quataert 2012).
While various techniques have been used to identify other phases of outflows in active galaxies, both locally (e.g. Rupke & Veilleux 2011, 2013b; Müller-Sánchez et al. 2011; Mullaney et al. 2013; Emonts et al. 2005; Morganti et al. 2003, 2005; Martin 2005; Soto et al. 2012; Rodríguez Zaurín et al. 2013) and at high redshift (e.g. Harrison et al. 2012; Cano-Díaz et al. 2012; Diamond-Stanic et al. 2012; Bradshaw et al. 2013; Alexander et al. 2010; Maiolino et al. 2012), the interferometric mapping of the high velocity component of CO millimetre emission has proved to be very effective. Indeed this method, as mentioned, allows us to directly trace outflows of the molecular phase out of which stars form, which in most galaxies also represents the bulk of the ISM; moreover the spectro-imaging information delivered by millimetre interferometers allows us to determine the size and geometry of the outflow, hence to accurately estimate the outflow rate and energetics.
In this work we aim to address some open questions: Are massive molecular outflows effective in quenching star formation in the host galaxy? Is the central AGN the dominant power source and, consequently, do AGNs control the growth and evolution of galaxies? Are current AGN-feedback models adequate for explaining observations?
In this paper we present new IRAM PdBI CO(1–0) observations for a sample of seven local active galaxies, aimed at identifying the presence of molecular outflows. Our new data are combined with previous results from our and other teams, with the goal of characterising the physical properties, origin, and nature of massive molecular outflows, and their impact on galaxy evolution.
A H0 = 70.4 km s-1 Mpc-1, ΩM = 0.27, ΩΛ = 0.73 cosmology is adopted throughout this work.
2. Sample selection and IRAM PdBI observations
We observed seven local active luminous and ultra-luminous infrared galaxies in their CO(1–0) molecular transition with the IRAM Plateau de Bure Interferometer. Since these are still exploratory observations, the sample has a mixed composition. Out of the seven sources, five are extracted from the SHINING project, which is a Herschel-PACS spectroscopic guaranteed time key programme, that targets starbursts, Seyfert galaxies, and (ultra) luminous infrared galaxies (Fischer et al. 2010; Sturm et al. 2011; Veilleux et al. 2013). Four of these ULIRGs, namely Mrk 273, IRAS F08572+3915, IRAS F10565+2448, and IRAS 23365+3604, show evidence in their far-IR spectrum of P-Cygni profiles of the OH transitions at 79 and 119 μm, which unambiguously trace molecular outflows (Sturm et al. 2011; Veilleux et al. 2013). In the other SHINING source, Mrk 876, as well as in the quasar I Zw 1, also observed with PACS in a cycle 1 open-time programme, OH is only detected in emission (Veilleux et al. 2013). These two sources are incorporated into our sample to investigate whether evidence of outflow is observed in CO emission, hence to test whether the detection of OH blue-shifted absorption is a pre-requisite for the presence of molecular outflows. Finally, IRAS F23060+0505 is one of the most powerful type 2 quasars, and, by observing it, we aim to investigate the presence of molecular outflows in this class of very powerful, but heavily embedded objects. The list of targets is given in Table 1.
Observations of the CO(1–0) rotational transition (νrest = 115.271 GHz) were performed with the IRAM Plateau de Bure Interferometer (PdBI) between May 2010 and July 2012. A technical description of the observational parameters is provided in Table 1. In the compact (D) array configuration, only five of the 15 m antennas were used, while observations in C configuration were carried out with the complete array (6 antennas). Data calibration and analysis were performed by using the CLIC and MAPPING softwares within the GILDAS package. The flux calibration accuracy at these frequencies is about 10% (Castro-Carrizo & Neri 2010). We exploited the wide-band (WideX) correlator offered by the PdBI, which provides a spectral resolution of 1.95 MHz (corresponding, at an average observed frequency of ~110 GHz, to channel widths of ~5.3 km s-1) over its full bandwidth of 3.6 GHz. For display purposes, we bin the spectra using a re-binning factor that varies, from source to source, from 5 to 20 channels.
Integrated fluxes and spatial extensions of the CO(1–0) broad wings.
3. Results
3.1. Criterion for molecular outflow detection
The adopted criterion for claiming the detection of a molecular outflow is that at least two of the following conditions must be satisfied:
-
1.
CO(1–0) emission with velocities higher than 500 km s-1 is detected in the interferometric continuum-subtracted maps with a significance of at least 5σ;
-
2.
Broad CO(1–0) wings with velocities higher than 300 km s-1 are detected in the interferometric continuum-subtracted maps with a significance of at least 5σand are found to deviate from the rotational pattern (for example, in the position–velocity diagram);
-
3.
A molecular outflow has been already detected through P-Cygni profiles of molecular transitions (e.g. OH, H2O).
This criterion selects only those galaxies for which unambiguous evidence of molecular outflows is found. Sources that only meet Conditions 1 or 2 may also be hosting a powerful molecular outflow, but additional observational evidence is needed in order to exclude that the high velocity CO emission is tracing other mechanisms, such as gas rotation, infalls, or disturbed gas kinematics due to an ongoing galaxy merging.
According to the criterion outlined above, we find evidence of massive molecular outflows in the CO(1–0) data for four out of seven galaxies in our sample: IRAS F08572+3915, IRAS F10565+2448, IRAS 23365+3604, and Mrk 273. They also exhibit prominent OH (79 and 119 μm) P-Cygni profiles in their Herschel-PACS spectra (Sturm et al. 2011; Veilleux et al. 2013). This proves that, once the presence of a molecular outflow has been assessed by the detection of blue-shifted OH absorption, interferometric CO observations are a very successful complementary technique for studying the characteristics of the molecular outflow in more detail, allowing us to directly estimate the mass and size of the outflow, hence derive other important properties (outflow rates, kinetic energy, momentum rates, etc.). In the powerful Type 2 quasar IRAS F23060+0505, we detect, at high significance, broad CO(1–0) wings with | v | > 300 km s-1, which deviate from the rotation pattern in the PV diagram. IRAS F23060+0505 therefore meets one of the conditions mentioned above and is very likely to host a massive molecular outflow. However, since gas at | v | > 500 km s-1 is only marginally detected, and since IRAS F23060+0505 was not observed by Herschel, this source does not fully qualify as a molecular outflow “detection”. The two remaining AGN-host galaxies of our sample, Mrk 876 and I Zw 1, do not fully meet any of these conditions for detecting molecular outflows, although in the case of Mrk 876 we do observe some marginal evidence of high velocity and spatially extended CO(1–0) emission. In the absence of additional observational evidence and of better quality data, we used our CO(1–0) observations to estimate, for IRAS F23060+0505, Mrk 876 and I Zw 1, upper limits on the mass of molecular outflowing gas, on the outflow rates, and on other outflow properties.
3.2. Deriving physical properties of molecular outflows
Our approach to analysing the broad wings of the CO(1–0) emission lines in the seven sources is similar to the one adopted for studying the massive outflows detected in the CO(1–0) and CO(2–1) transitions in Mrk 231 (Feruglio et al. 2010; Cicone et al. 2012) and in the [CII] 158 μm line in the high redshift quasar SDSS J1148+5152 (Maiolino et al. 2012).
Our method for estimating the integrated flux and the spatial extension of the CO(1–0) wings relies almost exclusively on the analysis of the uv visibility data, therefore producing results that are independent of aperture effects and of the cleaning process. More specifically, we first estimate the 3 mm continuum emission from the line-free frequency ranges in our wide-band (WideX) observations, and then subtract it directly from the uv data. We then average the frequency channels corresponding to the CO(1–0) wings, therefore producing uv tables for both the blue- and the red-shifted CO wing, which are used to estimate the integrated flux and the size of the CO wings.
To infer the flux (both for the core of the line and for the wings), we bin the visibility vs. uv radius plots (hereafter simply referred to as “uv” plots) in baseline steps of 20 m, and use the visibility amplitude of the first point of this plot, which approximates the total flux (i.e. the flux that would be measured at a zero antenna separation). To infer the spatial extent of the wings, we fit the uv plot with a circular Gaussian model, and use the resulting FWHM as an estimate of the size (diameter) of the CO wings emission. We stress that this technique, based on the uv data rather than on the interferometric deconvolved maps, allows us to estimate the size of structures that are comparable to the synthesised beam, on condition that the signal from the source is detected at least at 8σ significance. Moreover, the advantage of working directly in the uv plane for estimating the fluxes and the sizes is that at this level no alterations are made on the flux distribution as consequence of the “cleaning” process. The fluxes and sizes inferred for the broad CO wings of our seven sources are listed in Table 2. For I Zw 1, where CO(1–0) broad wings are not detected1, we provide upper limits.
We use the quantities listed in Table 2 to derive physically relevant outflow properties: outflow molecular gas masses, mass-loss rates, molecular gas depletion time scales due to the outflow, kinetic powers, and momentum rates of the molecular outflows, as detailed in the following. Outflow rates and energetics are estimated by adopting the same method as for Mrk 231 (Feruglio et al. 2010), NGC 6240 (Feruglio et al. 2013a,b), and SDSS J1148+5152 (Maiolino et al. 2012). We refer to those papers for an exhaustive description of our outflow model and its implications. Here, we only briefly summarise the method.
The excitation study of the massive molecular outflow in the ULIRG Mrk 231 indicated that the bulk of the molecular gas in the galaxy and the outflowing gas have roughly similar excitation (Cicone et al. 2012; Feruglio et al., in prep.). A direct implication of this result is that, to evaluate the molecular outflow mass from the CO luminosity of the broad wings, a better choice would be to use the standard ULIRG CO-to-H2 conversion factor, rather than the lower, more conservative value assumed in Feruglio et al. (2010). A similar result has been found in M 82, where a detailed modelling of the conversion factor of the gas in the outflow has been performed by Weiß et al. (2001) and Walter et al. (2002). As a consequence, we adopt αCO(1 − 0) = 0.8 M⊙(K km s-1 pc2)-1 for all molecular outflows treated in this paper.
As already mentioned, for the galaxies of our PdBI sample, as well as for Mrk 231 and NGC 6240, we assume the same spherical, or multi-conical, geometry as in Maiolino et al. (2012). As discussed in that paper, if the outflowing clouds are assumed to uniformly populate the spherical (or multi-conical) region affected by the outflow, then the outflow rate is given by the relation: 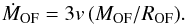 (1)This formula provides an appropriate description if the outflow is continuously refilled with clouds ejected from the galactic gaseous disk, as expected in feedback scenarios. However, if the outflow is instead associated with a single explosive event, in which the clouds are ejected, then the outflow rate is more properly described by the gas mass of the clouds divided by the dynamical time required by the clouds to reach the current location, resulting in an outflow rate that is one third of the one given by Eq. (1). Higher angular resolution data would be required to distinguish between these two possible scenarios and, in particular, between a uniform distribution of clouds within outflow cones (former scenario, described by Eq. (1)) and a shell-like geometry (latter scenario).
The data available so far for our sources (including the well-studied Mrk 231), are more consistent with a uniform outflow, rather than with the shell-like explosive scenario, so in this work we adopt the prescription given by Eq. (1). However, the reader should be aware that if future data favour an explosive-like (i.e. shell-like) scenario, then the figures for outflow rates, kinetic powers, and momentum rates may need to be revised downward. For some objects taken from the literature and discussed in Sect. 4, this seems to indeed be the case (and this is properly taken into account for determining the outflow rate for these sources). In Eq. (1) we conservatively use the average velocity in the range used to integrate the broad CO wings (rather than the maximum velocity, both listed in Table 4). We note that, if the outflowing gas intersects our line of sight (which is always true, as probed by the Herschel-PACS detection of OH P-Cygni profiles), Eq. (1) would provide a fairly accurate estimate of the outflow rate also in the case of a bi-conical wind geometry. The kinetic power and momentum rate of the outflow are simply calculated as  and
and  , respectively.
All the outflow properties described above are listed in Table 4 for the extended sample of galaxies, consisting of our seven sources observed with the PdBI and of an heterogeneous sample of 12 local galaxies hosting molecular outflows, drawn from the literature (further explanation in Sect. 4).
For IRAS F23060+0505 and Mrk 876, we use the values reported in Table 2 for flux and size of the CO wings to infer upper limits on the outflow properties. In the case of I Zw 1, the upper limits on the outflow parameters are calculated by using the upper limit that we estimate for the flux in the CO wings, listed in Table 2, and hypothetical values for the outflow extension (radius) of 0.5 kpc and for the velocity of 500 km s-1.
3.3. Analysis of the IRAM PdBI CO(1–0) observations
In the following we present our IRAM PdBI CO(1–0) observations of the seven local AGN-host galaxies listed in Table 1, mainly focussing on the evidence of broad CO(1–0) wings and their properties. For additional information about the individual sources and further discussion of our CO(1–0) observations we refer to Appendix A.
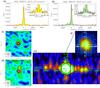 |
Fig. 1 Continuum-subtracted IRAM-PdBI spectra, maps, and position–velocity diagram of the CO(1–0) emission line of IRAS F08572+3915. Panels a) and b) show the spectra extracted from a circular aperture with diameter of 10 arcsec and from the central pixel (i.e. the centroid of the integrated CO emission), respectively. For display purposes, the spectra are re-binned in channels of 107 km s-1a) and 54 km s-1b). In both panels the narrow core of the line is fitted with a single Gaussian function (red dashed line). c), d) Map of the CO(1–0) emission integrated in the blue and red wings. Contours correspond to 1σ (1σ rms level of the two maps is 0.1 mJy beam-1). The physical scale at the redshift of the source is 1.122 kpc arcsec-1. The cross indicates the pointing and phase centre (i.e. the peak of the radio (VLBI) emission), which corresponds to the NW nucleus of the merging pair IRAS F08572+3915. e), f) Position–velocity diagram along the major axis of the molecular disk rotation (as traced by the narrow core of the CO(1–0) line). Inset f) highlights the rotation pattern traced by the narrow component of the CO(1–0) line. Contours are in steps of 1σ (up to 10σ) in panel e) and 5σ in panel f); negative contours are in steps of 1σ (magenta dashed lines). Each pixel corresponds to 0.9 arcsec × 90 km s-1 in diagram e), and to 0.3 arcsec × 30 km s-1 in the inset f). |
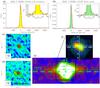 |
Fig. 2 Continuum-subtracted IRAM-PdBI spectra, maps, and position–velocity diagram of the CO(1–0) emission line of IRAS F10565+2448. Panels a) and b) show the spectra extracted from a circular aperture with a diameter of 10 arcsec and from the central pixel, respectively. For display purposes, the spectra are re-binned in channels of 27 km s-1. In both panels the narrow core of the line is fitted with a single Gaussian function (red dashed line). Note the appearance, in both spectra, of broad CO wings up to ±600 km s-1. c), d) Cleaned map of the emission integrated in the blue- and red-shifted CO(1–0) wings. Contours correspond to 1σ (1σ rms level of the two maps is 0.2 mJy beam-1). The cross indicates the peak of the radio (VLBI) emission. The physical scale at the redshift of the source is 0.846 kpc arcsec-1. e),f) Position–velocity diagram along the major axis of rotation. Inset f) highlights the rotation pattern traced by the narrow component of the CO(1–0) line. Contours are in steps of 1σ (up to 10σ) in panel e), and 5σ in panel f) (starting from 10σ in panel f)); negative contours are in steps of 1σ (magenta dashed lines). Each pixel corresponds to 1.3 arcsec × 53 km s-1 in diagram e), and to 0.6 arcsec × 26 km s-1 in the inset f). |
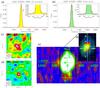 |
Fig. 3 Continuum-subtracted IRAM-PdBI spectra, maps, and position–velocity diagram of the CO(1–0) emission line of IRAS 23365+3604. Panels a) and b) show the spectra extracted from a circular aperture with a diameter of 5 arcsec and from the central pixel, respectively. For display purposes, the spectra are re-binned in channels of 54 km s-1. In both panels the narrow core of the line is fitted with a single Gaussian function (red dashed line). c), d) Cleaned map of the emission integrated in the blue- and red-shifted CO(1–0) wings. Contours correspond to 1σ (1σ rms level of the two maps is 0.2 mJy beam-1). The physical scale at the redshift of the source is 1.232 kpc arcsec-1. e) Position–velocity diagram along the major axis of rotation. Inset f) highlights the rotation pattern traced by the narrow component of the CO(1–0) line; this also suggests the presence of a counter-rotating disk visible at large radii (i.e. up to about 8 arcsec from the nucleus, which correspond to ~10 kpc). Contours are in steps of 1σ (up to 7σ) in panel e), and 5σ in inset f); negative contours are in steps of 1σ (magenta dashed lines). Each pixel corresponds to 0.6 arcsec × 54 km s-1 in diagram e), and to 0.3 arcsec × 27 km s-1 in the inset f). |
IRAS F08572+3915
The continuum-subtracted CO(1–0) emission line profile of IRAS F08572+3915 is shown in Fig. 1, in which we report the PdBI spectra extracted from an aperture of diameter ≃10 arcsec (a) and from the central beam (b), which is actually simply measured from the central pixel (since the maps are produced in units of mJy/beam). In this source we estimated the continuum emission over the velocity ranges v ∈ ( − 3700, –2500) km s-1 and v ∈ (2500, 4000) km s-1. We measure a total integrated line flux of SCO,TOT = (10.80 ± 0.70) Jy km s-1 within ±2000 km s-1 from the systemic velocity, which is consistent with previous single-dish and interferometric observations (Evans et al. 2002; Solomon et al. 1997; Papadopoulos et al. 2012b).
The large bandwidth of WideX allows us to detect – for the first time in this source – spectacular broad wings of the CO(1–0) emission line, tracing an outflow with velocities of up to 1200 km s-1. The two spectral profiles presented in Fig. 1a, b show interesting differences. In the spectrum extracted from the 10 arcsec aperture, the blue and the red wings appear almost perfectly symmetric with respect to the line core, and their emission peaks at velocities of about ±900 km s-1 from the systemic. Moreover, the narrow core can be fitted quite well with a single Gaussian function. Conversely, in the spectrum extracted from the central pixel, the fit to the narrow core shows a clear excess of emission at v ∈ (−200, −400) km s-1, which is not discernible in the 10 arcsec aperture spectrum, probably because of the lower signal-to-noise ratio. Nonetheless, the most obvious difference between the two spectra is the appearance of the high velocity wings: in the central pixel spectrum, while the blue-shifted wing appears very prominent, the red-shifted emission at v ≥ 500 kms-1 is not recovered, which would suggest that this component is mostly extended. We note that some very recent follow-up observations of this source, obtained by us in PdBI A-configuration, resolve out the red wing, hence confirming that this must trace a very extended outflow.
The cleaned maps of the blue- and red-shifted wings are presented in panels c, d of Fig. 1. Both the wings are detected at a >10σ significance in the maps, which is also the significance of detecting wings at | v | > 500 km s-1 2. The molecular outflow is detected in the correspondence with the north-west galaxy of the merging system, confirming findings in previous studies. The peak of the red-shifted emission is slightly offset (~1.4 arcsec) with respect to the pointing and phase centre. Moreover, the red wing map exhibits a structure extended to the north, which further confirms the hypothesis of a very extended red-shifted emission. The fluxes measured in the blue- and red-shifted wings of the CO(1–0) emission line are reported in Table 2. The analysis of the uv data gives an average size (FWHM) of 1.56 ± 0.33 kpc for the massive molecular outflow in IRAS F08572+3915 (see Appendix A for the details). The velocity map of the central core emission (shown in Appendix A) shows a regular rotation pattern, with a major axis oriented east-west, similarly to the narrow ionised gas component (Rupke & Veilleux 2013b). The position–velocity diagram along the rotation major axis is presented in panels e, f of Fig. 1. Inset f shows the central rotation pattern, which is instead burned out in panel e with the adopted colour cuts. The signature of the extreme molecular outflow is clearly seen through the high velocity gas (along the horizontal axis of the plot) that does not follow the rotation curve of the galaxy.
Analysis of our PdBI CO(1–0) observations of the Sy2-ULIRG IRAS F08572+3915 convincingly reveals the presence of a powerful and massive molecular outflow, which extends on both sides of the galaxy up to velocities of ~1200 km s-1 and on physical scales of ~1 kpc, carrying a mass of molecular gas of about 4 × 10⁸ M⊙ and resulting in an outflow mass-loss rate of ~1200 M⊙ yr-1.
IRAS F10565+2448
Owing to their narrow bandwidth, the previous CO(1–0) observations of the Sy2-ULIRG IRAS F10565+2448 could not detect the broad component superposed on the narrow core of the line. This broad component is clearly visible in our new PdBI spectra shown in Fig. 2a, b. The broad wings in this source are detected up to about v = ± 600 km s-1. The continuum emission was estimated in the velocity ranges v ∈ ( − 3600, − 1200) km s-1 and v ∈ (1200,4000) km s-1. We stress that the choice of a different continuum window, with respect to IRAS F08572+3915 and to the other sources, does not introduce artificial bias on the shape and velocity extension of the broad wings. Indeed for each source we first inspect the appearance and shape of the broad wings in the non-continuum-subtracted spectrum.
We note that the spectrum extracted from a circular aperture with a diameter of 10 arcsec (Fig. 2a) and the one extracted from the central pixel (Fig. 2b) show similar line profiles. We measure a total integrated flux of SCO,TOT = (108.0 ± 1.0) Jy km s-1, which is significantly (>50%) larger than the flux recovered by Downes & Solomon (1998) and ~17% higher than the value given by Chung et al. (2009; see also Papadopoulos et al. 2012b). We report in Fig. 2c, d the blue and red wing maps obtained by integrating the CO(1–0) emission in the velocity ranges (–600, –300) km s-1 and (300, 600) km s-1. CO wings at | v | > 300 km s-1 are detected with S/N = 12, and the position–velocity diagram along the major axis of rotation (panels e, f of Fig. 2) proves that this high velocity gas does deviate from the central rotation pattern. Because Herschel-PACS observations revealed, in this source, prominent OH P-Cygni profiles with blue-shifted velocities of up to 950 km s-1 (Veilleux et al. 2013), the high significance detection of CO wings with | v | > 300 km s-1 deviating from the rotational pattern is sufficient, according to our criterion (Sect. 3.1), to claim the detection of a massive molecular outflow. We note that very high velocity (| v | > 500 km s-1) CO(1–0) emission is detected in this galaxy at a significance level of 4σ.
Our observations resolve the outflow traced by the broad wings of the CO(1–0) line, and the fit to the uv data results in an outflow radius of 1.1 kpc (see Appendix A for details). We note that this is probably a conservative estimate of the outflow extension, since the maps of the wings in Fig. 2c, d suggest the presence of even more extended structures, although at a low significance level (3σ). The molecular outflow discovered in IRAS F10565+2448 appears to be less powerful than in the other Sy-ULIRGs Mrk 231 and IRAS F08572+3915: indeed it has lower velocity and, carrying a mass of molecular gas of ~2 × 10⁸ M⊙, has a mass-loss rate of “only” 300 M⊙ yr-1.
IRAS 23365+3604
Previous IRAM PdBI observations of the CO(1–0) transition in IRAS 23365+3604 suggest the presence of a compact rotating ring or disk (Downes & Solomon 1998), responsible for the observed narrow line profile with FWZI ~ 500 km s-1. Our new observations recover a total CO flux of SCO,TOT = (48.90 ± 0.20) Jy km s-1 (Table 2), which is 60% larger than the IRAM PdBI flux measured by Downes & Solomon (1998), but consistent with the IRAM 30 m flux reported by the same authors (see also Papadopoulos et al. 2012b).
In Fig. 3 we present the continuum-subtracted CO(1–0) spectrum, extracted from an aperture with a diameter of 5 arcsec (a) and from the central pixel (b). The continuum emission was evaluated in the velocity ranges v ∈ ( − 3700, − 1200) km s-1 and v ∈ (1200, 4000) km s-1. The 5-arcsec aperture spectrum shows wings of the CO(1–0) emission line that extend to ~ 600 km s-1 from the systemic velocity, as well as some low significance emission at higher velocities. The CO(1–0) wings are instead less prominent in the spectrum extracted from the central pixel. The cleaned maps of the blue- and red-shifted CO(1–0) wings (Fig. 3c, d), integrated within the velocity ranges (–600, –300) km s-1 and (300, 600) km s-1, show that these are detected at 4σ and 8σ significance, respectively. By combining their emission, we reach a signal-to-noise of 9 (the combined map and uv plot are shown in Fig. A.5). The position–velocity diagram along the rotation major axis (Fig. 3e, f) reveals that such molecular gas at | v | > 300 km s-1 does not follow the rotation pattern traced by the central core emission and this suggests that this gas traces the same molecular outflow discovered by Herschel-PACS (Veilleux et al. 2013).
It is interesting to note that the position–velocity diagram exhibits the signature of a second disk or ring, counter-rotating with respect to the bulk of the molecular gas, which was not detected by Downes & Solomon (1998). This may further support the hypothesis that IRAS 23365+3604 is a later merger.
We estimate the molecular outflow in IRAS 23365+3604 to carry a mass of molecular gas of ~1.5 × 10⁸ M⊙ and to have an approximate radius of 1.2 kpc (obtained by fitting directly the uv data), resulting in an outflow mass-loss rate of 170 M⊙ yr-1 that is significantly lower than in the other ULIRGs.
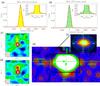 |
Fig. 4 Continuum-subtracted IRAM-PdBI spectra, maps and position–velocity diagram of the CO(1–0) emission line of Mrk 273. Panels a) and b) show the spectra extracted from a circular aperture with a diameter of 5 arcsec and from the central pixel, respectively. For display purposes, the spectra are re-binned in channels of 53 km s-1 (and in channels of 160 km s-1 in the insets). In both panels a) and b), the narrow core of the line is fitted with two Gaussian functions (red dashed lines, further comments in the text and in the appendix). c), d) Cleaned map of the emission integrated in the blue and red-shifted CO(1–0) wings. Contours correspond to 1σ (1σ rms noise of the two maps is 0.2 mJy beam-1). The physical scale at the redshift of the source is 0.746 kpc arcsec-1. e), f) Position–velocity diagram along the major axis of rotation. Contours are in steps of 1σ (up to 10σ) in panel e), and 5σ in inset f); negative contours are in steps of 1σ (magenta dashed lines). Each pixel corresponds to 2.2 arcsec × 120 km s-1 in diagram e), and to 1.1 arcsec × 54 km s-1 in inset f). |
Mrk 273
The continuum-subtracted CO(1–0) spectra of Mrk 273, extracted from a circular aperture of 5-arcsec diameter and from the central pixel, are shown in Fig. 4a, b. The continuum emission was estimated in the velocity ranges v ∈ ( − 3000, − 2000) km s-1 and v ∈ (2000, 3700) km s-1. The total CO(1–0) line flux that we measure within ±2000 km s-1 is SCO,TOT = (90.60 ± 0.50) Jy km s-1 (Table 2), consistent with the flux recovered by previous single-dish observations (Sanders et al. 1991; Solomon et al. 1997; Albrecht et al. 2007; Papadopoulos et al. 2012b), and about 15% more than the value obtained by Downes & Solomon (1998) with the PdBI. The CO(1–0) line spectra show a broad emission core, which has already been detected by previous observations, mostly tracing molecular gas in a nuclear rotating disk (see appendix for details). We fit this spectral core component with the sum of two Gaussian functions. In addition to this component, our new observations, obtained with a much larger bandwidth than previous data, reveal extra CO(1–0) emission at high blue- and red-shifted velocities. Such broad blue and red CO wings are detected at a significance of 6σ and 9σ, respectively, as shown by their integrated maps in panels c and d. The rotation in the central concentration of molecular gas is not clearly resolved by our D-configuration (i.e. low spatial resolution) observations (Fig. 4f). However, PdBI observations of the CO(2–1) transition presented by Downes & Solomon (1998) resolve the kinematics of the nuclear disk of Mrk 273, revealing a velocity centroid that changes from –300 to 200 km s-1. The PV diagram in panels e, f shows that the CO(1–0) emission at | v | > 400 km s-1 does not follow the central rotation pattern, and can therefore be ascribed to the molecular outflows detected by Herschel-PACS (Veilleux et al. 2013). We note that even if restricting the velocity range of integration to velocities | v | > 500 km s-1, the broad CO(1–0) wings of Mrk 273 are still both detected at a significance of 5σ.
In principle, the need for two Gaussians to reproduce the core of the CO(1–0) emission is not an anomaly (see also the case of Mrk 231, Cicone et al. 2012), but it can reflect the kinematics of the rotating gas in the central molecular disk. However, we cannot rule out the possibility that the asymmetry on the red side of the line core, which is fitted by the smaller Gaussian centred at about 250 km s-1, is also a signature of outflow. Indeed we detect in our channel maps (not shown) a blob elongated towards the north at velocities v > 150 km s-1, further confirming our hypothesis that the red-shifted peak of CO(1–0) emission, manifestly visible in the spectra in Fig. 4a, b, is tracing the low-velocity component of a prominent red-shifted outflow. Such outflow is mostly extended to the north up to velocities of 500 km s-1, while it is more compact at higher velocities.
For the molecular outflow in Mrk 273, we estimate an average radius of about 600 pc (see appendix for details) and a mass of ~ 1.7 × 10⁸ M⊙, yielding a mass-loss rate of 600 M⊙ yr-1.
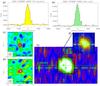 |
Fig. 5 Continuum-subtracted IRAM-PdBI spectra, maps, and position–velocity diagram of the CO(1–0) emission line in IRAS F23060+0505. Panels a) and b) show the spectra extracted from a circular aperture with diameter of 10 arcsec and from the central pixel, respectively. For display purposes, the spectra are re-binned in channels of 60 km s-1. c), d) Cleaned maps of the emission integrated in the blue- and red-shifted CO(1–0) wings. Contours correspond to 1σ (1σ rms noise level is 0.4 mJy beam-1 in the blue wing and 0.2 mJy beam-1 in the red wing). The physical scale at the redshift of the source is 2.934 kpc arcsec-1. e), f) Position–velocity diagram along the major axis of rotation. Panel f) highlights the rotational kinematics traced by the narrow core of the CO(1–0) emission. Contours are in steps of 1σ (up to 10σ) in panel e) and of 5σ in inset f). Negative contours are in steps of 1σ (magenta dashed lines). Each pixel corresponds to 0.7 arcsec × 60 km s-1 in both diagrams e) and f). |
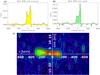 |
Fig. 6 Continuum-subtracted IRAM-PdBI spectra and position–velocity diagram of the CO(1–0) emission line of Mrk 876. Panels a) and b) show the spectra extracted from a circular aperture with a diameter of 10 arcsec and from the central pixel, respectively. For display purposes, the spectra are re-binned in channels of 57 km s-1. No clear evidence of broad wings is observed. c) Position–velocity diagram along the major axis of the CO(1–0) rotation. Contours are in steps of 1σ; negative contours are in steps of 1σ (magenta dashed lines). Each pixel in diagram c) corresponds to 1.3 arcsec × 29 km s-1. The physical scale at the redshift of the source is 2.295 kpc arcsec-1. |
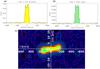 |
Fig. 7 Continuum-subtracted IRAM-PdBI spectra and position–velocity diagram of the CO(1–0) emission line of I Zw 1. Panels a) and b) show the spectra extracted from a circular aperture with a diameter of 10 arcsec and from the central pixel, respectively. For display purposes, the spectra are re-binned in channels of 54 km s-1. No evidence of broad wings is observed. c) Position–velocity diagram along the major axis of rotation. Contours correspond to: 1σ, 3σ, 6σ, 12σ, 18σ, 30σ, 36σ, 39σ, 42σ, 48σ; negative contours are in steps of 1σ (magenta dashed lines). Each pixel in diagram c) corresponds to 1.2 arcsec × 27 km s-1. The physical scale at the redshift of the source is 1.175 kpc arcsec-1. |
IRAS F23060+0505
To our knowledge, this is the first published observation of the CO(1–0) molecular transition in the powerful Type-2 QSO and ULIRG IRAS F23060+0505. We measure a total integrated CO flux of SCO,TOT = (15.30 ± 0.20) Jy km s-1. The continuum-subtracted CO(1–0) spectra, extracted from an aperture with diameter of 10 arcsec and from the central pixel, are shown in panels a, b of Fig. 5. The spectrum extracted from a 10 arcsec aperture shows some indication of broad CO emission, which extends up to at least v ~ 1000 km s-1 on the red-shifted side. Such evidence of high velocity emission is much more marginal in the central pixel spectrum. An interesting emission feature at red-shifted velocities of v ∈ (200,400) km s-1 is clearly distinguishable in both spectra.
The cleaned maps of the broad CO wings, integrated within velocities of − 500 < v < − 300 km s-1 and 300 < v < 1100 km s-1, are presented in panels c, d of Fig. 5: these show that the blue and red wings are detected at 9σ and 6σ significance. Moreover, the position–velocity diagram in Fig. 5e, f reveals that such emission at | v | > 300 km s-1 is clearly deviating from the central rotational pattern. This is particularly evident for the red-shifted CO emission: the PV diagram confirms that the feature appearing in the spectra at v ∈ (200,400) km s-1 does not trace rotating gas, but it is likely tracing either an outflow or an inflow of molecular gas. The blue-shifted gas at v < − 300 km s-1 is mostly elongated to the north of the galaxy, as shown by the map in panel c of Fig. 5. We also note the detection, in the PV diagram (as well as in the 10 arcsec aperture spectrum), of very high-velocity (v > 500 km s-1), red-shifted CO emission, although at a low significance level (i.e. S/N < 5). As already mentioned in Sect. 3.1, according to our criterion, IRAS F23060+0505 does not fully qualify as a reliable “outflow” detection, since high velocity gas is only detected at low significance, and we lack independent confirmation from Herschel data of the presence of a molecular outflow in this object. Additional observations are certainly required to understand the nature of the high velocity CO emission in this powerful QSO.
We use the flux and the spatial extent of the broad CO wings (estimated to be as large as 4 kpc in radius, see appendix for further details) to estimate the upper limits on the outflow mass and mass-loss rate in this source, which may be as high as ~ 4 × 10⁹ M⊙ and 1500 M⊙ yr-1, respectively.
Mrk 876 (PG 1613+658)
Previous interferometric and single-dish observations of the unobscured QSO and LIRG Mrk 876 detected the CO(1–0) emission at high signal-to-noise (Evans et al. 2001, 2006) and estimated a total CO integrated flux that is completely consistent with our PdBI measure of SCO,TOT = (8.5 ± 1.5) Jy km s-1. The continuum-subtracted PdBI CO(1–0) spectrum, extracted from an aperture with diameter of 10 arcsec and from the central pixel, is presented in Fig. 6a, b. The signal-to-noise of our spectrum is low due to the short integration (6 h of on source time with the PdBI, see Table 1). Both the aperture and the central pixel spectra do not show any clear evidence of broad CO wings. We marginally detect some high velocity blue- and red-shifted CO emission in the maps, obtained by averaging the frequency channels corresponding to velocities of (–500, –300) km s-1 and (400, 1700) km s-1 (not shown). The significance of this detection is, however, low. Moreover, in the position–velocity diagram (in Fig. 6c), there is no apparent trace of the broad CO wings that we detect in the maps. For this reason, and because Herschel-PACS observations of the OH transition in this source did not find any evidence of a blue-shifted OH absorption (which would be indicative of a molecular outflow), Mrk 876 does not satisfy our criterion for claiming detection of a massive molecular outflow.
By combining the blue and red-shifted CO(1–0) emission, we obtain enough signal-to-noise (i.e. S/N = 10, Fig. A.11) to evaluate the physical extent of the broad wings through the analysis of the uv data (see appendix for details). As for IRAS F23060+0505, we use the flux and radius of 3.6 kpc of these putative CO wings to estimate the upper limits of ~ 3 × 10⁹ M⊙ on the mass of outflowing gas and of 1800 M⊙ yr-1 on the outflow rate in Mrk 876. We stress that additional interferometric observations are required to investigate this source in detail and to draw more definite conclusions about the presence and the properties of a possible molecular outflow.
Finally, we note that the position–velocity diagram in panel c of Fig. 6 shows evidence of a double peak (also clearly discernible in the spectrum in panel a), which may be tracing a ring-like distribution of molecular gas.
I Zw 1 (PG 0050+124)
No broad CO(1–0) emission is detected in the spectra and maps of the LIRG and luminous QSO host galaxy I Zw 1. A comparison between our PdBI flux, SCO,TOT = (23.5 ± 1.0) Jy km s-1, and previous single-dish observations of this galaxy (Evans et al. 2006; Papadopoulos et al. 2012b) shows that we may be missing over 20% of more extended emission, and therefore the presence of a faint and broad CO(1–0) component cannot be ruled out with our data. We note that this object does not show OH absorption either: in contrast, OH is detected in pure emission, red-shifted by ~200 km s-1 (Veilleux et al. 2013). We present in Fig. 7a, b the continuum-subtracted CO(1–0) spectrum of I Zw 1, which is narrow overall, with FWZI of 500 km s-1. The position–velocity diagram obtained along the major axis of the CO(1–0) rotation (panel c of Fig. 7) shows clearly double-peaked emission, suggesting that I Zw 1 may host a ring-like distribution of molecular rotating gas in its nucleus.
For this source, we estimate upper limits for the flux in the broad CO(1–0) component as follows. We average the frequency channels corresponding to the velocity ranges of v ∈ ( − 650, − 250) km s-1 and v ∈ (500, 750) km s-1, and produce the cleaned maps, which do not however reveal any emission above the noise level. Our upper limits for the fluxes in the blue and red CO wings correspond to the rms noise of the two maps (i.e. 0.13 mJy beam-1 and 0.19 mJy beam-1) multiplied by a factor of 3, and integrated over 400 and 250 km s-1, respectively. We use these upper limit fluxes and an hypothetical CO wings radius of 500 pc (i.e. roughly comparable to the extent of the narrow core emission in I Zw 1, see appendix for more details) to estimate upper limits to the outflowing molecular mass and outflow rate in this source.
4. Extended sample
4.1. Description
In the following analysis we combine our seven sources observed with the PdBI with a heterogeneous sample of 12 local galaxies in which outflows of molecular gas have been constrained by mapping the two lowest-J CO rotational transitions (i.e. the J = 1–0 and J = 2–1). The complete list of sources is given in Table 3. In the following, we briefly discuss the properties of the sample of sources drawn from the literature.
The Sy1-ULIRG Mrk 231 can be naturally incorporated in our analysis, since its powerful molecular outflow was studied using the same methods that we employ for the new sources presented in this paper. We adopt the CO integrated fluxes in the blue- and red-shifted wings and the outflow size (estimated from the J = 1–0 transition) that are listed in Cicone et al. (2012), where the PdBI data exploited by Feruglio et al. (2010) were combined with more recent observations.
More careful consideration is needed for the other cases. Alatalo et al. (2011) have discovered a molecular outflow in the early-type LINER-host galaxy NGC 1266, using a combination of single dish (IRAM 30 m) and interferometric (SMA, CARMA) observations of the CO J = 1–0, J = 2–1, and J = 3–2 transitions. To calculate the outflow mass, we exploited the flux of the CO(1–0) broad component provided by these authors. By assuming the bipolar outflow geometry proposed by Alatalo et al. (2011), the outflow size (radius) is about 0.450 kpc, which refers to the average width of the blue- and red-shifted CO(2–1) emission as measured with the SMA. We note that, by using the J = 2–1 transition, we may be slightly underestimating the outflow size (Cicone et al. 2012).
Properties of the extended sample of galaxies.
Outflow properties of the extended sample of galaxies.
The molecular outflow in the starburst galaxy M 82 has been investigated by Walter et al. (2002) using detailed CO(1–0) maps obtained with the OVRO interferometer. We adopt the CO integrated flux of SCO = 7240 Jy km s-1, estimated by Walter et al. (2002) for the outflow north and south of the molecular disk. The wind geometry is almost spherical with a radius of about 0.8 kpc.
The lenticular galaxy NGC 1377 and the LINER NGC 1266 share some properties. SMA CO(2–1) observations of NGC 1377 have revealed the presence of a molecular outflow, traced by the broad wings of the emission line profile (Aalto et al. 2012b). In this case, both the flux of the broad component, determined by fitting the spectrum with two Gaussians (narrow plus broad), and the outflow radius of 0.2 kpc (under the hypothesis of a biconical outflow) were estimated using the CO(2–1) transition. The same caveats as for NGC 1266 are valid, with the addition that, in this object, the outflow mass is also obtained using the CO(2–1) line instead of the CO(1–0) line. To estimate the total CO(1–0) flux in the outflow we assume thermalised optically thick CO emission, i.e.  (Solomon & Vanden Bout 2005).
The complex morphology of the CO(1–0) emission in the AGN-dominated LIRG and merger NGC 6240 has been investigated in detail using the compact and the most extended configurations of the PdBI (Feruglio et al. 2013a,b). Feruglio et al. (2013b) clearly show that the blue-shifted CO(1–0) wing traces molecular gas outflowing from the southern nucleus. Conversely, most of the red-shifted emission arises from the region between the two nuclei and, although its origin is strongly debated, it is believed to be closely related to the merging process. Given the very high velocities observed in this red-shifted component, it is tempting to presume that, among the other mechanisms proposed and discussed in Feruglio et al. (2013b) and references therein, there may be an outflow contribution, but the current data do not allow us to quantify it. We therefore follow Feruglio et al. (2013b) and estimate the outflow rate from the blue wing of the CO(1–0) line, in the velocity range v ∈ (−500, −200) km s-1, which has an integrated flux of 17.8 Jy km s-1 and a total size of 1.3 kpc. We note that in Feruglio et al. (2013b) a conservative CO-to-H2 conversion factor of 0.5 M⊙(K km s-1 pc2)-1 has been used, while here we adopt the same value of 0.8 as in the other (U)LIRGs.
Sakamoto et al. (2006b) discovered a wind of molecular gas in the starburst merger NGC 3256, by using SMA observations of the CO(2–1) emission line. They integrate the blue- and red-shifted high-velocity emission in the CO(2–1) spectrum within the velocity ranges (–195, –165) km s-1 and (215, 425) km s-1. The resulting total CO(2–1) flux in the broad wings is 28 Jy km s-1, and we use this flux to estimate the mass of the molecular outflowing gas. We also adopt the same biconical geometry of the outflow as Sakamoto et al. (2006b) with an outflow extension of 0.5 kpc.
The starburst galaxy NGC 3628 hosts a sub-kpc scale molecular outflow to the north of the galactic disk traced by CO(1–0) emission (Tsai et al. 2012). This is spatially coincident with the northern ejection point of a large scale (~10 kpc) plasma outflow, which instead extends both to the north and to the south of the disk, as shown by soft X-ray Chandra observations. Tsai et al. (2012) infer a CO(1–0) flux of 82 Jy km s-1 for the molecular outflow by using detailed interferometric (NMA) maps. They suggest that this gas is expanding isotropically to the northern side of the galactic disk with an average velocity of 50 km s-1 up to a radius of 0.4 kpc.
The CO(2–1) emission in the prototypical starburst galaxy NGC 253, imaged with the SMA by Sakamoto et al. (2006a), displays two molecular gas features at a distance of 0.2 and 0.7 kpc from the galactic centre, which have been interpreted as expanding super-bubbles. Sakamoto et al. (2006a) estimate their molecular gas masses and diameters of ~100 pc from the CO(2–1) channel maps, and assume cylindrical symmetry and non-linear expansion (i.e. R(t) ∝ t1/2) to model the outflow. We adopt the same assumptions as these authors, but we apply a correction to the mass estimates to account for the use of a different CO-to-H2 conversion factor (see notes in Table 4). Very recently, Bolatto et al. (2013) have studied with unprecedented detail the molecular outflow of NGC 253, using new ALMA observations of the CO(1–0) transition. The outflow rate inferred from these new data of 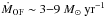 , is in excellent agreement with our estimate based on the work by Sakamoto et al. (2006a) (Table 4).
The integrated CO(1–0) PdBI map of the LINER and starburst galaxy NGC 6764 shows evidence of a molecular outflow extending to the north of the galactic disk (Leon et al. 2007). To estimate the outflow rate, we use the CO flux of 1.4 Jy km s-1 provided by Leon et al. (2007) and we assume that this is emitted by gas uniformly distributed in a conical volume with radius of 0.6 kpc, outflowing at a velocity of 170 km s-1.
Multi-transitional CO interferometric observations have shown the presence of a massive molecular outflow in the Sy2-LIRG NGC 1068, revealed by broad wings of the molecular emission lines (Krips et al. 2011). The blue- and the red-shifted high velocity CO components are co-spatial, and they reach velocity shifts of up to 250 km s-1 with respect to the systemic. Krips et al. (2011) suggest that up to 30% of the observed PdBI CO(2–1) emission is ascribable to gas blowing radially outward from the galaxy disk, and we use this estimate to evaluate the mass of the outflowing gas. We model the outflow using a biconical geometry with radius of 1 arcsec (0.1 kpc) and an average velocity of 150 km s-1.
In the early-type galaxy IC 5063, which hosts a radio-loud Sy2 nucleus, Morganti et al. (2013) detect with APEX a prominent blue-shifted wing of the CO(2–1) line, tracing gas with velocities exceeding those of the rotating gas in the disk. Interestingly, such velocities are consistent with those found in blue-shifted HI absorption, also detected in IC 5063, tracing an outflow along the line of sight of the radio jet. Since the APEX observations do not provide any information about the spatial extension of the CO(2–1) emission, the outflow rate estimation by Morganti et al. (2013) relies on the (likely but not yet proven) assumption that the molecular and neutral winds are co-spatial. Therefore, following these authors, we model the blue-shifted CO(2–1) wing as a conical outflow with radius of 0.5 kpc and velocity of 400 km s-1. As for the other cases, we assume .
Tsai et al. (2009) discovered various diffuse molecular features extended above and below the molecular disk of the nearby star-bursting galaxy NGC 2146 by using very deep NMA CO(1–0) observations. One of these structures, which can be seen clearly in the PV diagram and in the integrated intensity and velocity maps, traces a molecular outflow with velocities of up to 200 km s-1, extending to a distance of about 25 arcsec from the galactic centre (corresponding to 1.6 kpc with the cosmology adopted in this paper). The CO(1–0) integrated flux in this component is 150 Jy km s-1.
4.2. Outflow properties
As for the seven sources of our PdBI sample, to estimate the total mass of outflowing molecular gas in the 12 sources belonging to the literature sample, we adopt a unique CO-to-H2 conversion factor, i.e. the value commonly used for ULIRG-like gas conditions (αCO(1 − 0) = 0.8 M⊙ (K km s-1 pc2)-1, see also explanation in Sect. 3.2). However, for the non-ULIRG galaxies belonging to this sample, we also report, in Table 4, the outflow mass, mass-loss rates, and energetics as obtained by using the same αCO(1 − 0) adopted by the authors of the respective papers for estimating the total amount of molecular gas in that specific host galaxy (see Col. 6 of Table 3 and notes in Table 4). When only the CO(2–1) transition is available for estimating the outflow mass, as in the case of NGC 1377 and NGC 3256, we assume that the CO emission is thermalised and optically thick; as a result, the line luminosity  is independent of the transition J (Solomon & Vanden Bout 2005).
In the 12 sources from the literature, we derive the molecular outflow properties by assuming the same geometry as in the corresponding papers. These works usually provide the dynamical time scale τdyn of the wind and calculate the outflow mass-loss rate using the relation:  . As already explained in Sect. 3.2, this method is appropriate in a shell-like explosive scenario, where one or more clouds are clearly resolved, and their distance from the centre can be measured. However, if the outflowing gas appears to be uniformly distributed within a spherical or multi-conical volume, our prescription is more correct; in the latter case, as a result, we re-calculate the outflow rate with our method.
5. Ancillary information
In this section we discuss how the ancillary information listed in Table 3 was derived. The star formation rates in Col. 4 are inferred from the total IR (8–1000 μm) luminosity by assuming the relation in Kennicutt (1998) and a Chabrier IMF (see also Sturm et al. 2011): SFR = (1 − a) × 10-10 LIR, using the factor a ≡ LAGN/LBol reported in Col. 9. From these SFRs, we calculate the kinetic power injected by supernovae (Col. 5), by using the relationship provided by Veilleux et al. (2005): Pkin,SF(erg s-1) = 7 × 1041 SFR(M⊙ yr-1) (see also Maiolino et al. 2012).
The total mass of molecular gas in Col. 7 is corrected for He and is derived from the CO integrated flux, using for each source, the corresponding CO-to-H2 conversion factor in Col. 6. The value of the CO-to-H2 conversion factor in different environments and its dependence on the galaxy properties is highly debated, and it may constitute a major source of uncertainty in our estimates of the molecular gas masses. However, such discussion goes beyond the scope of this paper. Here we simply assume αCO(1 − 0) = 0.8 in ULIRGs (Downes & Solomon 1998), 1.2 in M 82 and M 82-like galaxies (Weiß et al. 2001) and 4.36 (rounded to 4.4 in Table 3) in the other galaxies (Milky Way value, Genzel et al. 2012).
Obtaining a reliable estimate of the AGN luminosity and of the AGN contribution to the total bolometric luminosity of a galaxy is generally a difficult task, but it is even more complicated in the case of the heavily obscured objects included in our sample. For the AGN-host (U)LIRGs, we mostly rely on the analysis of their infrared properties as revealed by Spitzer-IRS observations; in particular, for IRAS F08572+3915, IRAS 23365+3604, Mrk 273, IRAS F23060+0505, and Mrk 231, we adopt the LAGN/LBol ratios inferred using a spectral decomposition method, which relies on using AGN and starburst templates, in the rest frame 5−8 μm wavelength range, where the starbursts and AGNs have quite distinct spectral properties (Nardini et al. 2009, 2010). In the case of IRAS F10565+2448, we assume the average AGN bolometric fraction measured by Veilleux et al. (2009), using a combination of continuum, emission, and absorption line diagnostics based on the MIR and FIR Spitzer observations of this galaxy. We then evaluate the AGN bolometric luminosity for these ULIRGs by assuming LBol = 1.15 LIR (Veilleux et al. 2009). In the case of I Zw 1, Mrk 876, NGC 6240, NGC 6764, and IC 5063, we estimate LAGN from their absorption-corrected hard X-ray luminosity LX(2 − 10 keV) using the relation in Marconi et al. (2004). For the other two LINERs, NGC 1266, and NGC 1377, we calculate LAGN using the [OIII]λ5007 luminosity (reported by Moustakas & Kennicutt 2006) as a tracer of AGN activity, following Heckman et al. (2004). For the extremely obscured Seyfert 2 NGC 1068, we directly adopt the AGN luminosity calculated by Prieto et al. (2010). For the starburst galaxies M 82, NGC 3256, NGC 3628, NGC 253, and NGC 2146, we assume LBol ≃ LIR and set the value estimated from the unabsorbed hard X-ray luminosity LX(2 − 10 keV) as an upper limit for the LAGN, using the relation provided by Marconi et al. (2004).
6. Discussion
Recent works based on the analysis of Herschel-PACS FIR observations of local ULIRGs and AGN hosts have shown that molecular outflows are rather common in this class of objects (Veilleux et al. 2013; Spoon et al. 2013). In our study, thanks to the additional information provided by the interferometric CO observations, we find that molecular outflows can be very massive and energetic with outflow rates of several 100 M⊙ yr-1 and that the outflowing gas extends on kiloparsec scales, thereby affecting the host galaxy.
There is a good correspondence between the detection of molecular outflows through the OH P-Cygni profile and the detection of the same wind through the CO wings. In particular, we note that in the case of IRAS 08572+3915 (as well as for Mrk 231 and for the starburst galaxy NGC 253), the outflow mass-loss rate estimate obtained by Sturm et al. (2011) by modelling the OH P-Cygni profile is in good agreement with our results. For the three other sources in which OH P-Cygni profiles were detected by Herschel and which we followed up with the PdBI in their CO(1–0) transition (i.e. IRAS 10565+2448, IRAS 23365+3604, and Mrk 273), we find a good correspondence between the outflow velocities traced by the CO broad wings and the velocity of the OH blue-shifted absorption reported by Veilleux et al. (2013). Our PdBI observations of Mrk 876 and I Zw 1 only allow us to set upper limits on the molecular outflow properties in these sources. These two galaxies share some characteristics: both are dominated by a powerful unobscured QSO, and both exhibit pure OH emission profiles in the Herschel-PACS data presented by Veilleux et al. (2013), with no evidence of blue-shifted absorption. However, the OH profile of Mrk 876 is the broadest amongst the sources with OH detected exclusively in emission: this suggests non-gravitational motion of molecular gas. The poor signal-to-noise of the Herschel-PACS observations of Mrk 876 and I Zw 1 does not allow us to draw any conclusion about the possibility of very high velocity (i.e. | v | > 1000 km s-1) molecular outflows.
In the following we discuss the relationships between the properties of the molecular outflows and the physical properties of the AGN and of the host galaxies, to shed light on the origin and nature of the molecular outflows and on their role in the evolution of galaxies. A general caveat of this study is that our sample is certainly not representative of the local population of galaxies. It is incomplete and subject to biases. Indeed, the bulk of the SHINING subsample (4 targets out of 5) has been selected to show evidence of molecular outflows according to the OH P-Cygni profiles. As a consequence, only IRAS F23060+0505, Mrk 876, and I Zw 1 were observed with the PdBI without any previous knowledge of the presence of a molecular outflow. In IRAS F23060+0505 we detect molecular gas at velocities higher than 300 km s-1 whose kinematics deviates from the central rotational pattern (traced by the narrow core of the CO line): however, the lack of detection of high velocity CO emission at high significance prevents us from drawing firm conclusions about the outflowing origin of this gas. As mentioned before, in Mrk 876 and I Zw 1, we do not find any significant evidence of a massive molecular outflow, although in Mrk 876 we tentatively detect some high velocity CO emission. Summarising, none of our three “unbiased” sources constitutes a reliable molecular outflow detection. On the other hand, the sample collected from the literature only contains sources for which a molecular outflow has been constrained: this unavoidably biases the sample towards galaxies for which a molecular outflow has been detected, since in most cases in which an outflow has not been detected (or overlooked) the authors generally do not provide upper limits. Even so, the biases affecting our source selection do not prevent us from analysing the outflow properties within this sample, which is nevertheless an interesting and quite heterogeneous collection of local galaxies, spanning a wide range of physical properties, especially in terms of star formation rate and AGN luminosity.
All of the plots shown in this section are obtained by assuming a CO-to-H2 conversion factor αCO(1 − 0) = 0.8 for the molecular gas in the outflow (see also Table 4 and the related discussion in Sect. 3.2, for the PdBI sample, and Sect. 4.2, for the literature sample); nevertheless, the use of the alternative conversion factors (whose resulting outflow rates and energetics are also reported in Table 4) does not affect the observed trends significantly. The errors on the outflow radius (i.e. ±0.1 dex, on average), outflow rate, and depletion time scale (±0.3 dex), outflow kinetic power (±0.5 dex), and momentum rate (±0.45 dex) are calculated for our 4 PdBI sources with detected molecular outflows, by using the uncertainties on SCO and ROF obtained from the uv data (reported in Table 2) and by assuming a conservative average outflow velocity error of ±50%, which accounts for uncertainties associated with projection effects. We assume these error estimates to be representative also of the sample extracted from the literature, for which obtaining reliable error-bars is quite difficult, given the incompleteness of the information provided in the literature. These error bars do not take the uncertainty on the CO-to-H2 conversion factor into account; however, we note that including it would simply increase the upper error bars, since we are using, for all the sources, the most conservative value of αCO(1 − 0) (in the molecular outflow).
6.1. The relation between outflow rate, SFR and AGN luminosity.
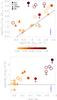 |
Fig. 8 Top: outflow mass-loss rate as a function of the star formation rate for the extended sample of galaxies, whose general properties and outflow characteristics are summarised in Tables 3 and 4. Filled and open circles represent unobscured and obscured AGNs respectively, LINERs are plotted as upward triangles and “pure” starburst galaxies as stars (see legend at the top-left corner of the plot). Symbols are colour-coded according to the fraction of bolometric luminosity attributed to the AGN (LAGN/LBol). Outflow rates are derived by assuming, in the outflow, the conservative CO-to-H2 conversion factor αCO(1 − 0) = 0.8 for all of the sources. The black dashed line represents the 1:1 correlation between SFR and outflow mass-loss rate. Bottom: this plot indicates a positive correlation between the outflow mass loading factor ( |
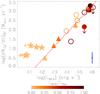 |
Fig. 9 Outflow mass-loss rate as a function of the AGN bolometric luminosity, for the extended sample of galaxies (Tables 3 and 4). Symbols and colour-coding are as in Fig. 8. Error bars as in Fig. 8. For the “pure” starburst galaxies we set an upper limit to the AGN contribution by hypothesising that all of their hard X-ray (2–10 keV) unobscured luminosity is produced by an AGN (further explanation in Sect. 5). The red dashed relationship results from a linear fit to the AGN host-galaxies, in which the upper limits have been excluded. |
The top panel of Fig. 8 shows the outflow rate ṀH2,OF as a function of the star formation rate by colour-coding the different symbols according to the fraction of the total galaxy bolometric luminosity that is ascribed to the AGN (i.e. LAGN/LBol). In this diagram, the pure starbursts and the starburst-dominated galaxies lie close to the relation  , i.e. outflow mass loading factor
  . Conversely, objects with higher AGN fraction depart from this sequence, and the deviation appears to increase with LAGN/LBol. This result would suggest that the presence of an AGN can boost the outflow rate by a large factor, which approaches two orders of magnitude in the most powerful QSOs of our sample.
We note, however, that also some of the SB-dominated sources have outflow rates that depart slightly from a 1:1 correlation by having outflow mass loading factors η ~ 1–4, indicating that they are also in a star formation–quenching regime. Although models of starburst-driven outflows can predict mass loading factors of up to ~2–3, such high values of the outflow mass loading factor in SB-dominated sources may indicate that even in these cases an AGN can contribute towards driving the outflow, even if the AGN only accounts for a minor fraction of the total bolometric luminosity of the source. Alternatively, an AGN may have been present, but switched off recently. Indeed, recent models show that AGN-driven massive molecular outflows can persist for ~108 yrs after the central nucleus has turned off (King et al. 2011; Zubovas & King 2012). The tentative positive correlation between the mass loading factor  /SFR and the AGN fraction of the bolometric luminosity of the galaxies is illustrated better by the the bottom panel of Fig. 8.
The relevance of the AGN in driving outflows is also highlighted in the plot of the outflow rate as a function of AGN luminosity reported in Fig. 9. For the galaxies of our sample that host an AGN, the AGN luminosity correlates with the outflow rate. Interestingly, “pure” starburst galaxies are all outliers in this correlation, possibly indicating that the feedback mechanism in action in these objects is substantially different from the AGN-host galaxies, even from those AGNs whose bolometric luminosity is dominated by the starburst. We fit the correlation for the AGN-host galaxies (Fig. 9), by excluding the upper limits, and we obtain  (2)This is the first time that a correlation between the molecular outflow rate and the AGN luminosity is found from CO data, and we interpret it as direct evidence for these massive molecular outflows being mostly powered by the AGN and, therefore, for AGN negative feedback in action in the AGN-host galaxies included in our study. However, I Zw1 and IC 5063 are remarkable counter examples, deviating from this relation. Given the biases and incompleteness of our sample, these two objects may be the tip of the iceberg of a population of AGNs with low outflow rates. In this scenario, the correlation in Fig. 9 would be just the upper envelope of the entire distribution of AGN host-galaxies in the outflow rate vs. AGN luminosity diagram. This possibility should be investigated with extensive CO surveys, targeting a complete sample of galaxies. Alternatively, I Zw1 and IC 5063 may represent a transient phase in which the molecular outflow has been swept away or the molecules photo-dissociated and ionised, and additional molecular clouds from the disk have still to be accelerated.
6.2. Gas depletion time scales
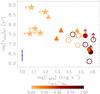 |
Fig. 10 Molecular gas depletion time scale due to the molecular outflow ( |
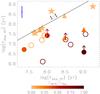 |
Fig. 11 Comparison between the depletion time scale due to gas removal through molecular outflows with the depletion time scale due to gas consumption by star formation. Symbols and colour-coding as in Fig. 8. Error bars as in Fig. 10. |
Figure 10 shows the molecular gas depletion time scale (due to outflows) as a function of the AGN luminosity. The gas depletion time scale associated with the outflow is defined as the time required by the outflow (assuming that it continues at the same rate) to completely remove the whole gas content in the host galaxy, i.e. 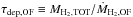 . In Fig. 10 the gas depletion time scales are significantly reduced by the presence of a luminous AGN. We indeed observe an anti-correlation between these two quantities, as already observed by Sturm et al. (2011), implying that the objects hosting more powerful AGNs are depleted of their molecular gas content on shorter time scales. Starburst galaxies have outflow depletion time scales of up to several hundred million years, while in galaxies hosting powerful quasars the depletion time scales can be as short as a few million years. We note, however, that these are time scales, which would correspond to the real depletion times only if the outflow continues at this rate. Moreover, as already stressed at the beginning of this section, our sample is strongly biased towards galaxies and quasars that do host massive molecular outflows, and therefore these results may not hold for the general population of local galaxies.
Figure 11 compares the depletion time scale due to the molecular outflow with the depletion time scale due to gas consumption by the star formation. The line indicates the locus where the two time scales are identical. In starburst-dominated galaxies the two time scales are similar, while in AGN-dominated galaxies, the outflow depletion time scale is much shorter than the depletion time scale due to star formation.
It is interesting to note that outflows can expel the molecular gas on time scales shorter than 100 Myr, which is the minimum quenching time scale required to explain the α-enhancement in massive spheroidal galaxies. Therefore, if the same mechanism is in place at high redshift, it can actually help explain the enhancement of α-elements, relative to iron, observed in local elliptical galaxies. It is also worth noting that the outflow depletion time scale, especially in the powerful AGNs of our sample, can be even shorter than 10–20 Myr, which is the quenching time inferred by recent studies of post-starburst galaxies at intermediate and high redshifts (Christy Tremonti, priv. comm.). Conversely, the depletion time scales associated with the consumption of gas by star formation are too long and fail to meet these conditions in most objects.
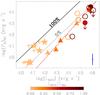 |
Fig. 12 Correlation between the kinetic power of the outflow and the AGN bolometric luminosity. Symbols and colour-coding as in Fig. 8. The grey line represents the theoretical expectation of models of AGN feedback, for which PK,OF = 5%LAGN. The red dashed line represents the linear fit to our data, excluding the upper limits. The error bar shown at the bottom-right of the plot corresponds to an average error of ±0.5 dex. |
6.3. Kinetic power of the outflows
Figure 12 shows the kinetic power of the molecular outflow as a function of AGN luminosity. Theoretical models of AGN feedback and cosmological simulations predict a coupling efficiency between AGN-driven outflows and AGN power of ~5%, for AGN accreting close to the Eddington limit (which is likely the case for, at least, the most luminous AGNs in our sample). This is also the Pkin/LAGN fraction needed to explain the MBH − σ relation in local galaxies (e.g. King 2010; Zubovas & King 2012; Lapi et al. 2005). Our observations of massive molecular outflows in AGN-host galaxies, overall, appear to confirm this prediction. In Fig. 12 we indicate the locus of points having an outflow kinetic power that is 5% of the AGN luminosity, and galaxies hosting powerful quasars are indeed located close to this value. The best-fit to our data points by excluding the upper limits is  (3)and it is indicated in Fig. 12. It is interesting that low luminosity AGNs seem to show an efficiency lower than 5%. Most likely, these AGNs (especially the LINERs) are accreting at a rate lower than Eddington. One should also note that in some of these low luminosity AGNs (e.g. IC 5063, see Morganti et al. (2013), and possibly NGC 1266 and NGC 6764, as suggested by Alatalo et al. (2011) and Leon et al. (2007), respectively) a radio jet is thought to contribute to the acceleration of the molecular gas. Additional detailed observations are required to better understand the outflow driving mechanism in these objects. Starburst galaxy upper limits are located above the 5% line, indicating that in these objects a different source of energy is required, most likely provided by SN ejecta and radiation pressure from the young stars.
The kinetic power of the outflow is compared in Fig. 13 with the kinetic power injected by supernovae, as inferred from the SFR, following Veilleux et al. (2005) (see Table 3 and relevant explanation in Sect. 5). Figure 13 shows that the outflow kinetic power achieved in the “pure” starburst galaxies and in some of the starburst-dominated objects is compatible with a supernova-driven wind, with a coupling efficiency of a few up to a few tens of percentage points. Conversely, for most of the heavily AGN-dominated sources, it is clear that the additional contribution of the AGN is needed to produce the observed outflow energetics.
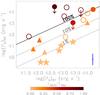 |
Fig. 13 Kinetic power of the outflow plotted as a function of the kinetic power of a supernova-driven wind. Symbols and colour-coding as in Fig. 8. Error bars as in Fig. 12. The black and grey lines mark the relations PK,OF = PK,SF, PK,OF = 10% PK,SF, and PK,OF = 1% PK,SF. |
6.4. Momentum rate of the outflows
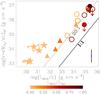 |
Fig. 14 Outflow momentum rate |

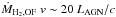
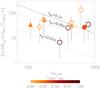 |
Fig. 15 Outflow momentum “boost” with respect to the AGN radiative momentum output, i.e. |
The momentum rate provides an additional important indicator of the nature of the outflow and an important test for models. In models in which the outflow is generated by a nuclear AGN-driven wind, the momentum rate transferred by the AGN photons to the surrounding medium is given by the average number of scattering by each photon. Some of these models predict, for AGNs accreting close to the Eddington limit, momentum fluxes of ~ 20 LAGN/c (e.g. Zubovas & King 2012; Faucher-Giguère & Quataert 2012).
Very interestingly, we find that the “momentum boost”, i.e. the ratio of  to the AGN radiative momentum output LAGN/c, ranges from ~10 to ~50 in the galaxies where the AGN contributes more than 10% to the total bolometric luminosity (Table 4). In particular, most of our sources (except the “pure” starbursts) do follow, within the errors, the relation v ṀH2,OF ~ 20 LAGN/c (Fig. 14). This finding supports both the AGN energy-driven nature of these outflows and the AGN feedback models that have been proposed so far, in which a fast and highly ionised wind, arising from the nuclear regions of the AGN, creates a shock wave that propagates into the ISM of the galaxy (Zubovas & King 2012; Faucher-Giguère & Quataert 2012). We explore this hypothesis further in Fig. 15, by reproducing the diagram originally proposed by Faucher-Giguère & Quataert (2012; Fig. 5 in their paper), in which the momentum “boost” of the outflows is plotted as a function of the outflow velocity. According to Faucher-Giguère & Quataert (2012), under the assumption that the observed molecular outflows are energy-conserving, the momentum boost
  and the molecular outflow velocity vOF are linked to the velocity of the initial nuclear and fast wind, vin, by the relationship:
 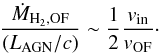 (4)This relationship, computed for different values of vin, is represented in Fig. 15. It is clear from Fig. 15 that we do not observe the correlation found by Faucher-Giguère & Quataert (2012); however, the trend shown in their paper is mainly driven by the two sources with outflow velocities of ~5000 km s-1, in which the powerful winds have been observed in ionised gas (FeLoBALs). Owing to the narrow range of velocities sampled by our molecular outflows, we probably cannot test the correlation of Faucher-Giguère & Quataert (2012), but we can still comment on the consistency of their model with our observations. Figure 15 illustrates that nuclear ionised winds with vin ∈ (0.01c,0.1c) can in principle generate the molecular outflows observed in the AGN-dominated sources.
We should still keep in mind the bias affecting our sample, which has been selected to mostly include objects with known (powerful) outflows. Within this context it is useful to note that the upper limit given by I Zw 1 points towards a much lower “momentum boost” in the plot in Fig. 14. If this object is representative of a wider population (under-represented in our work because of our selection biases), then it may hint at other outflow acceleration mechanisms at work in AGNs, such as direct radiation pressure onto the dusty clouds in the host galaxy (e.g. Fabian 2012). Moreover, if the distribution of the clouds in the outflow is different with respect to what is assumed by us in Sect. 3.2 (i.e. continuous versus explosive scenarios), then the momentum rate may be lower by a factor of three, hence possibly favouring the latter models.
6.5. The driving mechanism in the “pure” starbursts
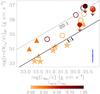 |
Fig. 16 Outflow momentum rate versus total photon momentum output of the galaxy (LBol/c). Symbols and colour-coding as in Fig. 8. Error bars are as in Fig. 14. The grey line shows the relation |
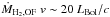
In all of the previous sections, we have seen that “pure” starburst galaxies deviate from the outflow relations found for galaxies hosting AGNs, indicating that in these systems the outflow driving mechanism is very likely different. Two main outflow mechanisms have been proposed for starburst galaxies: “energy-driven”, commonly associated with the energy injected into the ISM by SNe explosions, and “momentum driven”, generally associated with radiation pressure from the young stellar population on the dusty clouds (Murray et al. 2005, 2011; Thompson et al. 2005; Oppenheimer & Davé 2006, 2008; Hopkins et al. 2012). In this final section, we investigate the outflow driving mechanism in the starburst galaxies included in our sample by exploiting our results.
It has already been shown in Fig. 13 that the kinetic power of the outflow in starburst galaxies corresponds to only about 1% of the kinetic power produced by the SNe associated with the starburst. Therefore, if supernovae power the outflows, the coupling efficiency between supernova shocks and ISM must be quite low.
Additional information is given by investigating the outflow momentum rates. In particular, it is interesting to compare the outflow momentum rates with the total radiative momentum output of these galaxies, i.e. with LBol/c. For the heavily AGN-dominated sources, for which LBol ~ LAGN, such a relation, shown in Fig. 16, naturally resembles that of Fig. 14, showing momentum “boosts” of up to a factor of 20. However, for the other AGN hosts (with lower AGN contribution), Fig. 16 demonstrates that, when comparing the outflow momentum rate with LBol/c, i.e. when including the contribution of the starburst luminosity in the photon momentum computation, “momentum boosts” greater than ~20 are no longer required to explain our observations. Instead, a significant contribution to the momentum rates of these molecular outflows may come from momentum deposition into the ISM from star formation. In short, in these objects probably the radiation pressure from the AGN and from starbursts synergically combine to drive the outflow.
For the five “pure” starburst galaxies (along with the low luminosity AGN NGC 6764, which however, has an AGN contribution of only ~2%), Fig. 16 shows that the momentum rate is comparable to LBol/c, suggesting that (single-scattering) radiation pressure onto the dusty clouds of the ISM may contribute substantially to, or even dominate, the driving mechanism of outflows in starbursts.
The latter scenario is further supported by Fig. 17, which shows the outflow mass loading factor (/SFR) as a function of outflow velocity. In energy-driven outflows, the mass loading factor should be proportional to  , while in momentum-driven outflows the mass loading factor should be proportional to
  (e.g. Murray et al. 2005). Figure 17 shows a fit to the starburst galaxies with the slopes fixed to –1 and –2. Clearly the fit with slope –2, which would be compliant with the energy-driven scenario, is inconsistent with the starburst data. Instead, the fit with slope –1, expected from momentum-driven models, nicely agrees with the starburst data. The best fit to the starburst data obtained by leaving the slope free gives
  (5)As shown by Eq. (5), the best fit to the pure starbursts is fully consistent with the slope –1, while it is only marginally consistent (2σ) with slope –2. In summary, although based on a very modest sample size, our results suggest that in starburst galaxies outflows are mostly momentum-driven, at least for the molecular component (which generally dominates the outflow mass budget).
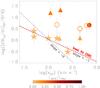 |
Fig. 17 Outflow mass loading factor ( |
7. Summary and conclusions
We have investigated the properties of massive molecular outflows in a sample of 19 nearby galaxies, spanning a wide range of AGN and starburst activities. For seven of these sources, we presented new PdBI observations of the CO(1–0) emission line; in four of them, we have detected, for the first time, CO broad wings tracing molecular outflows extended on kpc scales, which indicates that these outflows are affecting their host galaxies on large scales. In other two sources we have found some marginal evidence of broad CO wings, but additional observations are required to confirm the presence and the nature of this high velocity gas. We measured very high outflow mass-loss rates of several times 100 M⊙ yr-1, similar to the prototypical giant molecular wind discovered in Mrk 231 (Feruglio et al. 2010; Fischer et al. 2010). With the aim of shedding light on the possible correlations between outflow characteristics and intrinsic properties of a larger sample of objects, we included in our study 12 additional local galaxies, where outflows of molecular gas have been observed. For homogeneity, we restricted our investigation to molecular outflows revealed by observations of high velocity components of the CO(1–0) or CO(2–1) emission lines. We emphasise that the sample employed for our analysis (both our new sample and the sample taken from the literature) is clearly biased towards galaxies for which a molecular outflow has been detected. By comparing the intrinsic characteristics of this sample of nearby galaxies and AGN hosts with their outflow properties and energetics, we have found that
-
Starbursts are effective at powering massive molecular out-flows, but the presence of a powerful AGN, when it dominates the energetic output of the galaxy, can significantly boostthe outflow rates. More specifically, while in starburst-dominated galaxies the outflow mass loading factor (
 ) is close to unity with maximum values of 2–4, η increases with the fraction of total bolometric luminosity that is associated with the AGN, approaching values of ~100 in the most powerful QSOs.
 -
There is a correlation between outflow rate and AGN luminosity for the AGN host galaxies of our extended sample. However, this correlation may be tracing the upper envelope of a broader distribution. Indeed our sample is certainly biased towards objects where the presence of a molecular outflow was already known. A completely unbiased survey may deliver more sources with lower outflow rates, placed below the relation found by us. The presence of two objects in our sample that host powerful AGNs and are placed below the relation hints at this scenario.
-
These AGN-driven massive molecular outflows are capable of exhausting the cold gas reservoir of the host galaxy, hence of quenching star formation, on time scales as short as a few times 10 6 yrs, for the most luminous AGNs. In particular, we found an anti-correlation between depletion time scale and AGN power, confirming previous studies based on the far-IR OH absorption lines (Sturm et al. 2011). In AGN hosts, the depletion time scale due to the molecular outflow is much shorter than the depletion time scale of gas consumption due to star formation.
-
A comparison between the kinetic power of the outflow and AGN power has shown that these two quantities are correlated and that their ratio, especially for the most powerful AGNs (likely accreting close to the Eddington limit), is very close to the value of 5% predicted by theoretical models, which is commonly adopted in simulations of AGN negative feedback and is needed to match the MBH − σ relationship. Further confirmation to the hypothesis of AGN-driven outflows is provided by finding that the energetics of the molecular outflows is totally inconsistent with supernovae-driven winds in AGN-dominated sources.
-
Outflow momentum rates of ~20 LAGN/c are common among the AGN-host galaxies of our extended sample. This very likely indicates that the molecular outflows that we observe in these sources are energy-conserving, and they may have been generated by fast nuclear winds that subsequently impact the interstellar medium of the host galaxy. However, other driving mechanisms (such as direct acceleration of dusty clouds through radiation pressure) may also contribute, especially for outflows with lower “momentum boosts”, whose fraction in our sample may be heavily under-represented due to selection biases. Moreover one should take into account that the distribution of clouds in the outflow may be different from what was assumed by us, and this may reduce the inferred momentum rate by a factor of about three.
-
Interestingly, in the starburst-dominated galaxies (i.e. those where an AGN is present, but it only contributes less than 10% to the total bolometric luminosity of the galaxy), the power source of the molecular outflow is ambiguous. On the one hand, the outflow rates are not much greater than their SFRs. On the other hand, in terms of outflow energetics and momentum rates, many of them follow the same relation as AGN-dominated galaxies, strongly suggesting that even in these SB-dominated objects the AGN can be the main driving source of the outflow. This suggests that even if the AGN is not the main source of energy, it can be more effective than the starburst in driving outflows. Alternatively, a more powerful AGN may have been present in the past and may have been responsible for driving most of the outflow, which can continue for a few hundred million years since the AGN has faded, as predicted by some models. This would also explain the observations of high velocity (i.e. v ~ 1000 km s-1) molecular outflows in stacked spectra of galaxies which do not show a clear AGN contribution (Chung et al. 2011), as well as the detection of very fast atomic outflows (v > 1000 km s-1) in galaxies at z ~ 0.6 showing no evidence of strong AGN activity (Diamond-Stanic et al. 2012): in these cases the AGN may not dominate the total luminosity (and its detection may be made difficult by the dilution from the starburst in the host galaxy), but it may still dominate the outflow mechanism. AGN variability can also account for the lack of AGN detection in these sources. Moreover, a bias against detecting powerful AGNs, even based on mid-IR or X-ray diagnostics, in outflows oriented perpendicular to our line of sight or during the early stages of outflow (when the AGN is still mostly embedded in high column densities), may affect the classification of some objects.
-
For “pure” starburst galaxies (i.e. galaxies that do not host an AGN) our data suggest that outflows (at least their molecular phase) are probably momentum-driven. This is supported by the finding that the outflow mass loading factor is proportional to v-1, as expected by momentum-driven models, and by the finding that their momentum rate is comparable to Lbol/c, suggesting that (single scattering) radiation pressure onto dusty clouds is responsible for expelling these clouds.
In conclusion, we have studied massive molecular outflows in galaxies spanning a wide range of starburst and AGN activities. In most cases, these outflows are powerful enough to quench the star formation in the host galaxy by removing the cold molecular gas out of which stars form. Our results suggest that such negative feedback on star formation is most efficient and dramatic in powerful AGNs, whose presence can significantly boost the outflow rates, kinetic powers, and momentum rates of these molecular winds and reduce the depletion time scale of molecular gas. Starbursts are also effective in driving massive outflows (likely through radiation pressure), although not as much as AGNs. However, one should consider that star formation most likely lasts for a longer period than the AGN activity. As a consequence, while AGN feedback is likely to have a dramatic effect by rapidly clearing massive galaxies of their gas content on short time scales, the integrated effect of starburst-driven winds may be more important on longer time scales, especially for lower mass galaxies. Further observations, carried out with the new generation of millimetre-wave interferometers (ALMA, NOEMA) will allow us to extend this investigation to a much larger sample of local galaxies and, more important, overcome the biases that affect the current sample.
Online material
Appendix A: Additional information
We report in this appendix additional information about the seven galaxies that we observed with the PdBI in their CO(1–0) transition. We further discuss our PdBI CO(1–0) observations, by showing the results of the fits to the uv plots of the CO wings, which provide an estimate of the size of the molecular outflow (when detected). We also present the integrated map, the corresponding uv plot, and the velocity field of the narrow core CO(1–0) emission, which traces the bulk of the molecular gas in rotation in the galaxy disk/ring.
Appendix A.1: IRAS F08572+3915
The Sy2-ULIRG IRAS F08572+3915 is an interacting system composed by two nuclei (NW and SE) separated by a projected distance of 5.4 arcsec (6.1 kpc); only the north-west (NW) component, which is the most luminous one and hosts a buried QSO, has been detected in CO(1–0) interferometric maps (Evans et al. 2002). Papadopoulos et al. (2012b) measure a very large  ratio in the NW nucleus, indicating very high ISM excitation, among the most extreme in their ULIRG sample.
The NW galaxy hosts powerful, multi-phase, and large-scale outflows, characterised by very high gas velocities in each component. The ionised and neutral winds have been resolved on ~kpc scales by Rupke & Veilleux (2013b), based on several optical emission lines and NaID absorption, and they appear to be partially overlapping. The ionised outflow shows blue-shifted velocities of up to ~3350 km s-1, while the maximum blue-shifted velocity detected in NaID absorption is ~1150 km s-1. Herschel-PACS observations of IRAS F08572+3915 revealed a powerful molecular outflow with OH 79 and 119 μm blue-shifted velocities of up to ~1100 km s-1 (Sturm et al. 2011; Veilleux et al. 2013). Interestingly, recent Keck–OSIRIS observations of the near-IR H2 roto-vibrational transitions show that warm molecular gas is also outflowing with velocities strikingly similar to those observed in the cold molecular phase (Rupke & Veilleux 2013a). This would suggest that molecular clouds may be affected by shocks during the acceleration process in this source.
In IRAS F08572+3915, both CO(1–0) wings are detected at high significance (>10σ, see Fig. 1), which allows us to investigate their spatial extent separately. For this purpose, we fit the visibility as a function of the uv radius (the plot of the real part of the visibility vs. uv radius is shown in Fig. A.1) with a circular Gaussian model, and we obtain a size (FWHM) of 1.36 ± 0.45 kpc for the blue wing and 1.91 ± 0.50 kpc for the red wing. The value reported in Table 2 is the average of the two.
In Fig. A.2 we present the map of the CO(1–0) narrow core integrated within ±250 km s-1, the corresponding uv plot, and the velocity field of this central concentration of molecular gas. The CO(1–0) narrow emission shows a non-compact structure, which can also be clearly seen in the uv visibility data. Multiple blobs of molecular gas at the systemic velocity are detected, one of which may be part of the tidal bridge between the NW and the SE galaxy of the merger. The SE companion is discernible in optical and near-IR images, but it has never been detected in molecular gas (Evans et al. 2002; Papadopoulos et al. 2012a). The first moment map shows that the molecular gas follows a regular rotation pattern oriented east-west, with an approximate rotation major axis at PA = –80 deg. The uv plot cannot be modelled with a single Gaussian but probably requires a more complex function.
Appendix A.2: IRAS F10565+2448
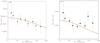 |
Fig. A.1 Real part of visibilities as a function of the uv distance for the blue (left) and red (right) CO(1–0) wings of IRAS F08572+3915, binned in baseline steps of 20 m. The red curve is the best fit with a circular Gaussian model. The uv tables of the two CO(1–0) wings have been re-centred to their emission centroid positions (obtained from their maps shown in Fig. 1) prior to plotting the uv visibilities in order to correctly estimate their size. |
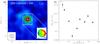 |
Fig. A.2 Panel a) IRAM PdBI continuum-subtracted map of the CO(1–0) narrow core emission in IRAS F08572+3915. Contour levels correspond to 5σ. The inset b) shows the first moment map obtained within v ∈ ( − 150, 150) km s-1. Contours correspond to 3 km s-1. The size of the inset is 6 × 7 arcsec. Panel c) uv plot for the narrow core, with visibilities binned in uv radius steps of 20 m. |
The second Sy2-ULIRG of our sample, IRAS F10565+2448, is a possible triple merger galaxy system, whose emission is largely dominated by the westernmost member. This is also the only merger component that has been detected in CO(1–0) emission by Downes & Solomon (1998) with the PdBI and, later on, by Chung et al. (2009) with the FCRAO 14 m telescope. As for IRAS F08572+3915, the optical spectrum of IRAS F10565+2448 shows evidence of kpc-scale ionised and neutral winds, although with outflowing velocities that are much more modest than IRAS F08572+3915 (Rupke & Veilleux 2013b).
The circular Gaussian fit to the uv plots reported in Fig. A.3, binned in baseline steps of 20 m, provides sizes (FWHM) of 2.15 ± 0.32 kpc and 2.22 ± 0.30 kpc for the blue and red-shifted CO(1–0) wings, respectively.
The emission from the CO(1–0) narrow core (i.e. within ±250 km s-1), reported in Fig. A.4a, appears more compact than the wings, although we find evidence in the channel maps of a plume of CO(1–0) emission extending to the south-west both at the systemic velocity and at slightly blue-shifted velocities of about –150 km s-1. Such a plume is also clearly visible in the inset b of Fig. A.4, which shows the velocity field within the velocity range of v ∈ ( − 200, 200) km s-1. The major axis of the rotation of the molecular gas is oriented with a PA ≃ –60 deg. The plot of the visibility as a function of the uv radius proves that the narrow component is very well resolved in our data, and its emission can be fitted with a power law of the form ∝ r-3, resulting in a FWHM size of 0.781 ± 0.078 kpc.
Appendix A.3: IRAS 23365+3604
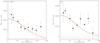 |
Fig. A.3 Real part of visibilities as a function of the uv distance for the blue (left) and red (right) CO(1–0) wings of IRAS F10565+2448, binned in baseline steps of 20 m. The red curve is the best fit with a circular Gaussian model. The uv tables of the two CO(1–0) wings have been re-centred to their emission centroid positions (obtained from their maps shown in Fig. 2) prior to plotting the uv visibilities in order to correctly estimate their size. |
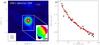 |
Fig. A.4 Panel a) IRAM PdBI continuum-subtracted map of the CO(1–0) narrow core emission in IRAS F10565+2448. Contours correspond to 50σ. The inset b) shows the first moment map obtained within v ∈ ( − 200, 200) km s-1. Contours correspond to 3 km s-1. The size of this inset is 10 × 13 arcsec. Panel c) uv plot for the narrow core, with visibilities binned in uv radius steps of 5 m, fitted with a power-law function model of the form ∝ r-3 (red points). |
Tidal tails revealed by near-IR imaging of the LINER-type ULIRG IRAS 23365+3604 indicate that this system is in a later merger stage, and no evidence of a double nucleus has been found so far (Downes & Solomon 1998). Interestingly, based on a study of the physical conditions of the dense molecular gas, Papadopoulos et al. (2012a) suggest an AGN influence on the ISM of this source. IRAS 23365+3604 is one of the most spectacular cases of OH P-Cygni profiles detected by Herschel-PACS, with blue-shifted velocities of up to 1300 km s-1 (Veilleux et al. 2013).
In the case of IRAS 23365+3604, to improve the signal-to-noise in order to estimate the size of the outflow, we combine the two wings: the corresponding map and uv plot are shown in Fig. A.5. A circular Gaussian fit to the uv visibility data, binned in baseline steps of 50 m, gives a FWHM of 2.45 ± 0.70 kpc, which we use as an estimate of the size (diameter) of the molecular outflow.
In Fig. A.6a we also show the cleaned map of the CO(1–0) narrow core, integrated within ±250 km s-1. With a flux of SCO,CORE = (45.24 ± 0.48) Jy km s-1, this component contributes more than 90% to the total CO(1–0) emission of IRAS 23365+3604. Our observations resolve this core emission reasonably well, and a circular Gaussian fit to the uv visibilities, binned in steps of 10 m of uv distance, results in a FWHM of 3.174 ± 0.073 kpc. In the channel maps we note the presence of a structure extended to the north, which is also evident in the velocity map (Fig. A.6b), at slightly red-shifted velocities of 50–80 km s-1. The narrow core of the CO(1–0) emission in IRAS 23365+3604 traces a disk of molecular gas with a major rotation axis oriented at a PA ≃ –55 deg.
Appendix A.4: Mrk 273
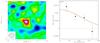 |
Fig. A.5 Left: IRAM PdBI cleaned map of the CO(1–0) blue- and red-shifted wings of IRAS 23365+3604, integrated within (±300, ±600) km s-1 and combined together. Contour levels correspond to 1σ (1σ rms level is 0.15 mJy beam-1). Right: real part of visibilities as a function of the uv radius for the combined CO(1–0) wings; visibilities are binned in baseline steps of 50 m. The red curve is the best fit with a circular Gaussian model. |
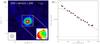 |
Fig. A.6 Panel a) IRAM PdBI continuum-subtracted map of the CO(1–0) narrow core emission in IRAS 23365+3604. Contours correspond to 30σ (1σ rms level is 0.15 mJy beam-1). The inset b) shows the first moment map obtained within v ∈ (−200, 200) km s-1. The size of the inset is 8 × 8 arcsec. Panel c) uv plot for the narrow core, with visibilities binned in uv radius steps of 10 m, fitted with a circular Gaussian model. |
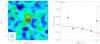 |
Fig. A.7 Left: IRAM PdBI cleaned map of the CO(1–0) blue- and red-shifted wings of Mrk 273, integrated within v ∈ (−800, −400) km s-1 and v ∈ (400,900) km s-1 and combined together. Contour levels correspond to 1σ (1σ rms level is 0.2 mJy beam-1). Right: real part of uv visibilities as a function of the uv radius for the combined CO(1–0) wings, with visibilities binned in baseline steps of 25 m. The red curve is the best fit with a circular Gaussian model. |
Mrk 273 is a Sy2-ULIRG with a double nucleus in near-IR images and a 44 kpc long tidal tail, which are signatures of merging. The physical conditions of the molecular gas in this galaxy suggest the presence of prodigious starburst activity fed by large amounts of cold molecular gas (Papadopoulos et al. 2012a). The ionised and neutral gas kinematics is complex in this object, characterised by kpc-scale outflows. In particular, Rupke & Veilleux (2013b) detect two super-bubbles of outflowing ionised gas, aligned in the north-south direction, which, owing to the large velocities, are likely to be generated by an AGN.
The map of the blue- and red-shifted CO(1–0) wings, integrated respectively within the velocity ranges v ∈ ( − 800, − 400) km s-1 and v ∈ (400,900) km s-1 and then combined, is reported in the left-hand panel of Fig. A.7. We note that a significant fraction of the outflow (especially the red-shifted wing, see also Fig. 4d), is elongated towards north. Notably, despite the narrow bandwidth available at that time, the CO(1–0) red-shifted component, peaking 5 arcsec to the north, had already been observed by Downes & Solomon (1998), although only up to velocities of ~350 km s-1. These authors stressed that the velocity and orientation of this structure are inconsistent with the nuclear disk and its east-west velocity gradient. This consideration by Downes & Solomon (1998) supports our hypothesis (also discussed in Sect. 3) that the asymmetry of the CO(1–0) line at v ∈ (200, 400) km s-1 traces outflowing gas. Indeed, the data reported by these authors only recovered velocities v ≤ 350 km s-1, and, consequently, they could not be observing the high velocity wings at v > 400 km s-1, which are instead revealed, for the first time, by our new PdBI observations. However, we emphasise that in our analysis we have chosen to be conservative and to define the red-shifted wing only from v ≥ 400 km s-1.
As for IRAS 23365+3604, we estimate the size of the outflow using the uv plot of the two wings combined, which is shown in the right-hand panel of Fig. A.7. The partially decreasing trend of the uv plot is inconsistent with a point source, indicating that the outflow is marginally resolved, despite the low spatial resolution of our D-conf data. The fit with a simple circular Gaussian (red curve in the plot) provides an approximate size (FWHM) of 1.1 ± 0.5 kpc.
For comparison, we show in Fig. A.8 the emission from the narrow core of the CO(1–0) line, integrated within ±250 km s-1. This component traces a central concentration of gas, which is in regular rotation, with a major axis oriented with a PA of about –75 deg (panel b of Fig. A.8). The uv plot of the narrow core emission can be modelled with a circular Gaussian with a FWHM of 2.026 ± 0.046 kpc (panel c of Fig. A.8).
Appendix A.5: IRAS F23060+0505
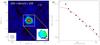 |
Fig. A.8 Panel a) IRAM PdBI continuum-subtracted map of the CO(1–0) narrow core emission in Mrk 273. Contours correspond to 30σ (1σ rms level is 0.2 mJy beam-1). The inset b) shows the first moment map obtained within v ∈ ( − 100,100) km s-1 by applying a flux density threshold of 8 mJy. The size of the inset is 14 × 14 arcsec. Panel c) uv plot for the narrow core, with visibilities binned in uv radius steps of 10 m, fitted with a circular Gaussian model. |
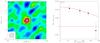 |
Fig. A.9 Left: IRAM PdBI cleaned map of the CO(1–0) blue-shifted and red-shifted wings of IRAS F23060+0505, integrated in the velocity ranges v ∈ ( − 500, − 300) km s-1 and v ∈ (300,1100) km s-1, and combined together. Contours correspond to 1σ (1σ rms noise is 0.2 mJy beam-1). Right: real part of visibilities plotted as a function of the uv radius for the CO(1–0) broad wings. Visibilities are binned in baseline steps of 30 m. The red curve is the result of the best fit with a circular Gaussian model. |
The ULIRG IRAS F23060+0505 hosts a heavily obscured AGN (type 2 QSO). Previous studies of the morphology and kinematics of its extended narrow line region indicated the presence of outflows of ionised gas through blue-shifted asymmetries of the emission line profiles (Wilman et al. 1999).
In IRAS F23060+0505, we define the blue and red-shifted wings of the CO(1–0) line within the velocity ranges (–500, −300) km s-1 and (300, 1100) km s-1. Because the red wing is detected at a significance below 8σ (Fig. 5c, d), we combine them to estimate their size. The map of the two wings merged, and the corresponding uv plot are shown in Fig. A.9. From the latter, by performing a fit with a simple circular Gaussian function, we estimate their spatial extension to be 8.1 ± 2.9 kpc (FWHM).
The cleaned map, the first momentum map, and the corresponding uv plot for the narrow core of the CO(1–0) emission, integrated within (–250, 250) km s-1, are shown in Fig. A.10a–c. The inferred flux of this CO(1–0) narrow component is SCO,CORE = (12.06 ± 0.85) Jy km s-1. The inset b of Fig. A.10 shows that the narrow core of the CO(1–0) emission traces molecular gas in regular rotation in a disk, with a major axis of rotation oriented with a PA ~ 0 deg. A fit to the uv plot with a circular Gaussian function provides an estimate of the size of this narrow component of about 6.96 ± 0.52 kpc, which, within the errors, is comparable to the extension of the broad CO wings in this source.
Appendix A.6: Mrk 876 (PG 1613+658)
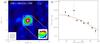 |
Fig. A.10 Panel a) IRAM PdBI continuum-subtracted map of the CO(1–0) narrow core emission in IRAS F23060+0505. Contours correspond to 5σ (1σ rms level is 0.3 mJy beam-1). Panel b) shows the first moment map obtained within v ∈ ( − 200, 200) km s-1 by applying a flux density threshold of 8 mJy. The size of the inset is 9 × 10 arcsec. Panel c) uv plot for the narrow core, with visibilities binned in uv radius steps of 10 m, fitted with a circular Gaussian model. |
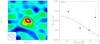 |
Fig. A.11 Left: IRAM PdBI cleaned map of the CO(1–0) blue- and red-shifted wings of Mrk 876, integrated in the velocity ranges v ∈ (−500, −300) km s-1 and v ∈ (400,1700) km s-1, and merged together. Contour levels correspond to 1σ (1σ rms level is 0.2 mJy beam-1). Right: real part of uv visibilities as a function of the uv radius for the combined CO(1–0) wings. Visibilities are binned in baseline steps of 30 m. The red curve is the result of the best fit with a circular Gaussian model. |
Despite being classified as an LIRG, the total IR luminosity (log (LIR) = 11.97, Veilleux et al. 2009) of the powerful QSO Mrk 876 (PG 1613+658) makes it very close to being a ULIRG. The detection of a molecular outflow is unclear in Mrk 876, and the quality of our data only allows us to set an upper limit on the mass and outflow rate in this source. Although the PV diagram along the major rotation axis of this source does not present any clear evidence of high velocity outflowing gas (Fig. 6c), the map of the blue- and red-shifted CO wings combined, reported in Fig. A.11, shows some emission detected at 10σ. A Gaussian fit to the uv visibilities, binned in steps of 30 m, provides a size (FWHM) of this broad CO component of 7.1 ± 1.4 kpc.
Although detected at high significance, the narrow core of the CO(1–0) emission is not completely resolved by our observations, as shown by the cleaned map and corresponding uv plot shown in Fig. A.12. The inset b of Fig. A.12 shows that the central concentration of molecular gas in Mrk 876, which is responsible for the bulk of its emission, is likely to be rotating in a regular disk or ring, with a rotation major axis oriented at PA = –37 deg. For this component, within (–250, 300) km s-1 (i.e. the maximum velocity extent of the rotation as illustrated by the PV diagram in Fig. 6c), we infer a physical size of 7.18 ± 0.46 kpc, which is perfectly consistent with our estimate of the size of the putative broad CO wings.
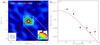 |
Fig. A.12 Panel a) IRAM PdBI continuum-subtracted map of the CO(1–0) narrow core emission in Mrk 876. Contours correspond to 5σ (1σ rms level is 0.2 mJy beam-1). Panel b) shows the first moment map obtained within v ∈ ( − 200,200) km s-1 The size of the inset is 11 × 10 arcsec. Panel c) uv plot for the narrow core, with visibilities binned in uv radius steps of 15 m, fitted with a circular Gaussian model. |
 |
Fig. A.13 Panel a) IRAM PdBI continuum-subtracted map of the CO(1–0) core emission in I Zw 1. Contours correspond to 10σ (1σ rms level is 0.2 mJy beam-1). Panel b) shows the first moment map obtained within v ∈ ( − 200, 200) km s-1, by applying a flux threshold of 3 mJy. The size of the inset is 16 × 16 arcsec. Panel c) uv plot for the narrow core, with visibilities binned in uv radius steps of 5 m, fitted with a power-law function model of the form ∝ r-2. |
Appendix A.7: I Zw 1 (PG 0050+124)
In the LIRG and luminous QSO host I Zw 1 (PG 0050+124), we do not detect any CO(1–0) broad emission component, although its UV and X-ray spectra show some evidence of high velocity (~2000 km s-1), ionized outflows (Costantini et al. 2007). Figure A.13 shows the map and uv plot of the narrow CO(1–0) line of I Zw 1, integrated within v = ± 250 km s-1. The CO line emission appears well resolved by our observations, and the uv visibilities, binned in baseline steps of 5 m, can be fitted well with a power-law model of the form ∝ r-2, which gives an FWHM of 1.258 ± 0.041 kpc. The molecular gas traced by this narrow CO(1–0) component is mostly rotating in a central disk or ring, with a major axis of rotation oriented with a PA = − 50 deg (inset b of Fig. A.13).
We note that throughout this paper, the equivalence “broad CO wings = molecular outflow” is not valid, because of the criterion that we define for the molecular outflow detection (Sect. 3.1). More specifically, although IRAS F23060+0505, Mrk 876, and I Zw 1 are all treated as non-detections for the molecular outflow, IRAS F23060+0505 and Mrk 876 differ from I Zw 1 in that broad CO wings are (marginally) detected, and we can estimate their flux and size from our CO(1–0) observations.
By restricting the velocity range of integration for the blue wing to velocities v < − 500 km s-1 we similarly obtain a S/N = 12 detection.
Acknowledgments
We thank the anonymous referee for constructive comments that improved the paper. We also thank Andy Fabian, Andrea Cattaneo, and Claude-André Faucher-Giguére for extremely helpful discussions and suggestions. C.C. acknowledges support by the Isaac Newton Studentship. This work is based on observations carried out with the IRAM Plateau de Bure Interferometer. IRAM is supported by INSU/CNRS (France), MPG (Germany), and IGN (Spain). Basic research in IR astronomy at NRL is funded by the US ONR, and J.F. acknowledges support from the NASA Herschel Science Center.
References
- Aalto, S., Garcia-Burillo, S., Muller, S., et al. 2012a, A&A, 537, A44 [NASA ADS] [CrossRef] [EDP Sciences] [Google Scholar]
- Aalto, S., Muller, S., Sakamoto, K., et al. 2012b, A&A, 546, A68 [NASA ADS] [CrossRef] [EDP Sciences] [Google Scholar]
- Alatalo, K., Blitz, L., Young, L. M., et al. 2011, ApJ, 735, 88 [NASA ADS] [CrossRef] [Google Scholar]
- Albrecht, M., Krügel, E., & Chini, R. 2007, A&A, 462, 575 [NASA ADS] [CrossRef] [EDP Sciences] [Google Scholar]
- Alexander, D. M., Swinbank, A. M., Smail, I., McDermid, R., & Nesvadba, N. P. H. 2010, MNRAS, 402, 2211 [NASA ADS] [CrossRef] [Google Scholar]
- Baldry, I. K., Glazebrook, K., Brinkmann, J., et al. 2004, ApJ, 600, 681 [NASA ADS] [CrossRef] [Google Scholar]
- Bolatto, A. D., Warren, S. R., Leroy, A. K., et al. 2013, Nature, 499, 450 [NASA ADS] [CrossRef] [PubMed] [Google Scholar]
- Bradshaw, E. J., Almaini, O., Hartley, W. G., et al. 2013, MNRAS, 433, 194 [NASA ADS] [CrossRef] [Google Scholar]
- Cano-Díaz, M., Maiolino, R., Marconi, A., et al. 2012, A&A, 537, L8 [NASA ADS] [CrossRef] [EDP Sciences] [Google Scholar]
- Castro-Carrizo, A., & Neri, R. 2010, IRAM Plateau de Bure Interferometer Data Reduction Cookbook [Google Scholar]
- Chung, A., Narayanan, G., Yun, M. S., Heyer, M., & Erickson, N. R. 2009, AJ, 138, 858 [NASA ADS] [CrossRef] [Google Scholar]
- Chung, A., Yun, M. S., Naraynan, G., Heyer, M., & Erickson, N. R. 2011, ApJ, 732, L15 [NASA ADS] [CrossRef] [Google Scholar]
- Cicone, C., Feruglio, C., Maiolino, R., et al. 2012, A&A, 543, A99 [NASA ADS] [CrossRef] [EDP Sciences] [Google Scholar]
- Combes, F., García-Burillo, S., Casasola, V., et al. 2013, A&A, 558, A124 [NASA ADS] [CrossRef] [EDP Sciences] [Google Scholar]
- Costantini, E., Gallo, L. C., Brandt, W. N., Fabian, A. C., & Boller, T. 2007, MNRAS, 378, 873 [NASA ADS] [CrossRef] [Google Scholar]
- Cowie, L. L., Songaila, A., Hu, E. M., & Cohen, J. G. 1996, AJ, 112, 839 [Google Scholar]
- Croston, J. H., Hardcastle, M. J., Kharb, P., Kraft, R. P., & Hota, A. 2008, ApJ, 688, 190 [NASA ADS] [CrossRef] [Google Scholar]
- Croton, D. J., Springel, V., White, S. D. M., et al. 2006, MNRAS, 365, 11 [NASA ADS] [CrossRef] [Google Scholar]
- Dasyra, K. M., & Combes, F. 2012, A&A, 541, L7 [NASA ADS] [CrossRef] [EDP Sciences] [Google Scholar]
- della Ceca, R., Griffiths, R. E., Heckman, T. M., Lehnert, M. D., & Weaver, K. A. 1999, ApJ, 514, 772 [NASA ADS] [CrossRef] [Google Scholar]
- Di Matteo, T., Springel, V., & Hernquist, L. 2005, Nature, 433, 604 [NASA ADS] [CrossRef] [PubMed] [Google Scholar]
- Diamond-Stanic, A. M., Moustakas, J., Tremonti, C. A., et al. 2012, ApJ, 755, L26 [NASA ADS] [CrossRef] [Google Scholar]
- Downes, D., & Solomon, P. M. 1998, ApJ, 507, 615 [NASA ADS] [CrossRef] [Google Scholar]
- Emonts, B. H. C., Morganti, R., Tadhunter, C. N., et al. 2005, MNRAS, 362, 931 [NASA ADS] [CrossRef] [Google Scholar]
- Evans, A. S., Frayer, D. T., Surace, J. A., & Sanders, D. B. 2001, AJ, 121, 1893 [NASA ADS] [CrossRef] [Google Scholar]
- Evans, A. S., Mazzarella, J. M., Surace, J. A., & Sanders, D. B. 2002, ApJ, 580, 749 [NASA ADS] [CrossRef] [Google Scholar]
- Evans, A. S., Solomon, P. M., Tacconi, L. J., Vavilkin, T., & Downes, D. 2006, AJ, 132, 2398 [NASA ADS] [CrossRef] [Google Scholar]
- Fabian, A. C. 2012, ARA&A, 50, 455 [NASA ADS] [CrossRef] [Google Scholar]
- Fabian, A. C., Vasudevan, R. V., Mushotzky, R. F., Winter, L. M., & Reynolds, C. S. 2009, MNRAS, 394, L89 [NASA ADS] [CrossRef] [Google Scholar]
- Faucher-Giguère, C.-A., & Quataert, E. 2012, MNRAS, 425, 605 [NASA ADS] [CrossRef] [Google Scholar]
- Ferrarese, L., & Ford, H. 2005, Space Sci. Rev., 116, 523 [NASA ADS] [CrossRef] [Google Scholar]
- Feruglio, C., Maiolino, R., Piconcelli, E., et al. 2010, A&A, 518, L155 [NASA ADS] [CrossRef] [EDP Sciences] [Google Scholar]
- Feruglio, C., Fiore, F., Maiolino, R., et al. 2013a, A&A, 549, A51 [NASA ADS] [CrossRef] [EDP Sciences] [Google Scholar]
- Feruglio, C., Fiore, F., Piconcelli, E., et al. 2013b, A&A, 558, A87 [NASA ADS] [CrossRef] [EDP Sciences] [Google Scholar]
- Fischer, J., Sturm, E., González-Alfonso, E., et al. 2010, A&A, 518, L41 [NASA ADS] [CrossRef] [EDP Sciences] [Google Scholar]
- Genzel, R., Tacconi, L. J., Combes, F., et al. 2012, ApJ, 746, 69 [NASA ADS] [CrossRef] [Google Scholar]
- González-Alfonso, E., Fischer, J., Graciá-Carpio, J., et al. 2014, A&A, 561, A27 [NASA ADS] [CrossRef] [EDP Sciences] [Google Scholar]
- González-Martín, O., Masegosa, J., Márquez, I., Guainazzi, M., & Jiménez-Bailón, E. 2009, A&A, 506, 1107 [NASA ADS] [CrossRef] [EDP Sciences] [Google Scholar]
- Granato, G. L., De Zotti, G., Silva, L., Bressan, A., & Danese, L. 2004, ApJ, 600, 580 [Google Scholar]
- Harrison, C. M., Alexander, D. M., Swinbank, A. M., et al. 2012, MNRAS, 426, 1073 [NASA ADS] [CrossRef] [Google Scholar]
- Heckman, T. M., Kauffmann, G., Brinchmann, J., et al. 2004, ApJ, 613, 109 [NASA ADS] [CrossRef] [Google Scholar]
- Hopkins, P. F., Cox, T. J., Kereš, D., & Hernquist, L. 2008, ApJS, 175, 390 [NASA ADS] [CrossRef] [MathSciNet] [Google Scholar]
- Hopkins, P. F., Quataert, E., & Murray, N. 2012, MNRAS, 421, 3522 [Google Scholar]
- Inui, T., Matsumoto, H., Tsuru, T. G., et al. 2005, PASJ, 57, 135 [NASA ADS] [Google Scholar]
- Kennicutt, Jr., R. C. 1998, ARA&A, 36, 189 [Google Scholar]
- King, A. R. 2010, MNRAS, 402, 1516 [NASA ADS] [CrossRef] [Google Scholar]
- King, A. R., Zubovas, K., & Power, C. 2011, MNRAS, 415, L6 [NASA ADS] [CrossRef] [Google Scholar]
- Kormendy, J., & Ho, L. C. 2013, ARA&A, 51, 511 [Google Scholar]
- Koyama, K., Awaki, H., Iwasawa, K., & Ward, M. J. 1992, ApJ, 399, L129 [NASA ADS] [CrossRef] [Google Scholar]
- Krips, M., Martín, S., Eckart, A., et al. 2011, ApJ, 736, 37 [NASA ADS] [CrossRef] [Google Scholar]
- Lapi, A., Cavaliere, A., & Menci, N. 2005, ApJ, 619, 60 [NASA ADS] [CrossRef] [Google Scholar]
- Leon, S., Eckart, A., Laine, S., et al. 2007, A&A, 473, 747 [NASA ADS] [CrossRef] [EDP Sciences] [Google Scholar]
- Magorrian, J., Tremaine, S., Richstone, D., et al. 1998, AJ, 115, 2285 [NASA ADS] [CrossRef] [Google Scholar]
- Maiolino, R., Ruiz, M., Rieke, G. H., & Papadopoulos, P. 1997, ApJ, 485, 552 [NASA ADS] [CrossRef] [Google Scholar]
- Maiolino, R., Gallerani, S., Neri, R., et al. 2012, MNRAS, 425, L66 [NASA ADS] [CrossRef] [Google Scholar]
- Marconi, A., & Hunt, L. K. 2003, ApJ, 589, L21 [NASA ADS] [CrossRef] [Google Scholar]
- Marconi, A., Risaliti, G., Gilli, R., et al. 2004, MNRAS, 351, 169 [NASA ADS] [CrossRef] [Google Scholar]
- Martin, C. L. 2005, ApJ, 621, 227 [Google Scholar]
- Mauersberger, R., Henkel, C., Wielebinski, R., Wiklind, T., & Reuter, H.-P. 1996, A&A, 305, 421 [NASA ADS] [Google Scholar]
- Menci, N., Fiore, F., Puccetti, S., & Cavaliere, A. 2008, ApJ, 686, 219 [NASA ADS] [CrossRef] [Google Scholar]
- Morganti, R., Oosterloo, T. A., Emonts, B. H. C., van der Hulst, J. M., & Tadhunter, C. N. 2003, ApJ, 593, L69 [NASA ADS] [CrossRef] [Google Scholar]
- Morganti, R., Tadhunter, C. N., & Oosterloo, T. A. 2005, A&A, 444, L9 [NASA ADS] [CrossRef] [EDP Sciences] [Google Scholar]
- Morganti, R., Frieswijk, W., Oonk, R. J. B., Oosterloo, T., & Tadhunter, C. 2013, A&A, 552, L4 [NASA ADS] [CrossRef] [EDP Sciences] [Google Scholar]
- Moustakas, J., & Kennicutt, Jr., R. C. 2006, ApJS, 164, 81 [NASA ADS] [CrossRef] [Google Scholar]
- Mullaney, J. R., Alexander, D. M., Fine, S., et al. 2013, MNRAS, 433, 622 [NASA ADS] [CrossRef] [Google Scholar]
- Müller-Sánchez, F., Prieto, M. A., Hicks, E. K. S., et al. 2011, ApJ, 739, 69 [NASA ADS] [CrossRef] [Google Scholar]
- Murray, N., Quataert, E., & Thompson, T. A. 2005, ApJ, 618, 569 [NASA ADS] [CrossRef] [Google Scholar]
- Murray, N., Ménard, B., & Thompson, T. A. 2011, ApJ, 735, 66 [NASA ADS] [CrossRef] [Google Scholar]
- Narayanan, D., Cox, T. J., Kelly, B., et al. 2008, ApJS, 176, 331 [NASA ADS] [CrossRef] [Google Scholar]
- Nardini, E., Risaliti, G., Salvati, M., et al. 2009, MNRAS, 399, 1373 [NASA ADS] [CrossRef] [Google Scholar]
- Nardini, E., Risaliti, G., Watabe, Y., Salvati, M., & Sani, E. 2010, MNRAS, 405, 2505 [NASA ADS] [Google Scholar]
- Nesvadba, N. P. H., Boulanger, F., Salomé, P., et al. 2010, A&A, 521, A65 [NASA ADS] [CrossRef] [EDP Sciences] [Google Scholar]
- Nesvadba, N. P. H., Polletta, M., Lehnert, M. D., et al. 2011, MNRAS, 415, 2359 [NASA ADS] [CrossRef] [Google Scholar]
- Oppenheimer, B. D., & Davé, R. 2006, MNRAS, 373, 1265 [NASA ADS] [CrossRef] [Google Scholar]
- Oppenheimer, B. D., & Davé, R. 2008, MNRAS, 387, 577 [NASA ADS] [CrossRef] [Google Scholar]
- Papadopoulos, P. P., van der Werf, P., Xilouris, E., Isaak, K. G., & Gao, Y. 2012a, ApJ, 751, 10 [NASA ADS] [CrossRef] [Google Scholar]
- Papadopoulos, P. P., van der Werf, P. P., Xilouris, E. M., et al. 2012b, MNRAS, 426, 2601 [NASA ADS] [CrossRef] [Google Scholar]
- Pérez-González, P. G., Rieke, G. H., Villar, V., et al. 2008, ApJ, 675, 234 [NASA ADS] [CrossRef] [Google Scholar]
- Piconcelli, E., Jimenez-Bailón, E., Guainazzi, M., et al. 2005, A&A, 432, 15 [NASA ADS] [CrossRef] [EDP Sciences] [Google Scholar]
- Prieto, M. A., Reunanen, J., Tristram, K. R. W., et al. 2010, MNRAS, 402, 724 [NASA ADS] [CrossRef] [Google Scholar]
- Ranalli, P., Comastri, A., & Setti, G. 2003, A&A, 399, 39 [NASA ADS] [CrossRef] [EDP Sciences] [Google Scholar]
- Rodríguez Zaurín, J., Tadhunter, C. N., Rose, M., & Holt, J. 2013, MNRAS, 432, 138 [NASA ADS] [CrossRef] [Google Scholar]
- Rupke, D. S. N., & Veilleux, S. 2011, ApJ, 729, L27 [NASA ADS] [CrossRef] [Google Scholar]
- Rupke, D. S. N., & Veilleux, S. 2013a, ApJ, 775, L15 [NASA ADS] [CrossRef] [Google Scholar]
- Rupke, D. S. N., & Veilleux, S. 2013b, ApJ, 768, 75 [NASA ADS] [CrossRef] [Google Scholar]
- Sakamoto, K., Ho, P. T. P., Iono, D., et al. 2006a, ApJ, 636, 685 [NASA ADS] [CrossRef] [Google Scholar]
- Sakamoto, K., Ho, P. T. P., & Peck, A. B. 2006b, ApJ, 644, 862 [NASA ADS] [CrossRef] [Google Scholar]
- Sanders, D. B., & Mirabel, I. F. 1985, ApJ, 298, L31 [NASA ADS] [CrossRef] [Google Scholar]
- Sanders, D. B., Scoville, N. Z., & Soifer, B. T. 1991, ApJ, 370, 158 [NASA ADS] [CrossRef] [Google Scholar]
- Silk, J., & Rees, M. J. 1998, A&A, 331, L1 [NASA ADS] [Google Scholar]
- Solomon, P. M., & Van den Bout, P. A. 2005, ARA&A, 43, 677 [NASA ADS] [CrossRef] [Google Scholar]
- Solomon, P. M., Downes, D., Radford, S. J. E., & Barrett, J. W. 1997, ApJ, 478, 144 [NASA ADS] [CrossRef] [Google Scholar]
- Soto, K. T., Martin, C. L., Prescott, M. K. M., & Armus, L. 2012, ApJ, 757, 86 [NASA ADS] [CrossRef] [Google Scholar]
- Spoon, H. W. W., Farrah, D., Lebouteiller, V., et al. 2013, ApJ, 775, 127 [NASA ADS] [CrossRef] [Google Scholar]
- Springel, V., Di Matteo, T., & Hernquist, L. 2005, MNRAS, 361, 776 [NASA ADS] [CrossRef] [Google Scholar]
- Sturm, E., González-Alfonso, E., Veilleux, S., et al. 2011, ApJ, 733, L16 [NASA ADS] [CrossRef] [Google Scholar]
- Thompson, T. A., Quataert, E., & Murray, N. 2005, ApJ, 630, 167 [NASA ADS] [CrossRef] [Google Scholar]
- Tsai, A.-L., Matsushita, S., Nakanishi, K., et al. 2009, PASJ, 61, 237 [NASA ADS] [Google Scholar]
- Tsai, A.-L., Matsushita, S., Kong, A. K. H., Matsumoto, H., & Kohno, K. 2012, ApJ, 752, 38 [NASA ADS] [CrossRef] [Google Scholar]
- Veilleux, S., Cecil, G., & Bland-Hawthorn, J. 2005, ARA&A, 43, 769 [Google Scholar]
- Veilleux, S., Rupke, D. S. N., Kim, D.-C., et al. 2009, ApJS, 182, 628 [NASA ADS] [CrossRef] [Google Scholar]
- Veilleux, S., Melendez, M., Sturm, E., et al. 2013, ApJ, 776, 27 [NASA ADS] [CrossRef] [Google Scholar]
- Verrecchia, F., in’t Zand, J. J. M., Giommi, P., et al. 2007, A&A, 472, 705 [NASA ADS] [CrossRef] [EDP Sciences] [Google Scholar]
- Walter, F., Weiss, A., & Scoville, N. 2002, ApJ, 580, L21 [NASA ADS] [CrossRef] [Google Scholar]
- Weiß, A., Neininger, N., Hüttemeister, S., & Klein, U. 2001, A&A, 365, 571 [NASA ADS] [CrossRef] [EDP Sciences] [Google Scholar]
- Wiklind, T., Combes, F., & Henkel, C. 1995, A&A, 297, 643 [NASA ADS] [Google Scholar]
- Wilman, R. J., Crawford, C. S., & Abraham, R. G. 1999, MNRAS, 309, 299 [NASA ADS] [CrossRef] [Google Scholar]
- Zubovas, K., & King, A. 2012, ApJ, 745, L34 [Google Scholar]
All Tables
All Figures
|
Fig. 1 Continuum-subtracted IRAM-PdBI spectra, maps, and position–velocity diagram of the CO(1–0) emission line of IRAS F08572+3915. Panels a) and b) show the spectra extracted from a circular aperture with diameter of 10 arcsec and from the central pixel (i.e. the centroid of the integrated CO emission), respectively. For display purposes, the spectra are re-binned in channels of 107 km s-1a) and 54 km s-1b). In both panels the narrow core of the line is fitted with a single Gaussian function (red dashed line). c), d) Map of the CO(1–0) emission integrated in the blue and red wings. Contours correspond to 1σ (1σ rms level of the two maps is 0.1 mJy beam-1). The physical scale at the redshift of the source is 1.122 kpc arcsec-1. The cross indicates the pointing and phase centre (i.e. the peak of the radio (VLBI) emission), which corresponds to the NW nucleus of the merging pair IRAS F08572+3915. e), f) Position–velocity diagram along the major axis of the molecular disk rotation (as traced by the narrow core of the CO(1–0) line). Inset f) highlights the rotation pattern traced by the narrow component of the CO(1–0) line. Contours are in steps of 1σ (up to 10σ) in panel e) and 5σ in panel f); negative contours are in steps of 1σ (magenta dashed lines). Each pixel corresponds to 0.9 arcsec × 90 km s-1 in diagram e), and to 0.3 arcsec × 30 km s-1 in the inset f). |
| In the text | |
|
Fig. 2 Continuum-subtracted IRAM-PdBI spectra, maps, and position–velocity diagram of the CO(1–0) emission line of IRAS F10565+2448. Panels a) and b) show the spectra extracted from a circular aperture with a diameter of 10 arcsec and from the central pixel, respectively. For display purposes, the spectra are re-binned in channels of 27 km s-1. In both panels the narrow core of the line is fitted with a single Gaussian function (red dashed line). Note the appearance, in both spectra, of broad CO wings up to ±600 km s-1. c), d) Cleaned map of the emission integrated in the blue- and red-shifted CO(1–0) wings. Contours correspond to 1σ (1σ rms level of the two maps is 0.2 mJy beam-1). The cross indicates the peak of the radio (VLBI) emission. The physical scale at the redshift of the source is 0.846 kpc arcsec-1. e),f) Position–velocity diagram along the major axis of rotation. Inset f) highlights the rotation pattern traced by the narrow component of the CO(1–0) line. Contours are in steps of 1σ (up to 10σ) in panel e), and 5σ in panel f) (starting from 10σ in panel f)); negative contours are in steps of 1σ (magenta dashed lines). Each pixel corresponds to 1.3 arcsec × 53 km s-1 in diagram e), and to 0.6 arcsec × 26 km s-1 in the inset f). |
| In the text | |
|
Fig. 3 Continuum-subtracted IRAM-PdBI spectra, maps, and position–velocity diagram of the CO(1–0) emission line of IRAS 23365+3604. Panels a) and b) show the spectra extracted from a circular aperture with a diameter of 5 arcsec and from the central pixel, respectively. For display purposes, the spectra are re-binned in channels of 54 km s-1. In both panels the narrow core of the line is fitted with a single Gaussian function (red dashed line). c), d) Cleaned map of the emission integrated in the blue- and red-shifted CO(1–0) wings. Contours correspond to 1σ (1σ rms level of the two maps is 0.2 mJy beam-1). The physical scale at the redshift of the source is 1.232 kpc arcsec-1. e) Position–velocity diagram along the major axis of rotation. Inset f) highlights the rotation pattern traced by the narrow component of the CO(1–0) line; this also suggests the presence of a counter-rotating disk visible at large radii (i.e. up to about 8 arcsec from the nucleus, which correspond to ~10 kpc). Contours are in steps of 1σ (up to 7σ) in panel e), and 5σ in inset f); negative contours are in steps of 1σ (magenta dashed lines). Each pixel corresponds to 0.6 arcsec × 54 km s-1 in diagram e), and to 0.3 arcsec × 27 km s-1 in the inset f). |
| In the text | |
|
Fig. 4 Continuum-subtracted IRAM-PdBI spectra, maps and position–velocity diagram of the CO(1–0) emission line of Mrk 273. Panels a) and b) show the spectra extracted from a circular aperture with a diameter of 5 arcsec and from the central pixel, respectively. For display purposes, the spectra are re-binned in channels of 53 km s-1 (and in channels of 160 km s-1 in the insets). In both panels a) and b), the narrow core of the line is fitted with two Gaussian functions (red dashed lines, further comments in the text and in the appendix). c), d) Cleaned map of the emission integrated in the blue and red-shifted CO(1–0) wings. Contours correspond to 1σ (1σ rms noise of the two maps is 0.2 mJy beam-1). The physical scale at the redshift of the source is 0.746 kpc arcsec-1. e), f) Position–velocity diagram along the major axis of rotation. Contours are in steps of 1σ (up to 10σ) in panel e), and 5σ in inset f); negative contours are in steps of 1σ (magenta dashed lines). Each pixel corresponds to 2.2 arcsec × 120 km s-1 in diagram e), and to 1.1 arcsec × 54 km s-1 in inset f). |
| In the text | |
|
Fig. 5 Continuum-subtracted IRAM-PdBI spectra, maps, and position–velocity diagram of the CO(1–0) emission line in IRAS F23060+0505. Panels a) and b) show the spectra extracted from a circular aperture with diameter of 10 arcsec and from the central pixel, respectively. For display purposes, the spectra are re-binned in channels of 60 km s-1. c), d) Cleaned maps of the emission integrated in the blue- and red-shifted CO(1–0) wings. Contours correspond to 1σ (1σ rms noise level is 0.4 mJy beam-1 in the blue wing and 0.2 mJy beam-1 in the red wing). The physical scale at the redshift of the source is 2.934 kpc arcsec-1. e), f) Position–velocity diagram along the major axis of rotation. Panel f) highlights the rotational kinematics traced by the narrow core of the CO(1–0) emission. Contours are in steps of 1σ (up to 10σ) in panel e) and of 5σ in inset f). Negative contours are in steps of 1σ (magenta dashed lines). Each pixel corresponds to 0.7 arcsec × 60 km s-1 in both diagrams e) and f). |
| In the text | |
|
Fig. 6 Continuum-subtracted IRAM-PdBI spectra and position–velocity diagram of the CO(1–0) emission line of Mrk 876. Panels a) and b) show the spectra extracted from a circular aperture with a diameter of 10 arcsec and from the central pixel, respectively. For display purposes, the spectra are re-binned in channels of 57 km s-1. No clear evidence of broad wings is observed. c) Position–velocity diagram along the major axis of the CO(1–0) rotation. Contours are in steps of 1σ; negative contours are in steps of 1σ (magenta dashed lines). Each pixel in diagram c) corresponds to 1.3 arcsec × 29 km s-1. The physical scale at the redshift of the source is 2.295 kpc arcsec-1. |
| In the text | |
|
Fig. 7 Continuum-subtracted IRAM-PdBI spectra and position–velocity diagram of the CO(1–0) emission line of I Zw 1. Panels a) and b) show the spectra extracted from a circular aperture with a diameter of 10 arcsec and from the central pixel, respectively. For display purposes, the spectra are re-binned in channels of 54 km s-1. No evidence of broad wings is observed. c) Position–velocity diagram along the major axis of rotation. Contours correspond to: 1σ, 3σ, 6σ, 12σ, 18σ, 30σ, 36σ, 39σ, 42σ, 48σ; negative contours are in steps of 1σ (magenta dashed lines). Each pixel in diagram c) corresponds to 1.2 arcsec × 27 km s-1. The physical scale at the redshift of the source is 1.175 kpc arcsec-1. |
| In the text | |
|
Fig. 8 Top: outflow mass-loss rate as a function of the star formation rate for the extended sample of galaxies, whose general properties and outflow characteristics are summarised in Tables 3 and 4. Filled and open circles represent unobscured and obscured AGNs respectively, LINERs are plotted as upward triangles and “pure” starburst galaxies as stars (see legend at the top-left corner of the plot). Symbols are colour-coded according to the fraction of bolometric luminosity attributed to the AGN (LAGN/LBol). Outflow rates are derived by assuming, in the outflow, the conservative CO-to-H2 conversion factor αCO(1 − 0) = 0.8 for all of the sources. The black dashed line represents the 1:1 correlation between SFR and outflow mass-loss rate. Bottom: this plot indicates a positive correlation between the outflow mass loading factor ( |
| In the text | |
|
Fig. 9 Outflow mass-loss rate as a function of the AGN bolometric luminosity, for the extended sample of galaxies (Tables 3 and 4). Symbols and colour-coding are as in Fig. 8. Error bars as in Fig. 8. For the “pure” starburst galaxies we set an upper limit to the AGN contribution by hypothesising that all of their hard X-ray (2–10 keV) unobscured luminosity is produced by an AGN (further explanation in Sect. 5). The red dashed relationship results from a linear fit to the AGN host-galaxies, in which the upper limits have been excluded. |
| In the text | |
|
Fig. 10 Molecular gas depletion time scale due to the molecular outflow ( |
| In the text | |
|
Fig. 11 Comparison between the depletion time scale due to gas removal through molecular outflows with the depletion time scale due to gas consumption by star formation. Symbols and colour-coding as in Fig. 8. Error bars as in Fig. 10. |
| In the text | |
|
Fig. 12 Correlation between the kinetic power of the outflow and the AGN bolometric luminosity. Symbols and colour-coding as in Fig. 8. The grey line represents the theoretical expectation of models of AGN feedback, for which PK,OF = 5%LAGN. The red dashed line represents the linear fit to our data, excluding the upper limits. The error bar shown at the bottom-right of the plot corresponds to an average error of ±0.5 dex. |
| In the text | |
|
Fig. 13 Kinetic power of the outflow plotted as a function of the kinetic power of a supernova-driven wind. Symbols and colour-coding as in Fig. 8. Error bars as in Fig. 12. The black and grey lines mark the relations PK,OF = PK,SF, PK,OF = 10% PK,SF, and PK,OF = 1% PK,SF. |
| In the text | |
|
Fig. 14 Outflow momentum rate |
| In the text | |
|
Fig. 15 Outflow momentum “boost” with respect to the AGN radiative momentum output, i.e. |
| In the text | |
|
Fig. 16 Outflow momentum rate versus total photon momentum output of the galaxy (LBol/c). Symbols and colour-coding as in Fig. 8. Error bars are as in Fig. 14. The grey line shows the relation |
| In the text | |
|
Fig. 17 Outflow mass loading factor ( |
| In the text | |
|
Fig. A.1 Real part of visibilities as a function of the uv distance for the blue (left) and red (right) CO(1–0) wings of IRAS F08572+3915, binned in baseline steps of 20 m. The red curve is the best fit with a circular Gaussian model. The uv tables of the two CO(1–0) wings have been re-centred to their emission centroid positions (obtained from their maps shown in Fig. 1) prior to plotting the uv visibilities in order to correctly estimate their size. |
| In the text | |
|
Fig. A.2 Panel a) IRAM PdBI continuum-subtracted map of the CO(1–0) narrow core emission in IRAS F08572+3915. Contour levels correspond to 5σ. The inset b) shows the first moment map obtained within v ∈ ( − 150, 150) km s-1. Contours correspond to 3 km s-1. The size of the inset is 6 × 7 arcsec. Panel c) uv plot for the narrow core, with visibilities binned in uv radius steps of 20 m. |
| In the text | |
|
Fig. A.3 Real part of visibilities as a function of the uv distance for the blue (left) and red (right) CO(1–0) wings of IRAS F10565+2448, binned in baseline steps of 20 m. The red curve is the best fit with a circular Gaussian model. The uv tables of the two CO(1–0) wings have been re-centred to their emission centroid positions (obtained from their maps shown in Fig. 2) prior to plotting the uv visibilities in order to correctly estimate their size. |
| In the text | |
|
Fig. A.4 Panel a) IRAM PdBI continuum-subtracted map of the CO(1–0) narrow core emission in IRAS F10565+2448. Contours correspond to 50σ. The inset b) shows the first moment map obtained within v ∈ ( − 200, 200) km s-1. Contours correspond to 3 km s-1. The size of this inset is 10 × 13 arcsec. Panel c) uv plot for the narrow core, with visibilities binned in uv radius steps of 5 m, fitted with a power-law function model of the form ∝ r-3 (red points). |
| In the text | |
|
Fig. A.5 Left: IRAM PdBI cleaned map of the CO(1–0) blue- and red-shifted wings of IRAS 23365+3604, integrated within (±300, ±600) km s-1 and combined together. Contour levels correspond to 1σ (1σ rms level is 0.15 mJy beam-1). Right: real part of visibilities as a function of the uv radius for the combined CO(1–0) wings; visibilities are binned in baseline steps of 50 m. The red curve is the best fit with a circular Gaussian model. |
| In the text | |
|
Fig. A.6 Panel a) IRAM PdBI continuum-subtracted map of the CO(1–0) narrow core emission in IRAS 23365+3604. Contours correspond to 30σ (1σ rms level is 0.15 mJy beam-1). The inset b) shows the first moment map obtained within v ∈ (−200, 200) km s-1. The size of the inset is 8 × 8 arcsec. Panel c) uv plot for the narrow core, with visibilities binned in uv radius steps of 10 m, fitted with a circular Gaussian model. |
| In the text | |
|
Fig. A.7 Left: IRAM PdBI cleaned map of the CO(1–0) blue- and red-shifted wings of Mrk 273, integrated within v ∈ (−800, −400) km s-1 and v ∈ (400,900) km s-1 and combined together. Contour levels correspond to 1σ (1σ rms level is 0.2 mJy beam-1). Right: real part of uv visibilities as a function of the uv radius for the combined CO(1–0) wings, with visibilities binned in baseline steps of 25 m. The red curve is the best fit with a circular Gaussian model. |
| In the text | |
|
Fig. A.8 Panel a) IRAM PdBI continuum-subtracted map of the CO(1–0) narrow core emission in Mrk 273. Contours correspond to 30σ (1σ rms level is 0.2 mJy beam-1). The inset b) shows the first moment map obtained within v ∈ ( − 100,100) km s-1 by applying a flux density threshold of 8 mJy. The size of the inset is 14 × 14 arcsec. Panel c) uv plot for the narrow core, with visibilities binned in uv radius steps of 10 m, fitted with a circular Gaussian model. |
| In the text | |
|
Fig. A.9 Left: IRAM PdBI cleaned map of the CO(1–0) blue-shifted and red-shifted wings of IRAS F23060+0505, integrated in the velocity ranges v ∈ ( − 500, − 300) km s-1 and v ∈ (300,1100) km s-1, and combined together. Contours correspond to 1σ (1σ rms noise is 0.2 mJy beam-1). Right: real part of visibilities plotted as a function of the uv radius for the CO(1–0) broad wings. Visibilities are binned in baseline steps of 30 m. The red curve is the result of the best fit with a circular Gaussian model. |
| In the text | |
|
Fig. A.10 Panel a) IRAM PdBI continuum-subtracted map of the CO(1–0) narrow core emission in IRAS F23060+0505. Contours correspond to 5σ (1σ rms level is 0.3 mJy beam-1). Panel b) shows the first moment map obtained within v ∈ ( − 200, 200) km s-1 by applying a flux density threshold of 8 mJy. The size of the inset is 9 × 10 arcsec. Panel c) uv plot for the narrow core, with visibilities binned in uv radius steps of 10 m, fitted with a circular Gaussian model. |
| In the text | |
|
Fig. A.11 Left: IRAM PdBI cleaned map of the CO(1–0) blue- and red-shifted wings of Mrk 876, integrated in the velocity ranges v ∈ (−500, −300) km s-1 and v ∈ (400,1700) km s-1, and merged together. Contour levels correspond to 1σ (1σ rms level is 0.2 mJy beam-1). Right: real part of uv visibilities as a function of the uv radius for the combined CO(1–0) wings. Visibilities are binned in baseline steps of 30 m. The red curve is the result of the best fit with a circular Gaussian model. |
| In the text | |
|
Fig. A.12 Panel a) IRAM PdBI continuum-subtracted map of the CO(1–0) narrow core emission in Mrk 876. Contours correspond to 5σ (1σ rms level is 0.2 mJy beam-1). Panel b) shows the first moment map obtained within v ∈ ( − 200,200) km s-1 The size of the inset is 11 × 10 arcsec. Panel c) uv plot for the narrow core, with visibilities binned in uv radius steps of 15 m, fitted with a circular Gaussian model. |
| In the text | |
|
Fig. A.13 Panel a) IRAM PdBI continuum-subtracted map of the CO(1–0) core emission in I Zw 1. Contours correspond to 10σ (1σ rms level is 0.2 mJy beam-1). Panel b) shows the first moment map obtained within v ∈ ( − 200, 200) km s-1, by applying a flux threshold of 3 mJy. The size of the inset is 16 × 16 arcsec. Panel c) uv plot for the narrow core, with visibilities binned in uv radius steps of 5 m, fitted with a power-law function model of the form ∝ r-2. |
| In the text | |
Current usage metrics show cumulative count of Article Views (full-text article views including HTML views, PDF and ePub downloads, according to the available data) and Abstracts Views on Vision4Press platform.
Data correspond to usage on the plateform after 2015. The current usage metrics is available 48-96 hours after online publication and is updated daily on week days.
Initial download of the metrics may take a while.