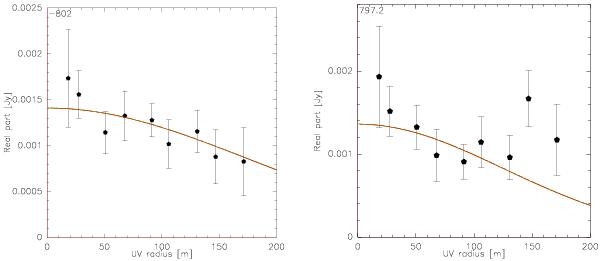
Fig. A.1

Real part of visibilities as a function of the uv distance for the blue (left) and red (right) CO(1–0) wings of IRAS F08572+3915, binned in baseline steps of 20 m. The red curve is the best fit with a circular Gaussian model. The uv tables of the two CO(1–0) wings have been re-centred to their emission centroid positions (obtained from their maps shown in Fig. 1) prior to plotting the uv visibilities in order to correctly estimate their size.
Current usage metrics show cumulative count of Article Views (full-text article views including HTML views, PDF and ePub downloads, according to the available data) and Abstracts Views on Vision4Press platform.
Data correspond to usage on the plateform after 2015. The current usage metrics is available 48-96 hours after online publication and is updated daily on week days.
Initial download of the metrics may take a while.


