| Issue |
A&A
Volume 562, February 2014
|
|
|---|---|---|
| Article Number | A21 | |
| Number of page(s) | 25 | |
| Section | Extragalactic astronomy | |
| DOI | https://doi.org/10.1051/0004-6361/201322464 | |
| Published online | 31 January 2014 | |
Online material
Appendix A: Additional information
We report in this appendix additional information about the seven galaxies that we observed with the PdBI in their CO(1–0) transition. We further discuss our PdBI CO(1–0) observations, by showing the results of the fits to the uv plots of the CO wings, which provide an estimate of the size of the molecular outflow (when detected). We also present the integrated map, the corresponding uv plot, and the velocity field of the narrow core CO(1–0) emission, which traces the bulk of the molecular gas in rotation in the galaxy disk/ring.
Appendix A.1: IRAS F08572+3915
The Sy2-ULIRG IRAS F08572+3915 is an interacting system composed by two nuclei (NW and SE) separated by a projected distance of 5.4 arcsec (6.1 kpc); only the north-west (NW) component, which is the most luminous one and hosts a buried QSO, has been detected in CO(1–0) interferometric maps (Evans et al. 2002). Papadopoulos et al. (2012b) measure a very large  ratio in the NW nucleus, indicating very high ISM excitation, among the most extreme in their ULIRG sample.
The NW galaxy hosts powerful, multi-phase, and large-scale outflows, characterised by very high gas velocities in each component. The ionised and neutral winds have been resolved on ~kpc scales by Rupke & Veilleux (2013b), based on several optical emission lines and NaID absorption, and they appear to be partially overlapping. The ionised outflow shows blue-shifted velocities of up to ~3350 km s-1, while the maximum blue-shifted velocity detected in NaID absorption is ~1150 km s-1. Herschel-PACS observations of IRAS F08572+3915 revealed a powerful molecular outflow with OH 79 and 119 μm blue-shifted velocities of up to ~1100 km s-1 (Sturm et al. 2011; Veilleux et al. 2013). Interestingly, recent Keck–OSIRIS observations of the near-IR H2 roto-vibrational transitions show that warm molecular gas is also outflowing with velocities strikingly similar to those observed in the cold molecular phase (Rupke & Veilleux 2013a). This would suggest that molecular clouds may be affected by shocks during the acceleration process in this source.
In IRAS F08572+3915, both CO(1–0) wings are detected at high significance (>10σ, see Fig. 1), which allows us to investigate their spatial extent separately. For this purpose, we fit the visibility as a function of the uv radius (the plot of the real part of the visibility vs. uv radius is shown in Fig. A.1) with a circular Gaussian model, and we obtain a size (FWHM) of 1.36 ± 0.45 kpc for the blue wing and 1.91 ± 0.50 kpc for the red wing. The value reported in Table 2 is the average of the two.
In Fig. A.2 we present the map of the CO(1–0) narrow core integrated within ±250 km s-1, the corresponding uv plot, and the velocity field of this central concentration of molecular gas. The CO(1–0) narrow emission shows a non-compact structure, which can also be clearly seen in the uv visibility data. Multiple blobs of molecular gas at the systemic velocity are detected, one of which may be part of the tidal bridge between the NW and the SE galaxy of the merger. The SE companion is discernible in optical and near-IR images, but it has never been detected in molecular gas (Evans et al. 2002; Papadopoulos et al. 2012a). The first moment map shows that the molecular gas follows a regular rotation pattern oriented east-west, with an approximate rotation major axis at PA = –80 deg. The uv plot cannot be modelled with a single Gaussian but probably requires a more complex function.
Appendix A.2: IRAS F10565+2448
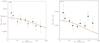 |
Fig. A.1
Real part of visibilities as a function of the uv distance for the blue (left) and red (right) CO(1–0) wings of IRAS F08572+3915, binned in baseline steps of 20 m. The red curve is the best fit with a circular Gaussian model. The uv tables of the two CO(1–0) wings have been re-centred to their emission centroid positions (obtained from their maps shown in Fig. 1) prior to plotting the uv visibilities in order to correctly estimate their size. |
| Open with DEXTER | |
 |
Fig. A.2
Panel a) IRAM PdBI continuum-subtracted map of the CO(1–0) narrow core emission in IRAS F08572+3915. Contour levels correspond to 5σ. The inset b) shows the first moment map obtained within v ∈ ( − 150, 150) km s-1. Contours correspond to 3 km s-1. The size of the inset is 6 × 7 arcsec. Panel c) uv plot for the narrow core, with visibilities binned in uv radius steps of 20 m. |
| Open with DEXTER | |
The second Sy2-ULIRG of our sample, IRAS F10565+2448, is a possible triple merger galaxy system, whose emission is largely dominated by the westernmost member. This is also the only merger component that has been detected in CO(1–0) emission by Downes & Solomon (1998) with the PdBI and, later on, by Chung et al. (2009) with the FCRAO 14 m telescope. As for IRAS F08572+3915, the optical spectrum of IRAS F10565+2448 shows evidence of kpc-scale ionised and neutral winds, although with outflowing velocities that are much more modest than IRAS F08572+3915 (Rupke & Veilleux 2013b).
The circular Gaussian fit to the uv plots reported in Fig. A.3, binned in baseline steps of 20 m, provides sizes (FWHM) of 2.15 ± 0.32 kpc and 2.22 ± 0.30 kpc for the blue and red-shifted CO(1–0) wings, respectively.
The emission from the CO(1–0) narrow core (i.e. within ±250 km s-1), reported in Fig. A.4a, appears more compact than the wings, although we find evidence in the channel maps of a plume of CO(1–0) emission extending to the south-west both at the systemic velocity and at slightly blue-shifted velocities of about –150 km s-1. Such a plume is also clearly visible in the inset b of Fig. A.4, which shows the velocity field within the velocity range of v ∈ ( − 200, 200) km s-1. The major axis of the rotation of the molecular gas is oriented with a PA ≃ –60 deg. The plot of the visibility as a function of the uv radius proves that the narrow component is very well resolved in our data, and its emission can be fitted with a power law of the form ∝ r-3, resulting in a FWHM size of 0.781 ± 0.078 kpc.
Appendix A.3: IRAS 23365+3604
 |
Fig. A.3
Real part of visibilities as a function of the uv distance for the blue (left) and red (right) CO(1–0) wings of IRAS F10565+2448, binned in baseline steps of 20 m. The red curve is the best fit with a circular Gaussian model. The uv tables of the two CO(1–0) wings have been re-centred to their emission centroid positions (obtained from their maps shown in Fig. 2) prior to plotting the uv visibilities in order to correctly estimate their size. |
| Open with DEXTER | |
 |
Fig. A.4
Panel a) IRAM PdBI continuum-subtracted map of the CO(1–0) narrow core emission in IRAS F10565+2448. Contours correspond to 50σ. The inset b) shows the first moment map obtained within v ∈ ( − 200, 200) km s-1. Contours correspond to 3 km s-1. The size of this inset is 10 × 13 arcsec. Panel c) uv plot for the narrow core, with visibilities binned in uv radius steps of 5 m, fitted with a power-law function model of the form ∝ r-3 (red points). |
| Open with DEXTER | |
Tidal tails revealed by near-IR imaging of the LINER-type ULIRG IRAS 23365+3604 indicate that this system is in a later merger stage, and no evidence of a double nucleus has been found so far (Downes & Solomon 1998). Interestingly, based on a study of the physical conditions of the dense molecular gas, Papadopoulos et al. (2012a) suggest an AGN influence on the ISM of this source. IRAS 23365+3604 is one of the most spectacular cases of OH P-Cygni profiles detected by Herschel-PACS, with blue-shifted velocities of up to 1300 km s-1 (Veilleux et al. 2013).
In the case of IRAS 23365+3604, to improve the signal-to-noise in order to estimate the size of the outflow, we combine the two wings: the corresponding map and uv plot are shown in Fig. A.5. A circular Gaussian fit to the uv visibility data, binned in baseline steps of 50 m, gives a FWHM of 2.45 ± 0.70 kpc, which we use as an estimate of the size (diameter) of the molecular outflow.
In Fig. A.6a we also show the cleaned map of the CO(1–0) narrow core, integrated within ±250 km s-1. With a flux of SCO,CORE = (45.24 ± 0.48) Jy km s-1, this component contributes more than 90% to the total CO(1–0) emission of IRAS 23365+3604. Our observations resolve this core emission reasonably well, and a circular Gaussian fit to the uv visibilities, binned in steps of 10 m of uv distance, results in a FWHM of 3.174 ± 0.073 kpc. In the channel maps we note the presence of a structure extended to the north, which is also evident in the velocity map (Fig. A.6b), at slightly red-shifted velocities of 50–80 km s-1. The narrow core of the CO(1–0) emission in IRAS 23365+3604 traces a disk of molecular gas with a major rotation axis oriented at a PA ≃ –55 deg.
Appendix A.4: Mrk 273
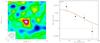 |
Fig. A.5
Left: IRAM PdBI cleaned map of the CO(1–0) blue- and red-shifted wings of IRAS 23365+3604, integrated within (±300, ±600) km s-1 and combined together. Contour levels correspond to 1σ (1σ rms level is 0.15 mJy beam-1). Right: real part of visibilities as a function of the uv radius for the combined CO(1–0) wings; visibilities are binned in baseline steps of 50 m. The red curve is the best fit with a circular Gaussian model. |
| Open with DEXTER | |
 |
Fig. A.6
Panel a) IRAM PdBI continuum-subtracted map of the CO(1–0) narrow core emission in IRAS 23365+3604. Contours correspond to 30σ (1σ rms level is 0.15 mJy beam-1). The inset b) shows the first moment map obtained within v ∈ (−200, 200) km s-1. The size of the inset is 8 × 8 arcsec. Panel c) uv plot for the narrow core, with visibilities binned in uv radius steps of 10 m, fitted with a circular Gaussian model. |
| Open with DEXTER | |
 |
Fig. A.7
Left: IRAM PdBI cleaned map of the CO(1–0) blue- and red-shifted wings of Mrk 273, integrated within v ∈ (−800, −400) km s-1 and v ∈ (400,900) km s-1 and combined together. Contour levels correspond to 1σ (1σ rms level is 0.2 mJy beam-1). Right: real part of uv visibilities as a function of the uv radius for the combined CO(1–0) wings, with visibilities binned in baseline steps of 25 m. The red curve is the best fit with a circular Gaussian model. |
| Open with DEXTER | |
Mrk 273 is a Sy2-ULIRG with a double nucleus in near-IR images and a 44 kpc long tidal tail, which are signatures of merging. The physical conditions of the molecular gas in this galaxy suggest the presence of prodigious starburst activity fed by large amounts of cold molecular gas (Papadopoulos et al. 2012a). The ionised and neutral gas kinematics is complex in this object, characterised by kpc-scale outflows. In particular, Rupke & Veilleux (2013b) detect two super-bubbles of outflowing ionised gas, aligned in the north-south direction, which, owing to the large velocities, are likely to be generated by an AGN.
The map of the blue- and red-shifted CO(1–0) wings, integrated respectively within the velocity ranges v ∈ ( − 800, − 400) km s-1 and v ∈ (400,900) km s-1 and then combined, is reported in the left-hand panel of Fig. A.7. We note that a significant fraction of the outflow (especially the red-shifted wing, see also Fig. 4d), is elongated towards north. Notably, despite the narrow bandwidth available at that time, the CO(1–0) red-shifted component, peaking 5 arcsec to the north, had already been observed by Downes & Solomon (1998), although only up to velocities of ~350 km s-1. These authors stressed that the velocity and orientation of this structure are inconsistent with the nuclear disk and its east-west velocity gradient. This consideration by Downes & Solomon (1998) supports our hypothesis (also discussed in Sect. 3) that the asymmetry of the CO(1–0) line at v ∈ (200, 400) km s-1 traces outflowing gas. Indeed, the data reported by these authors only recovered velocities v ≤ 350 km s-1, and, consequently, they could not be observing the high velocity wings at v > 400 km s-1, which are instead revealed, for the first time, by our new PdBI observations. However, we emphasise that in our analysis we have chosen to be conservative and to define the red-shifted wing only from v ≥ 400 km s-1.
As for IRAS 23365+3604, we estimate the size of the outflow using the uv plot of the two wings combined, which is shown in the right-hand panel of Fig. A.7. The partially decreasing trend of the uv plot is inconsistent with a point source, indicating that the outflow is marginally resolved, despite the low spatial resolution of our D-conf data. The fit with a simple circular Gaussian (red curve in the plot) provides an approximate size (FWHM) of 1.1 ± 0.5 kpc.
For comparison, we show in Fig. A.8 the emission from the narrow core of the CO(1–0) line, integrated within ±250 km s-1. This component traces a central concentration of gas, which is in regular rotation, with a major axis oriented with a PA of about –75 deg (panel b of Fig. A.8). The uv plot of the narrow core emission can be modelled with a circular Gaussian with a FWHM of 2.026 ± 0.046 kpc (panel c of Fig. A.8).
Appendix A.5: IRAS F23060+0505
 |
Fig. A.8
Panel a) IRAM PdBI continuum-subtracted map of the CO(1–0) narrow core emission in Mrk 273. Contours correspond to 30σ (1σ rms level is 0.2 mJy beam-1). The inset b) shows the first moment map obtained within v ∈ ( − 100,100) km s-1 by applying a flux density threshold of 8 mJy. The size of the inset is 14 × 14 arcsec. Panel c) uv plot for the narrow core, with visibilities binned in uv radius steps of 10 m, fitted with a circular Gaussian model. |
| Open with DEXTER | |
 |
Fig. A.9
Left: IRAM PdBI cleaned map of the CO(1–0) blue-shifted and red-shifted wings of IRAS F23060+0505, integrated in the velocity ranges v ∈ ( − 500, − 300) km s-1 and v ∈ (300,1100) km s-1, and combined together. Contours correspond to 1σ (1σ rms noise is 0.2 mJy beam-1). Right: real part of visibilities plotted as a function of the uv radius for the CO(1–0) broad wings. Visibilities are binned in baseline steps of 30 m. The red curve is the result of the best fit with a circular Gaussian model. |
| Open with DEXTER | |
The ULIRG IRAS F23060+0505 hosts a heavily obscured AGN (type 2 QSO). Previous studies of the morphology and kinematics of its extended narrow line region indicated the presence of outflows of ionised gas through blue-shifted asymmetries of the emission line profiles (Wilman et al. 1999).
In IRAS F23060+0505, we define the blue and red-shifted wings of the CO(1–0) line within the velocity ranges (–500, −300) km s-1 and (300, 1100) km s-1. Because the red wing is detected at a significance below 8σ (Fig. 5c, d), we combine them to estimate their size. The map of the two wings merged, and the corresponding uv plot are shown in Fig. A.9. From the latter, by performing a fit with a simple circular Gaussian function, we estimate their spatial extension to be 8.1 ± 2.9 kpc (FWHM).
The cleaned map, the first momentum map, and the corresponding uv plot for the narrow core of the CO(1–0) emission, integrated within (–250, 250) km s-1, are shown in Fig. A.10a–c. The inferred flux of this CO(1–0) narrow component is SCO,CORE = (12.06 ± 0.85) Jy km s-1. The inset b of Fig. A.10 shows that the narrow core of the CO(1–0) emission traces molecular gas in regular rotation in a disk, with a major axis of rotation oriented with a PA ~ 0 deg. A fit to the uv plot with a circular Gaussian function provides an estimate of the size of this narrow component of about 6.96 ± 0.52 kpc, which, within the errors, is comparable to the extension of the broad CO wings in this source.
Appendix A.6: Mrk 876 (PG 1613+658)
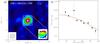 |
Fig. A.10
Panel a) IRAM PdBI continuum-subtracted map of the CO(1–0) narrow core emission in IRAS F23060+0505. Contours correspond to 5σ (1σ rms level is 0.3 mJy beam-1). Panel b) shows the first moment map obtained within v ∈ ( − 200, 200) km s-1 by applying a flux density threshold of 8 mJy. The size of the inset is 9 × 10 arcsec. Panel c) uv plot for the narrow core, with visibilities binned in uv radius steps of 10 m, fitted with a circular Gaussian model. |
| Open with DEXTER | |
 |
Fig. A.11
Left: IRAM PdBI cleaned map of the CO(1–0) blue- and red-shifted wings of Mrk 876, integrated in the velocity ranges v ∈ (−500, −300) km s-1 and v ∈ (400,1700) km s-1, and merged together. Contour levels correspond to 1σ (1σ rms level is 0.2 mJy beam-1). Right: real part of uv visibilities as a function of the uv radius for the combined CO(1–0) wings. Visibilities are binned in baseline steps of 30 m. The red curve is the result of the best fit with a circular Gaussian model. |
| Open with DEXTER | |
Despite being classified as an LIRG, the total IR luminosity (log (LIR) = 11.97, Veilleux et al. 2009) of the powerful QSO Mrk 876 (PG 1613+658) makes it very close to being a ULIRG. The detection of a molecular outflow is unclear in Mrk 876, and the quality of our data only allows us to set an upper limit on the mass and outflow rate in this source. Although the PV diagram along the major rotation axis of this source does not present any clear evidence of high velocity outflowing gas (Fig. 6c), the map of the blue- and red-shifted CO wings combined, reported in Fig. A.11, shows some emission detected at 10σ. A Gaussian fit to the uv visibilities, binned in steps of 30 m, provides a size (FWHM) of this broad CO component of 7.1 ± 1.4 kpc.
Although detected at high significance, the narrow core of the CO(1–0) emission is not completely resolved by our observations, as shown by the cleaned map and corresponding uv plot shown in Fig. A.12. The inset b of Fig. A.12 shows that the central concentration of molecular gas in Mrk 876, which is responsible for the bulk of its emission, is likely to be rotating in a regular disk or ring, with a rotation major axis oriented at PA = –37 deg. For this component, within (–250, 300) km s-1 (i.e. the maximum velocity extent of the rotation as illustrated by the PV diagram in Fig. 6c), we infer a physical size of 7.18 ± 0.46 kpc, which is perfectly consistent with our estimate of the size of the putative broad CO wings.
 |
Fig. A.12
Panel a) IRAM PdBI continuum-subtracted map of the CO(1–0) narrow core emission in Mrk 876. Contours correspond to 5σ (1σ rms level is 0.2 mJy beam-1). Panel b) shows the first moment map obtained within v ∈ ( − 200,200) km s-1 The size of the inset is 11 × 10 arcsec. Panel c) uv plot for the narrow core, with visibilities binned in uv radius steps of 15 m, fitted with a circular Gaussian model. |
| Open with DEXTER | |
 |
Fig. A.13
Panel a) IRAM PdBI continuum-subtracted map of the CO(1–0) core emission in I Zw 1. Contours correspond to 10σ (1σ rms level is 0.2 mJy beam-1). Panel b) shows the first moment map obtained within v ∈ ( − 200, 200) km s-1, by applying a flux threshold of 3 mJy. The size of the inset is 16 × 16 arcsec. Panel c) uv plot for the narrow core, with visibilities binned in uv radius steps of 5 m, fitted with a power-law function model of the form ∝ r-2. |
| Open with DEXTER | |
Appendix A.7: I Zw 1 (PG 0050+124)
In the LIRG and luminous QSO host I Zw 1 (PG 0050+124), we do not detect any CO(1–0) broad emission component, although its UV and X-ray spectra show some evidence of high velocity (~2000 km s-1), ionized outflows (Costantini et al. 2007). Figure A.13 shows the map and uv plot of the narrow CO(1–0) line of I Zw 1, integrated within v = ± 250 km s-1. The CO line emission appears well resolved by our observations, and the uv visibilities, binned in baseline steps of 5 m, can be fitted well with a power-law model of the form ∝ r-2, which gives an FWHM of 1.258 ± 0.041 kpc. The molecular gas traced by this narrow CO(1–0) component is mostly rotating in a central disk or ring, with a major axis of rotation oriented with a PA = − 50 deg (inset b of Fig. A.13).
© ESO, 2014
Current usage metrics show cumulative count of Article Views (full-text article views including HTML views, PDF and ePub downloads, according to the available data) and Abstracts Views on Vision4Press platform.
Data correspond to usage on the plateform after 2015. The current usage metrics is available 48-96 hours after online publication and is updated daily on week days.
Initial download of the metrics may take a while.