Fig. A.13
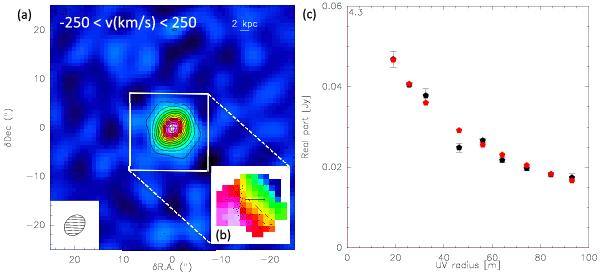
Panel a) IRAM PdBI continuum-subtracted map of the CO(1–0) core emission in I Zw 1. Contours correspond to 10σ (1σ rms level is 0.2 mJy beam-1). Panel b) shows the first moment map obtained within v ∈ ( − 200, 200) km s-1, by applying a flux threshold of 3 mJy. The size of the inset is 16 × 16 arcsec. Panel c) uv plot for the narrow core, with visibilities binned in uv radius steps of 5 m, fitted with a power-law function model of the form ∝ r-2.
Current usage metrics show cumulative count of Article Views (full-text article views including HTML views, PDF and ePub downloads, according to the available data) and Abstracts Views on Vision4Press platform.
Data correspond to usage on the plateform after 2015. The current usage metrics is available 48-96 hours after online publication and is updated daily on week days.
Initial download of the metrics may take a while.