Fig. 1
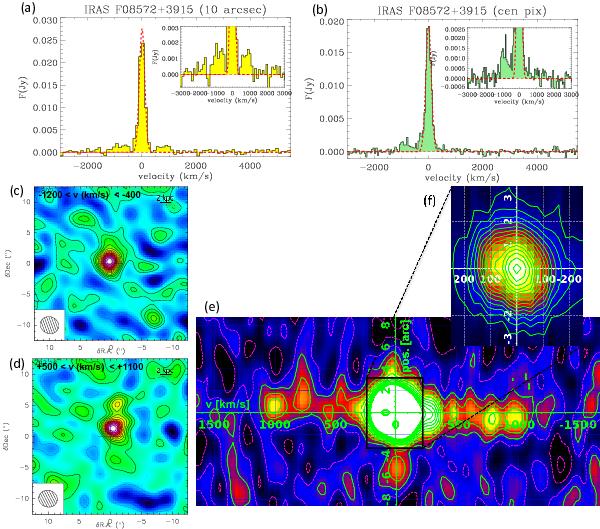
Continuum-subtracted IRAM-PdBI spectra, maps, and position–velocity diagram of the CO(1–0) emission line of IRAS F08572+3915. Panels a) and b) show the spectra extracted from a circular aperture with diameter of 10 arcsec and from the central pixel (i.e. the centroid of the integrated CO emission), respectively. For display purposes, the spectra are re-binned in channels of 107 km s-1a) and 54 km s-1b). In both panels the narrow core of the line is fitted with a single Gaussian function (red dashed line). c), d) Map of the CO(1–0) emission integrated in the blue and red wings. Contours correspond to 1σ (1σ rms level of the two maps is 0.1 mJy beam-1). The physical scale at the redshift of the source is 1.122 kpc arcsec-1. The cross indicates the pointing and phase centre (i.e. the peak of the radio (VLBI) emission), which corresponds to the NW nucleus of the merging pair IRAS F08572+3915. e), f) Position–velocity diagram along the major axis of the molecular disk rotation (as traced by the narrow core of the CO(1–0) line). Inset f) highlights the rotation pattern traced by the narrow component of the CO(1–0) line. Contours are in steps of 1σ (up to 10σ) in panel e) and 5σ in panel f); negative contours are in steps of 1σ (magenta dashed lines). Each pixel corresponds to 0.9 arcsec × 90 km s-1 in diagram e), and to 0.3 arcsec × 30 km s-1 in the inset f).
Current usage metrics show cumulative count of Article Views (full-text article views including HTML views, PDF and ePub downloads, according to the available data) and Abstracts Views on Vision4Press platform.
Data correspond to usage on the plateform after 2015. The current usage metrics is available 48-96 hours after online publication and is updated daily on week days.
Initial download of the metrics may take a while.