Free Access
Fig. 10
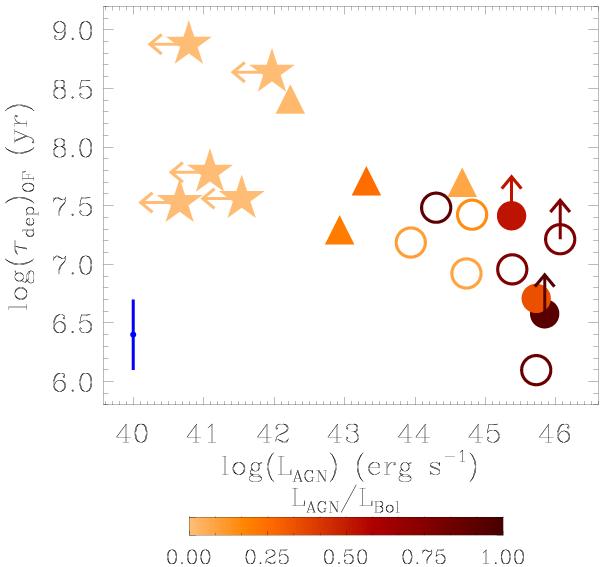
Molecular gas depletion time scale due to the molecular outflow ( ) versus AGN bolometric luminosity. Symbols and colour-coding as in Fig. 8. The uncertainties (±0.3 dex) on the depletion time scales (a representative error bar is shown at the bottom-left of the plot) are dominated by the errors in the outflow rates.
Current usage metrics show cumulative count of Article Views (full-text article views including HTML views, PDF and ePub downloads, according to the available data) and Abstracts Views on Vision4Press platform.
Data correspond to usage on the plateform after 2015. The current usage metrics is available 48-96 hours after online publication and is updated daily on week days.
Initial download of the metrics may take a while.