Fig. 8
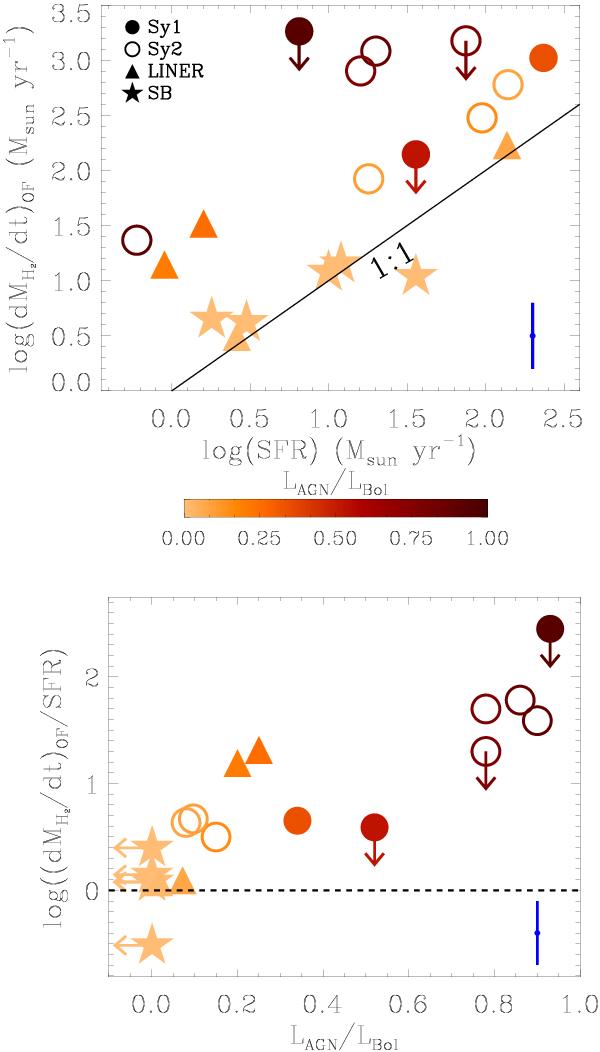
Top: outflow mass-loss rate as a function of the star formation rate for the extended sample of galaxies, whose general properties and outflow characteristics are summarised in Tables 3 and 4. Filled and open circles represent unobscured and obscured AGNs respectively, LINERs are plotted as upward triangles and “pure” starburst galaxies as stars (see legend at the top-left corner of the plot). Symbols are colour-coded according to the fraction of bolometric luminosity attributed to the AGN (LAGN/LBol). Outflow rates are derived by assuming, in the outflow, the conservative CO-to-H2 conversion factor αCO(1 − 0) = 0.8 for all of the sources. The black dashed line represents the 1:1 correlation between SFR and outflow mass-loss rate. Bottom: this plot indicates a positive correlation between the outflow mass loading factor ( /SFR) and LAGN/LBol that emerges from the diagram in the top panel. Notes: in the bottom-right of each panel we show an error bar that is representative for the whole sample, which does not take the uncertainty on the CO-to-H2 conversion factor into account (see text in Sect. 6 for a more detailed explanation), and corresponds to an average error of ±0.3 dex.
Current usage metrics show cumulative count of Article Views (full-text article views including HTML views, PDF and ePub downloads, according to the available data) and Abstracts Views on Vision4Press platform.
Data correspond to usage on the plateform after 2015. The current usage metrics is available 48-96 hours after online publication and is updated daily on week days.
Initial download of the metrics may take a while.