Fig. 9
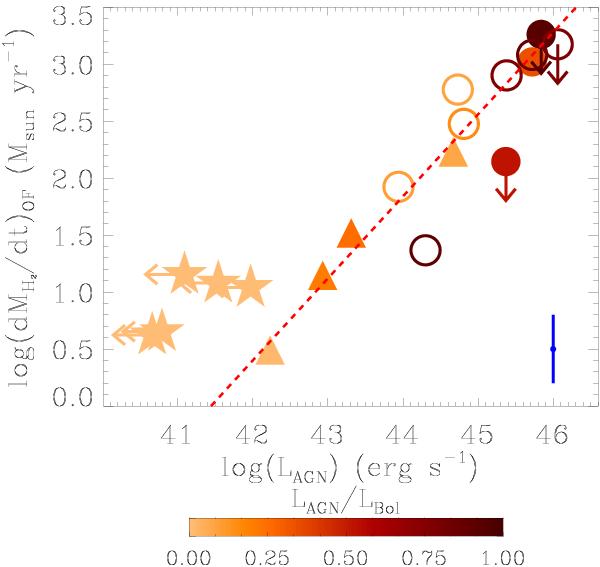
Outflow mass-loss rate as a function of the AGN bolometric luminosity, for the extended sample of galaxies (Tables 3 and 4). Symbols and colour-coding are as in Fig. 8. Error bars as in Fig. 8. For the “pure” starburst galaxies we set an upper limit to the AGN contribution by hypothesising that all of their hard X-ray (2–10 keV) unobscured luminosity is produced by an AGN (further explanation in Sect. 5). The red dashed relationship results from a linear fit to the AGN host-galaxies, in which the upper limits have been excluded.
Current usage metrics show cumulative count of Article Views (full-text article views including HTML views, PDF and ePub downloads, according to the available data) and Abstracts Views on Vision4Press platform.
Data correspond to usage on the plateform after 2015. The current usage metrics is available 48-96 hours after online publication and is updated daily on week days.
Initial download of the metrics may take a while.