| Issue |
A&A
Volume 561, January 2014
|
|
|---|---|---|
| Article Number | A99 | |
| Number of page(s) | 11 | |
| Section | Stellar structure and evolution | |
| DOI | https://doi.org/10.1051/0004-6361/201322328 | |
| Published online | 14 January 2014 | |
Discovery of periodic dips in the light curve of GX 13+1: the X-ray orbital ephemeris of the source
1
Dipartimento di Fisica e ChimicaUniversità di Palermo,
via Archirafi 36,
90123
Palermo,
Italy
e-mail:
This email address is being protected from spambots. You need JavaScript enabled to view it.
2
Dipartimento di Fisica, Università degli Studi di
Cagliari, SP Monserrato-Sestu, KM
0.7, 09042
Monserrato,
Italy
Received: 19 July 2013
Accepted: 23 October 2013
Abstract
Context. The bright low-mass X-ray binary (LMXB) GX 13+1 is one of the most peculiar Galactic binary systems. A periodicity of 24.27 d was observed in its power spectrum density obtained from data collected over 14 years by the All Sky Monitor (ASM) on board the Rossi X-ray Timing Explorer (RXTE).
Aims. To determine the first X-ray orbital ephemeris of GX 13+1, we systematically searched for periodic dips in the RXTE/ASM and Monitor of All-sky X-ray Image (MAXI) light curves of the source, the light curves span from 1996 up to 2013.
Methods. We searched for a periodic signal in the RXTE/ASM and MAXI light curves and find a common periodicity of 24.53 d. We folded the 1.3–5 keV and 5–12.1 keV RXTE/ASM light curves and the 2–4 and 4–10 keV MAXI light curves with the period of 24.53 d and detected a periodic dip. To refine the value of the period we divided the RXTE/ASM and MAXI light curves into eight and two intervals, respectively. Using the timing technique, we obtained four and two dip arrival times from the RXTE/ASM and MAXI light curves, respectively.
Results. We improved the X-ray position of GX 13+1 using a recent Chandra observation. The new X-ray position is discrepant by ~7″ from the previous one, while it is compatible with the infrared and radio counterpart positions. We detected an X-ray dip totally covered by the Chandra observation and showed, a posteriori, that it is a periodic dip. We obtained seven dip arrival times from RXTE/ASM, MAXI, and Chandra light curves. We calculated the delays of the detected dip arrival times with respect to the expected times for a 24.52 d periodicity. Fitting the delays with a linear function, we find that the orbital period and the epoch of reference of GX 13+1 are 24.5274(2) days and 50 086.79(3) MJD, respectively. We do not improve the fit by adopting a quadratic ephemeris. The inferred orbital period derivative of 8(37) × 10-8 s/s, with an error of 68% confidence level, does not allow us to constrain the orbital evolution of the binary system.
Conclusions. We demonstrated the existence of periodic dips in both RXTE/ASM and MAXI light curves, and estimated that the orbital period of GX 13+1 is 24.5274(2) d. The LMXB GX 13+1 has the longest known orbital period for a Galactic neutron star LMXB powered by Roche lobe overflow.
Key words: stars: neutron / stars: individual: GX 13+1 / X-rays: binaries / X-rays: stars / ephemerides
© ESO, 2014
1. Introduction
The object GX 13+1 is a bright low-mass X-ray binary (LMXB); the detection of sporadic X-ray bursts (Fleischman 1985; Matsuba et al. 1995) suggests that the accreting compact object is a neutron star. Using infrared data, Bandyopadhyay et al. (1999) estimated that the spectral type of the companion star is K5 III and the distance to the source is 7 ± 1 kpc. Ueda et al. (2001) detected, for the first time in a LMXB containing a neutron star, an absorption line, associated with Fe xxvi Kα, analysing the spectra of GX 13+1 obtained from the Solid-state Imaging Spectrometers (SIS) on board the Advanced Satellite for Cosmology and Astrophysics (ASCA) satellite. They suggested that the inclination angle of the system is relatively large. Using data collected by the European Photon Imaging Camera (Epic-pn) on board the X-ray Multi-Mirror Mission (XMM), Sidoli et al. (2002) found a more complex structure in the Fe-K region, detecting absorption lines associated with Ca xx, Fe xxv Kα and Fe xxv Kβ, Fe xxvi Kα, and Fe xxvi Kβ transitions. Ueda et al. (2004) studied the high energy resolution spectrum of GX 13+1 taken by the High Energy Transmission Grating Spectrometer (HETGS) on board the Chandra X-ray observatory and detected several absorption lines from highly-ionised ions of Fe, Mn, Cr, Ca, Ar, S, Si, and Mg. The authors detected a significant blueshift of those lines suggesting that the ionised plasma has an outflow velocity of ~400 km s-1. Furthermore, Ueda et al. (2004) inferred a mass outflow rate of Ṁ ≥ 7 × 10¹⁸ [(Ωtot/4π)/0.4] g s-1, where Ωtot is the total solid angle subtended by the plasma; this is comparable to the mass accretion rate in the inner part of the disk, 1018 g s-1, estimated from the continuum spectrum.
Recently, Díaz Trigo et al. (2012) analysed several XMM data sets of GX 13+1 fitting the continuum emission with a model consisting of a disc-black body, plus a black body component with a Gaussian emission line at 6.55–6.7 keV. The authors also found that the continuum emission is absorbed by cold and photo-ionised material and constrained the inclination of GX13+1 to be between 60 and 80° because of the presence of strong absorption along the line of sight, obscuring up to 80% of the total emission in one observation, and the absence of eclipses. Although GX 13+1 is thought to be a high inclination angle system belonging to the dipping source class of LMXBs, the estimation of its orbital period is not simple because it is quite large.
Corbet (2003) detected a period of 24.07 ± 0.02 days analysing the power spectrum of GX 13+1 obtained from data, spanning seven years, collected by the All-Sky Monitor (ASM) on board the Rossi X-ray Timing Explorer (RXTE). Corbet et al. (2010), using RXTE/ASM data spanning 14 years, estimated a period of 24.27 ± 0.03 days. If the periodicity of 24 days is the orbital period of the binary system, then GX 13+1 has the longest known orbital period for a Galactic neutron star LMXB; however, Corbet et al. (2010) noted that the periodic signal observed in the power spectrum is not strictly coherent and suggested that it might be caused by a structure that is not completely phase-locked with the orbital period. Corbet et al. (2010) proposed that the X-ray variability may be caused by an unresolved dipping modulation.
In this work, we report the first ephemeris of GX 13+1 with an accuracy of the orbital period by a factor of 100 larger than the previous value proposed by Corbet et al. (2010). The periodic dips are clearly observed in the RXTE/ASM light curve spanning almost 16 years, in the Monitor of All-sky X-ray Image (MAXI) light curve spanning four years, and during a recent Chandra/HETGS observation.
 |
Fig. 1 Chandra/HETGS image of GX 13+1 obtained from the reprocessed level-2 event file. The image is a detail close to the X-ray position. The grey scale represents the number of photons for each pixel integrated along the whole duration of the observation. Close to the zero-order position, the number of events is almost zero because of the strong pile-up. The yellow circle centred at RA = and Dec indicates the updated position of GX 13+1 (see text), and the red and white circles indicate the error boxes of the infrared and radio counterparts of GX 13+1. The magenta and the red crosses indicate the previous X-ray position of GX 13+1 in the SIMBAD and NED catalogue, respectively. |
2. Observations
2.1. Chandra
Chandra observed GX 13+1 nine times from 2000 to 2011. The corresponding obsids are 950 (see Smith et al. 2002), 2708 (see Ueda et al. 2001), 6093 (see Smith 2008), 11 814, 11 815, 11 816, 11 817, 11 818, and 13 197. We searched for the presence of dips in these light curves, and found one clear dip signature in the obsid 11 814. It was taken on 2010 August 1 00:31:31 UT for an exposure time of 29 ks and performed in timed graded mode using the HETGS. We reprocessed the data and used the level-2-event file to update the X-ray coordinates of GX 13+1. Because the zero-order X-ray image is strongly piled-up, the new coordinates were determined by fitting the intersection of the grating arms positions with the source readout streak (similar to the pipeline adopted by Iaria et al. 2006, 2007). The updated X-ray coordinates of the source are RA and Dec (referred to J2000.0) with an associated error of  , which is the overall 90% uncertainty circle of the Chandra X-ray absolute positional accuracy1. We obtained very similar values using the Chandra script tg_findzo. The new X-ray position is at
  from the position reported in the SIMBAD catalogue, while it is compatible with the infrared (Garcia et al. 1992) and radio (Grindlay & Seaquist 1986) counterpart positions. We show in Fig. 1 the new estimated position with the corresponding error marked by a yellow circle.
We performed a barycentring time correction to the level-2-event file with respect to the new X-ray coordinates using the tool axbary in the Chandra Interactive Analysis of Observations (CIAO) package. Finally, using the Chandra tool dmextract, we extracted the light curves in the 0.5–2 keV and 2–5 keV energy bands from the level-2-event file including the first-order medium energy grating (MEG) and high energy grating (HEG) events. The light curves binned at 32 s and the corresponding hardness ratio (HR) are shown in Fig. 2 (left panel).
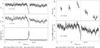 |
Fig. 2 Left panel: Chandra light curve of GX 13+1 between 55 409.03 and 55 409.37 MJD. Summed first-order MEG and HEG light curves in the 0.5–2 keV energy band (top), in the 2–5 keV energy band (middle), and the corresponding hardness ratio (bottom) are shown. The bin time is 32 s. Right panel: background subtracted RXTE/PCA light curve of GX 13+1 in the 2–4 keV energy band (top) and Chandra light curve of GX 13+1 in the 2–5 keV energy band (bottom). The solid vertical line indicates the estimated dip arrival time. The bin time is 32 s. |
The large increase of the HR around 16 000 s from the beginning of the observation (see bottom left panel of Fig. 2) suggests a large photoelectric absorption; the 0.5–2 keV count rate decreases more rapidly than the 2–5 keV count rate that is typical of a dip phenomenon. To estimate the arrival time of the dip, we fitted the HR data between 16 000 and 16 900 s, corresponding to the maximum of the HR with a constant plus a Gaussian profile assuming the centre of the Gaussian to be the arrival time of the dip. We assumed, as a 1-sigma uncertainty to this measure, the statistical error derived from the best-fitting centre of the Gaussian. The observation was taken between 55 409.03 and 55 409.37 MJD. We estimated that the minimum of the dip occurs at 55 409.22935(11) MJD.
Simultaneously, the Proportional Counter Array (PCA) on board RXTE observed GX 13+1 on 2010 August 1 from 01:29:03.56 UT to 08:38:55.56 UT (observations P95338-01-01-04, P95338-01-01-03, P95338-01-01-02, P95338-01-01-01, and P95338-01-01-05). We show the RXTE/PCA background-subtracted light curve of GX 13+1, obtained from the standard products in the 2–4 keV energy range, in the top right panel of Fig. 2. For sake of clarity, we also show in the bottom right panel of Fig. 2, the summed first-order MEG and HEG light curve in the 2–5 keV energy range. Unfortunately, the RXTE/PCA observation does not cover the dip observed by Chandra. The dip arrival time is indicated with the solid vertical line in Fig. 2 (right panels).
2.2. RXTE/ASM and MAXI
With the aim of finding periodic dips, we analysed the light curve of GX 13+1 taken by the RXTE/ASM; the light curve spans roughly 16 years from 50 088.21 to 55 865.44 MJD. The ASM consists of three scanning shadow cameras (SSCs) mounted on a rotating drive assembly. First, we performed a barycentring time correction to the ASM events with respect to the new X-ray coordinates using the tool faxbary. We extracted the 1.3–12 keV ASM light curve from each SSC. The SSC 1 light curve shows a slight decline of the flux in agreement with what is reported by Corbet et al. (2010). Using the ftools powspec in the XRONOS2 package, we produced two power spectrum densities (PSDs). The first PSD was obtained from the ASM light curve, including all the SSC events (hereafter SSC123 light curve), and the second one included only the SSC2 and SSC3 events (hereafter SSC23 light curve). We used a bin time of 50 ks for both the PSDs and 400 and 250 bins for the SSC123 and SSC23 light curve, respectively. A periodic signal between 22.78 and 26.92 d (indicated in frequency with the vertical red dashed lines in Fig. 3) is evident in both the PSDs. We explored the period window between 22.78 and 26.92 d, using the ftools efsearch in the XRONOS package, for both the light curves. We adopted 16 phase-bins per period (that is a bin time of close to 1.53 d) for the trial folded light curves and a resolution of the period search of 43.2 s and 86.4 s for the SSC123 and SSC23 light curve, respectively. We observe the largest peak of χ2 close to 24.53 d for both the light curves (vertical red line in Fig. 4), a smaller peak is observed at 24.12 d, which is indicated in Fig. 4 with a vertical green solid line. We also note that the periodicity of 24.27 ± 0.03 d (vertical solid blue and dashed blue lines in Fig. 4) suggested by Corbet et al. (2010) is not significantly detected in our search. Since we obtain the same periodic signals independent of the inclusion or exclusion of the SSC1 events, we conclude that the decline of the flux in the SSC1 does not affect our analysis. We therefore use, in the following, the ASM light curves including all the SSCs to obtain the largest available statistics.
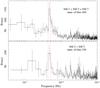 |
Fig. 3 Power spectrum densities of the 1.3–12.1 keV RXTE/ASM light curve, including all the SSCs (top panel) and only SSC2 and SSC3 (bottom panel). We adopted a bin time of 50 ks for both light curves and a number of bins of 400 and 250, respectively. A periodic signal is evident in both light curves and corresponds to a period between 22.78 and 26.92 d, which are indicated with the vertical dashed red lines. |
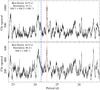 |
Fig. 4 Folding search of periodicities between 22.78 and 26.92 d in the ASM light curve, including all the SSCs (top panel) and including only SSC 2 and 3 (bottom panel), respectively. We adopted 16 phase-bins per period for the trial folded light curves and a resolution in the period search of 43.2 s (top panel) and 86.4 s (bottom panel). The maximum of χ2 is observed at 24.53 d (vertical red line) in both curves. The vertical solid green line indicates a possible periodicity at 24.12 d. The vertical solid blue and dashed blue lines indicate the period of 24.27 ± 0.03 d suggested by Corbet et al. (2010). The bin time is 1.53 d. |
We also searched for periodic signals in the one-orbit 2–10 keV light curve of GX 13+1 taken by the MAXI on board of the International Space Station (ISS; see Matsuoka et al. 2009). The light curve spans about four years. Adopting the new X-ray coordinates of GX 13+1, we applied the barycentring time correction to the light curve with respect to the centre of the mass of the solar system using the ftool earth2sun. Using the ftool efsearch, we searched for periodicities between 22.78 and 26.92 d, adopting 16 phase-bins per period in the trial folded light curves and a resolution of the period search of 86.4 s. We found three peaks of the χ2, which were fitted with Gaussian profiles; the centres of the three Gaussian profiles are close to 24 d, 24.53 d, and 25.6 d (see Fig. 5). The periodicity at 24.53 d (solid red line in Fig. 5) is the same as that found analysing the ASM light curve. The periodic signal at 24 d (solid green line in Fig. 5) is an instrumental signal due to an inappropriate subtraction of the background from the data collected by the 1550V cameras. The 1550V cameras collect events from the region of sky containing GX 13+1 for 24 days with respect to the total period of precession of the ISS (i.e., 70 days) and it leaves an excess of counts, which varies for 24 days (Tatehiro Mihara, MAXI team; priv. comm.). The periodicity at 25.6 d (dashed green line in Fig. 5) is similar to the period of 25.8 ± 0.03 d observed in the K-band light curve of GX 13+1 (Corbet et al. 2010). A similar but less significant periodic signal seems to be present in the ASM light curve at ~25.8 d. We plot the 25.6 d folded 2–4 and 4–10 keV MAXI light curves and the corresponding HR in Fig. 6 using as epoch 55 044.77 MJD and 100 phase-bins per period. A clear sinusoidal modulation with a period of 25.6 d is present in the HR. However, because we are interested in the presence of possible periodic dips in the ASM and MAXI light curves we will not discuss this periodic signal further. Finally, the vertical dashed blue and solid blue lines indicates the period of 24.27 ± 0.03 d suggested by Corbet et al. (2010), which is not significantly detected in our search.
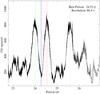 |
Fig. 5 Folding search of periodicities in the 2–10 keV MAXI light curve between 22.78 and 26.92 d. We adopted 16 phase-bins per period for the trial folded light curves and a resolution of the period search of 0.001 d. The vertical solid blue and dashed blue lines correspond to the period 24.27 ± 0.03 d suggested by Corbet et al. (2010). Three peaks of χ2 are detected: at 24.53 d (vertical red line), at 25.6 d (vertical dashed green line), and at 24 d (vertical solid green line). The latter period is an instrumental artifact (see text). The bin time is 1.53 d. |
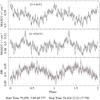 |
Fig. 6 25.6 d folded 2–4 keV and 4–10 keV MAXI light curves (upper and middle panels, respectively). The HR is shown in the bottom panel. We adopted 100 phase-bins per period and epoch 55 044.77 MJD. The HR shows an evident sinusoidal modulation (red curve in bottom panel) at the folded period. |
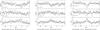 |
Fig. 7 RXTE/ASM folded light curves of GX 13+1 using the folding period 24.12 d (left block), 24.27 d (middle block), and 24.53 d (right block). We show the folded light curves in the 1.3–5 keV (upper panels) and 5–12.1 keV (middle panels) energy band, and the corresponding HRs (bottom panels) for each folding period. The folded light curves are obtained using 128 phase-bins per period. |
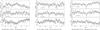 |
Fig. 8 MAXI folded light curves of GX 13+1 using the folding period 24.12 d (left block), 24.27 d (middle block), and 24.53 d (right block). We show the folded light curves in the 2–4 keV and 4–10 keV energy band and the corresponding HRs for each folding period. The folded light curves are obtained using 128 phase-bins per period. |
We folded the ASM light curves in the 1.3–5 keV and 5–12.1 keV using as a folding period 24.12 d, 24.53 d, and 24.27 d, respectively, obtaining three folded light curves for each adopted energy band. The ASM folded light curves and the corresponding HRs are shown in Fig. 7; the folded light curves are obtained using 128 phase bins per period. The 24.53 d folded light curves highlight the presence of a dip in the ASM light curve of GX 13+1. The 1.3–5 keV and 5–12.1 keV light curves show a decrease of the count rate from 12.2 to 10.1 c/s and from 8.9 to 8.3 c/s, respectively, close to phase 0 (see right panels of Fig. 7). At the same phase, the HR increases from 0.75 to 0.84. This suggests that the equivalent hydrogen column density associated with the local neutral (or partially ionised) matter increases at close to phase 0, reducing the count rate at low energies. A similar modulation is not observed at 24.12 d (see left panels of Fig. 7) and it is less significant when we use 24.27 d as a folding period (see centre panels of Fig. 7). We show the 2–4 and 4–10 keV MAXI folded light curves and the corresponding HRs in Fig. 8. We folded them using the periods of 24.12, 24.27, and 24.53 d and adopting 128 phase-bins per period. Also, in this case, we found that a periodic dip is present at close to phase 0 in the 24.53 d folded MAXI light curves (Fig. 8, right panels); the dip is absent in the 24.12 and 24.27 d folded MAXI light curves. During the dip the MAXI count rate per cm-2 decreases from 0.54 to 0.46 and from 0.49 to 0.46 in the 2–4 and 4–10 keV folded light curves, respectively, and the HR increases from 0.92 to 1.01 We conclude that a periodic signal at a period of 24.53 d is present both in the 1.3–12.1 keV ASM and 2–10 keV MAXI light curve; furthermore, the 24.53 d folded light curves highlight the presence of a periodic dip.
2.3. EXOSAT
Encouraged by these results, we looked for historical observations of GX 13+1, to find periodic dips in pointed observations, starting with data taken by the European X-ray Observatory Satellite (EXOSAT). We used the Medium Energy experiment (ME) light curves in the NASA archive3. The ME instrument on board EXOSAT observed GX 13+1 on 1983 Sep. 22 (seq. number 192), 1985 Apr. 1 (seq. number 1488) and 1985 May 2 (seq. number 1549). We analysed the corresponding 1–3.8 and 3.8–8 keV light curves and the corresponding HR; the light curves at two different energy bands and HRs are shown in Figs. 9 and 10.
We note that the light curves corresponding to the observation taken on 1983 Sep. 22 (Fig. 9) show a decrease of count rate at around 3000 s from the start time in both the energy bands and that the corresponding HR changes slightly going from 1.1 to 1.2. The light curves corresponding to the observation taken on 1985 May 2 (see Fig. 10) show a long-term modulation of the HR that is difficult to ascribe to the presence of a dip. The HR increases from 1.1 to 1.4 during the first 15 ks from the beginning of the observation, it rapidly increases from 1.1 to 1.3 at 17.5 ks from the start time, and, finally, it is quite constant at 1.15 in the last part of the observation. Although a change in HR is evident, we are not able to ascribe this behaviour to a dip. Consequently, we will not use the EXOSAT observations in our analysis.
2.4. XMM/RGS
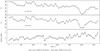 |
Fig. 9 EXOSAT/ME light curves of GX 13+1 between 45 599.95 and 45 599.99 MJD. Light curves in the 1–3.8 keV (top panel), in the 3.8–8 keV (middle panel) energy band, and the corresponding HR (bottom panel) are shown. The bin time is 64 s. |
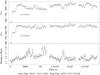 |
Fig. 10 EXOSAT/ME light curves of GX 13+1 between 46 187.31 and 46 187.64 MJD. Light curves in the 1–3.8 keV (top panel), in the 3.8–8 keV (middle panel) energy band, and the corresponding HR (bottom panel) are shown. The bin time is 64 s. |
The LMXB GX 13+1 was observed nine times by XMM; a complete analysis of the Reflection Grating Spectrometer (RGS) and Epic-pn light curves and spectra of the source has recently been reported by Díaz Trigo et al. (2012). The most significant detection of a dip is during the observation ID 0505480501 taken on 2008 March 25. However, the dip was observed only partially by the RGS because it occurred at the beginning of the observation while the EPIC-pn was still off. The start and stop times of the RGS observation are 54 550.97 and 54 551.12 MJD, respectively. We show the background-subtracted light curves of the summed 1st-order RGS1 and RGS2 data in the 0.3–1.5 keV (upper panel of Fig. 11) and 1.5–2.5 keV (middle panel of Fig. 11) energy band. The corresponding HR is shown in the lower panel of Fig. 11. The HR is the hardest (about 7) during the first 1000 s of the observation, then drops to a value of 4, suggesting that the decrease of the RGS count rate at the beginning of the observation is associated with a dipping phenomenon.
We do not have complete coverage of the dip and are not able to give a precise estimate of the dip arrival time. To get more information on this dip, we looked for it in the 1.3–5 keV RXTE/ASM light curve. We show the RXTE/ASM light curve at between 54 545 and 54 555 MJD in Fig. 12; the start and stop times of the RGS observation are indicated with the dashed red vertical lines. The RXTE/ASM light curve of GX 13+1 shows that the RGSs observed only the end of the dip. We do not take this dip into account for our analysis because we were not able to estimate its arrival time exactly. However, we comment a-posteriori on our results comparing them with the RXTE/ASM light curve shown in Fig. 12.
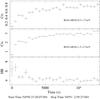 |
Fig. 11 RGS light curves during the XMM observation ID 0505480501, between 54 550.97 and 54 551.12 MJD. Upper panel: the 0.3–1.5 keV RGS light curve. Middle panel: the 1.5–2.5 keV RGS light curve. Lower panel: the corresponding HR. The bin time is 512 s. |
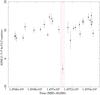 |
Fig. 12 RXTE/ASM light curve of GX 13+1 in the 1.3–5 keV energy band between 54 545 and 54 555 MJD. The bin time is 1000 s. The vertical dotted lines indicate the start and stop times of the RGS observation. The vertical solid line indicates the expected dip arrival time (i.e., 54 550.78 MJD), adopting the ephemeris of Eq. (2) (see text). |
3. Ephemeris of GX 13+1
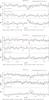 |
Fig. 13 RXTE/ASM folded light curves of GX 13+1 in the 1.3–5 keV (top panels) and 5–12.1 keV energy band (middle panels) covering about 714 days. The corresponding HRs are plotted in the bottom panels. The folding period is 24.52 d and 150 phase-bins per period were adopted. The solid red line is the best-fit curve composed of a constant, plus a sinusoidal function with its period kept fixed to 24.52 d and a Gaussian profile fitting the dip. |
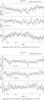 |
Fig. 14 MAXI folded light curves of GX 13+1 in the 2–4 keV (top panels) and 4–10 keV energy band (middle panels) covering about 680 days. The folding period is 24.52 d and 150 phase-bins per period were adopted. The solid red line is defined in the text and in Fig. 13. |
To estimate with best accuracy the period of GX 13+1, we used a timing technique (see, e.g., Iaria et al. 2011, and references therein, for an example of the application of timing techniques to improve orbital ephemeris). To obtain several dip arrival times, we divided the 1.3–5 keV and 5–12.1 keV ASM light curves in eight intervals. The corresponding temporal windows of each of the eight light curves cover about 29 cycles (~714 days). For each interval, the soft and hard light curves were folded adopting an arbitrary folding period of 24.52 d (close to 24.53 d observed in the ASM and MAXI light curves), an arbitrary reference time of 50 086 MJD, and, finally, 150 phase-bins per period. The presence of a periodic dip in the folded light curves was significantly detected only in intervals 1, 4, and 7 (Fig. 13). The start and stop times of these intervals are shown in Table 1. To estimate the dip arrival times, we fitted the 1.3–5 keV folded light curves with a model consisting of a constant plus a sinusoidal function, with the period kept fixed to 1 (that is 24.52 d), adding a Gaussian component with a negative normalisation to fit the dip shape and assuming the centroid of the Gaussian component as the dip arrival times. We took care to fit only the dip in the 1.3–5 keV folded light curve showing an evident increase of the HR [5−12.1 keV]/[1.3−5 keV].
Journal of the X-ray dip arrival times of GX 13+1.
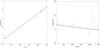 |
Fig. 15 Delays in units of days of the dip arrival times plotted versus the corresponding cycle number; the Chandra point is indicated with a blue open square. Left panel: trial period of 24.52 d and epoch 50 086 MJD; the solid line represents the linear ephemeris shown in Eq. (1). Right panel: trial period of 24.5277 d and epoch 50 086.72 MJD. The solid line and the dashed curve indicate the linear ephemeris shown in Eq. (2) and the quadratic ephemeris of Eq. (3), respectively. |
Adopting the same procedure we divided the 2–4 keV MAXI light curve into two intervals, the corresponding temporal windows of each of the two MAXI light curves cover about 28 cycles (~680 days). We show the MAXI folded light curves in Fig. 14 and report the journal of the X-ray dip arrival times in Table 1.
This analysis allows us to obtain five dip arrival times from the ASM and MAXI light curves. Note that to increase the statistics in the ASM and MAXI light curves, we selected large temporal windows, covering 29 and 28 cycles in the RXTE/ASM and MAXI light curves, respectively. We adopted as the epoch of reference, the arbitrary value of 50 086 MJD and calculated the delays of the dip arrival times with respect to those predicted by the trial folding period of 24.52 d. We assigned the cycle number corresponding to the half time of the window to each temporal window. We initially fitted the delays vs orbital cycle with a linear function f and took only the errors associated with the dip arrival times (hereafter Δy) into account, obtaining a first estimation of the corrections to the epoch of reference and orbital period. Since each temporal window contains a large number of cycles, we took the uncertainty associated with this large number into account, combining Δy with the error associated with the cycles (hereafter Δx) using the relation (Δtot)2 = (Δy)2 + (∂f/∂xΔx)2, and again fitted the delays vs cycles. The values of the parameter Δtot are the errors associated with the dip arrival times shown in Table 1.
We obtained six dip arrival times: one from Chandra, two from the folded MAXI light curves, and, finally, three from the folded RXTE/ASM light curves. We corrected the orbital period, fitting the delays with a linear function. The linear ephemeris is  (1)where N is the number of cycles, 50 086.72(7) is the new epoch of reference, and the revised orbital period is P = 24.5277(3) d. The χ2(d.o.f.) is 5.8(4) and the associated errors are at 68% confidence level. Here and in what follows, we scaled the uncertainties in the parameters by a factor of
  to take a
  of the best-fit model larger than 1 into account. We show the delays versus the orbital cycles with the best-fit linear ephemeris in Fig. 15 (left panel).
We also determined the linear ephemeris, excluding the Chandra point, to avoid the possibility that it drive our fit. In this case, we found that the new epoch of reference is 50 086.73(9) and the revised orbital period is P = 24.5276(5) d. This result is compatible, within 1σ, with that shown in Eq. (1) and suggests that the Chandra point does not drive the fit and that the dip observed in the Chandra light curve is periodic. Furthermore, we started with a trial period of 24.52 d finally obtaining a period of 24.5277 d which is very similar to the value of 24.53 d obtained independently in a search for periodicities in the RXTE/ASM and MAXI light curves (see Figs. 4 and 5).
Then, we applied the whole procedure to the RXTE/ASM and MAXI light curves again, adopting as the folding period 24.5277 d and as the epoch of reference 50 086.72 MJD to refine our results. The selected intervals for the two light curves are the same as described above. Using these two accurate values we were also able to detect a periodic dip in Interval 2 of the RXTE/ASM light curves. The journal of the seven dips is shown in Table 2.
Journal of the refined X-ray dip arrival times of GX 13+1.
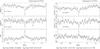 |
Fig. 16 RXTE/ASM (left panel) and MAXI (right panel) folded light curves and the corresponding HRs using the ephemeris of Eq. (2). The RXTE/ASM and MAXI light curves are folded using 128 phase-bins per period. |
We corrected the orbital period, fitting the seven delays with a linear function. The linear fit of the seven points is shown in Fig. 15 (right panel). The refined linear ephemeris is  (2)The χ2(d.o.f.) is 6.76(5) and the associated errors are at a 68% confidence level. We folded the 1.3–5 keV and 5–12.1 keV RXTE/ASM light curves, and adopted the epoch of references and the period of Eq. (2) (see left panels of Fig. 16). Both the light curves cover ~236 cycles. The periodic dip evident in both the RXTE/ASM energy bands and the HR shows a more pronounced increase at phase 0. To quantify the improvement of the orbital period after the correction achieved using the timing technique, we defined the fraction f = (HRmax − HRave)/(HRmax + HRave), where HRave is the average value of HR between phase 0.1 and 0.9 and HRmax is the HR at phase 0. We obtain that f is 6.1% and 8.6% for the 24.53 and 24.5274 d folded ASM light curves, respectively.
We folded the 2–4 keV and 4–10 keV MAXI light curves by adopting the epoch of references and the period of Eq. (2) (right panels of Fig. 16). Both the light curves cover ~56 cycles. The values of f are 4.5% and 5% for the 24.53 and 24.5274 d folded MAXI light curves, respectively. The largest increase of the HR associated with the RXTE/ASM light curves is mainly due to the wider spanning time that RXTE/ASM covers (~16 yr) with respect to MAXI (~4 yr).
Finally, we added a quadratic term to the ephemeris to take a possible period derivative into account. In this case, we obtained the following quadratic ephemeris  (3)with a χ2(d.o.f.) of 6.7(4). By adding the quadratic term, we do not obtain a significant improvement of the fit. The corresponding period derivative is 8(37) × 10-8 s/s with the associated error at a 68% confidence level. The best-fit curve associated with the quadratic ephemeris is shown in Fig. 15 (right panel) with a dashed curve.
Journal of the XMM observations of GX 13+1.
Using the linear ephemeris of Eq. (2), we determined the expected dip arrival time nearest the XMM/RGS observation discussed in Sect. 2.4. The corresponding cycle number is 182 and the predicted arrival time is 54 550.78 MJD. We show the RXTE/ASM light curve between 54 545 and 54 555 MJD in Fig. 12. We indicate the start and stop times (54 550.97 and 54 551.12 MJD, respectively) of the XMM/RGS observation with the vertical dashed red lines; the predicted dip arrival time using the ephemeris of Eq. (2) is plotted with a vertical solid red line. The separation in units of the orbital phase of the expected dip arrival time from the RGS start time is only 0.19 d. We conclude that our predicted arrival time is compatible with the RXTE/ASM light curve and that the RGS instruments observed only the final part of a periodic dip.
Díaz Trigo et al. (2012) suggest the presence of possible dipping states in RXTE/PCA, EXOSAT, and XMM observations. We, therefore, searched for possible periodic dips in the RXTE/PCA archival data. We analysed the barycentred 2–4 and 4–9 keV light curves obtained from the standard2 products and found that there are no observations covering the phase 0 (i.e., the phase at which we expect the dip), except for observation P95338-01, which unfortunately has a hole in the light curve at the expected dip arrival time (see Sect. 2.1). The observation P95338-01 spans 12 days covering almost one half of the orbital period. The HR ranges between 2 and 2.6, reaching the maximum value at phases 0.95 and close to 1.
Díaz Trigo et al. (2012) suggest a possible dipping state of GX 13+1 observed with the RXTE/PCA in the observations P30050-01 and P30051-01. However, the authors did not perform a systematic search for dips and their suggestion is based on the bi-modal behaviour of the count rate with the HR reported by Schnerr et al. (2003). We re-analysed the RXTE/PCA observations P30050-01 and P30051-01 which span a time interval from 50 950 to 51 096 MJD (i.e., 5.94 orbital cycles for a period of 25.5274 d). We analysed the barycentred 2–4 and 4–9 keV light curves and extracted the corresponding HR. We found that the HR has an erratic behaviour along the orbital phase, varying between 2.5 and 3.5 and reaching the maximum value of 3.8 at phase 0.38. The observations do not cover the phase at which the periodic dip is expected; the pointed observations closest to the phase 0 are P30051-01-06-00 and P30051-01-10-00 (phase at the start time 0.98 and 0.97, respectively). Finally, we also analysed the RXTE/PCA observations P40023-03 and P40022-01, which span ~171 days (i.e., ~seven orbital periods). The HR ranges between 1.8 and 2.2 and has a peak at phase 0.19 reaching the value of 2.7.
Díaz Trigo et al. (2012) also suggest the presence of a possible dipping state of GX 13+1 in the EXOSAT observation taken on 1983 Sep. 22 (see Sect. 2.1); using the linear ephemeris of Eq. (2) we find that the start time of that observation corresponds to phase 0.07 meaning that the dip arrival time is predicted at ~144 ks before the start time), that is quite far from the expected periodic dip arrival time. The EXOSAT observation taken on 1985 May 2 corresponds to an orbital-phase interval 0.015–0.029, which is ~33 ks after the expected periodic dip.
The presence of dipping states was also suggested in XMM/Epic-pn observations. For the sake of completeness, we report in Table 3 the list of the XMM observations of GX 13+1 using the same indices adopted by Díaz Trigo et al. (2012) in their paper. We added, for further information, the orbital phase associated with each of the XMM/Epic-pn start time adopting the ephemeris of Eq. (2). In this case, we converted in phase the start time in UTC instead of TDB; however, in our case, the effects of the barycentring time correction is irrelevant because of the large period of 24.5274 d. We note that the dipping states of GX 13+1 suggested by Díaz Trigo et al. (2012) are nearly independent of the orbital phase.
Finally, Chandra observed GX 13+1 nine times; we report in Table 4 the list of the observations and the orbital phase at the start time of each Chandra observation.
Journal of the Chandra observations of GX 13+1.
4. Discussion and conclusion
We have analysed archival data of GX 13+1 from Chandra, XMM, RXTE, EXOSAT, and MAXI, with the aim of looking for periodic dips in this source. Using a Chandra/HETGS observation, we improved the X-ray position of GX 13+1, which is now compatible with the positions of the infrared and radio counterparts of GX 13+1. Using the new coordinates, we performed a barycentring time correction of the RXTE/ASM and MAXI light curve of GX 13+1. We performed a PSD of the 1.3–12.1 keV RXTE/ASM light curve detecting a periodic signal at a period between 22.78 and 26.92 d. To refine the periodic signal we used the ftool efsearch and looked at the period window between 22.78 and 26.92 d in the 1.3–12.1 keV RXTE/ASM and 2–10 keV MAXI light curves. We detected a significant common periodic signal in the two light curves at 24.53 d. The 24.53 d folded RXTE/ASM and MAXI light curves in two different energy bands (1.3–5 and 5–12.1 keV for RXTE/ASM and 2–4 and 4–10 keV for MAXI) and the corresponding HRs clearly show that the periodic signal is associated with a periodic dip present in the light curves.
To improve the value of 24.53 d and to obtain the orbital ephemeris of GX 13+1, we used the timing technique after dividing the RXTE/ASM and MAXI light curves into eight and two time intervals, respectively. Finally we obtained four dip arrival times from the RXTE/ASM light curves and two dips arrival times from the MAXI light curve. We showed that the dip observed in a recent Chandra observation is well fitted using the ephemeris obtained by our dip arrival times. The linear ephemeris gave a refined period of 24.5274(2) d that we interpret as the orbital period of the system.
So far, the absence of periodic signatures in the light curve of GX 13+1 has made it difficult to accurately estimate its orbital period. Before this work, the most accurate estimation of the orbital period of the system was given by Corbet et al. (2010), who looked for periodicities in the RXTE/ASM light curve spanning 14 years and found a period of 24.27 ± 0.03 days, which is not compatible with our result; however, the associated error to the period reported by Corbet et al. (2010) is a formal statistical error and it could be larger. The detection of periodic dips allows us to determine accurate X-ray ephemeris of GX 13+1 and to improve the accuracy of the period by a factor of 100.
From the analysis of the delays associated with the dip arrival times we obtained the linear and quadratic ephemerides of GX 13+1. The goodness of our orbital solution is evident when we fold the whole RXTE/ASM and MAXI light curves (Fig. 16) after correcting the event arrival times for the new orbital solution, since in this case both the light curves show a clear dip at phase 0 with a corresponding increase of the HRs. If the proposed period of 24.5274 d, obtained by studying the periodic dips in the light curve of GX 13+1, is confirmed as the orbital period of the system, then GX 13+1 has the longest known orbital period for a Galactic LMXB hosting a neutron star powered by Roche lobe overflow.
A posteriori, we searched for periodic dips in all pointed observations of GX 13+1. Díaz Trigo et al. (2012) suggested the presence of possible dipping states in EXOSAT (see Stella et al. 1985), RXTE/PCA (see Schnerr et al. 2003), and XMM/Epic-pn observations (see Díaz Trigo et al. 2012). We have analysed these observations and find that these dipping states are not related to the orbital phase. We believe that the periodic dips shown in this work are connected to the periodic motion of the hot spot at the outer accretion disc caused by the impact of the stream of matter from the companion star. On the other hand, the dipping state in GX 13+1 observed by Díaz Trigo et al. (2012) in several XMM observations and the bi-modal behaviour of the HR with respect to the intensity of the source observed by Schnerr et al. (2003) in the RXTE/PCA observations P30050-01 and P30051-01 and by Stella et al. (1985) in the EXOSAT observation taken on 1983 September 22, may be caused by partial absorption in the large outflow of matter from the inner region of the system detected by several authors (see, e.g., Ueda et al. 2001, 2004; Díaz Trigo et al. 2012).
Finally, we also tried to estimate the orbital period derivative and we reported the quadratic ephemeris of the source. We find only a loose constraint on the period derivative of 8(37) × 10-8 s/s, with the error at 68% confidence level. The large uncertainty associated with the quadratic term does not allow us to draw a firm conclusion and further observations are needed to constrain this result.
See http://cxc.harvard.edu/cal/ASPECT/celmon/ for more details.
See http://heasarc.gsfc.nasa.gov/ftools/xronos.html for more details.
The standard filtering of the ME light curves is shown at http://heasarc.gsfc.nasa.gov/W3Browse/exosat/me.html
Acknowledgments
This research has made use of MAXI data provided by RIKEN, JAXA, and the MAXI team. A.R. gratefully acknowledges Sardinia Regional Government for the financial support (P.O.R. Sardegna F.S.E. Operational Programme of the Autonomous Region of Sardinia, European Social Fund 2007–2013 – Axis IV Human Resources, Objective l.3, Line of Activity l.3.1 Avviso di chiamata per il finanziamento di Assegni di Ricerca). Work in Cagliari was partially funded by the Regione Autonoma della Sardegna through POR-FSE Sardegna 2007–2013, L.R. 7/2007, Progetti di ricerca di base e orientata, Project No CRP-60529.
References
- Bandyopadhyay, R. M., Shahbaz, T., Charles, P. A., & Naylor, T. 1999, MNRAS, 306, 417 [NASA ADS] [CrossRef] [Google Scholar]
- Corbet, R. H. D. 2003, ApJ, 595, 1086 [NASA ADS] [CrossRef] [Google Scholar]
- Corbet, R. H. D., Pearlman, A. B., Buxton, M., & Levine, A. M. 2010, ApJ, 719, 979 [NASA ADS] [CrossRef] [Google Scholar]
- Díaz Trigo, M., Sidoli, L., Boirin, L., & Parmar, A. N. 2012, A&A, 543, A50 [NASA ADS] [CrossRef] [EDP Sciences] [Google Scholar]
- Fleischman, J. R. 1985, A&A, 153, 106 [NASA ADS] [Google Scholar]
- Garcia, M. R., Grindlay, J. E., Bailyn, C. D., et al. 1992, AJ, 103, 1325 [NASA ADS] [CrossRef] [Google Scholar]
- Grindlay, J. E., & Seaquist, E. R. 1986, ApJ, 310, 172 [NASA ADS] [CrossRef] [Google Scholar]
- Iaria, R., Di Salvo, T., Lavagetto, G., Robba, N. R., & Burderi, L. 2006, ApJ, 647, 1341 [NASA ADS] [CrossRef] [Google Scholar]
- Iaria, R., di Salvo, T., Lavagetto, G., D’Aí, A., & Robba, N. R. 2007, A&A, 464, 291 [NASA ADS] [CrossRef] [EDP Sciences] [Google Scholar]
- Iaria, R., Di Salvo, T., Burderi, L., et al. 2011, A&A, 534, A85 [NASA ADS] [CrossRef] [EDP Sciences] [Google Scholar]
- Matsuba, E., Dotani, T., Mitsuda, K., et al. 1995, PASJ, 47, 575 [NASA ADS] [Google Scholar]
- Matsuoka, M., Kawasaki, K., Ueno, S., et al. 2009, PASJ, 61, 999 [NASA ADS] [CrossRef] [Google Scholar]
- Schnerr, R. S., Reerink, T., van der Klis, M., et al. 2003, A&A, 406, 221 [NASA ADS] [CrossRef] [EDP Sciences] [Google Scholar]
- Sidoli, L., Parmar, A. N., Oosterbroek, T., & Lumb, D. 2002, A&A, 385, 940 [NASA ADS] [CrossRef] [EDP Sciences] [Google Scholar]
- Smith, R. K. 2008, ApJ, 681, 343 [NASA ADS] [CrossRef] [Google Scholar]
- Smith, R. K., Edgar, R. J., & Shafer, R. A. 2002, ApJ, 581, 562 [NASA ADS] [CrossRef] [Google Scholar]
- Stella, L., White, N. E., & Taylor, B. G. 1985, in Recent Results on Cataclysmic Variables. The Importance of IUE and Exosat Results on Cataclysmic Variables and Low-Mass X-Ray Binaries, ed. W. R. Burke, ESA SP, 236, 125 [Google Scholar]
- Ueda, Y., Asai, K., Yamaoka, K., Dotani, T., & Inoue, H. 2001, ApJ, 556, L87 [NASA ADS] [CrossRef] [Google Scholar]
- Ueda, Y., Murakami, H., Yamaoka, K., Dotani, T., & Ebisawa, K. 2004, ApJ, 609, 325 [NASA ADS] [CrossRef] [Google Scholar]
All Tables
All Figures
|
Fig. 1 Chandra/HETGS image of GX 13+1 obtained from the reprocessed level-2 event file. The image is a detail close to the X-ray position. The grey scale represents the number of photons for each pixel integrated along the whole duration of the observation. Close to the zero-order position, the number of events is almost zero because of the strong pile-up. The yellow circle centred at RA = and Dec indicates the updated position of GX 13+1 (see text), and the red and white circles indicate the error boxes of the infrared and radio counterparts of GX 13+1. The magenta and the red crosses indicate the previous X-ray position of GX 13+1 in the SIMBAD and NED catalogue, respectively. |
| In the text | |
|
Fig. 2 Left panel: Chandra light curve of GX 13+1 between 55 409.03 and 55 409.37 MJD. Summed first-order MEG and HEG light curves in the 0.5–2 keV energy band (top), in the 2–5 keV energy band (middle), and the corresponding hardness ratio (bottom) are shown. The bin time is 32 s. Right panel: background subtracted RXTE/PCA light curve of GX 13+1 in the 2–4 keV energy band (top) and Chandra light curve of GX 13+1 in the 2–5 keV energy band (bottom). The solid vertical line indicates the estimated dip arrival time. The bin time is 32 s. |
| In the text | |
|
Fig. 3 Power spectrum densities of the 1.3–12.1 keV RXTE/ASM light curve, including all the SSCs (top panel) and only SSC2 and SSC3 (bottom panel). We adopted a bin time of 50 ks for both light curves and a number of bins of 400 and 250, respectively. A periodic signal is evident in both light curves and corresponds to a period between 22.78 and 26.92 d, which are indicated with the vertical dashed red lines. |
| In the text | |
|
Fig. 4 Folding search of periodicities between 22.78 and 26.92 d in the ASM light curve, including all the SSCs (top panel) and including only SSC 2 and 3 (bottom panel), respectively. We adopted 16 phase-bins per period for the trial folded light curves and a resolution in the period search of 43.2 s (top panel) and 86.4 s (bottom panel). The maximum of χ2 is observed at 24.53 d (vertical red line) in both curves. The vertical solid green line indicates a possible periodicity at 24.12 d. The vertical solid blue and dashed blue lines indicate the period of 24.27 ± 0.03 d suggested by Corbet et al. (2010). The bin time is 1.53 d. |
| In the text | |
|
Fig. 5 Folding search of periodicities in the 2–10 keV MAXI light curve between 22.78 and 26.92 d. We adopted 16 phase-bins per period for the trial folded light curves and a resolution of the period search of 0.001 d. The vertical solid blue and dashed blue lines correspond to the period 24.27 ± 0.03 d suggested by Corbet et al. (2010). Three peaks of χ2 are detected: at 24.53 d (vertical red line), at 25.6 d (vertical dashed green line), and at 24 d (vertical solid green line). The latter period is an instrumental artifact (see text). The bin time is 1.53 d. |
| In the text | |
|
Fig. 6 25.6 d folded 2–4 keV and 4–10 keV MAXI light curves (upper and middle panels, respectively). The HR is shown in the bottom panel. We adopted 100 phase-bins per period and epoch 55 044.77 MJD. The HR shows an evident sinusoidal modulation (red curve in bottom panel) at the folded period. |
| In the text | |
|
Fig. 7 RXTE/ASM folded light curves of GX 13+1 using the folding period 24.12 d (left block), 24.27 d (middle block), and 24.53 d (right block). We show the folded light curves in the 1.3–5 keV (upper panels) and 5–12.1 keV (middle panels) energy band, and the corresponding HRs (bottom panels) for each folding period. The folded light curves are obtained using 128 phase-bins per period. |
| In the text | |
|
Fig. 8 MAXI folded light curves of GX 13+1 using the folding period 24.12 d (left block), 24.27 d (middle block), and 24.53 d (right block). We show the folded light curves in the 2–4 keV and 4–10 keV energy band and the corresponding HRs for each folding period. The folded light curves are obtained using 128 phase-bins per period. |
| In the text | |
|
Fig. 9 EXOSAT/ME light curves of GX 13+1 between 45 599.95 and 45 599.99 MJD. Light curves in the 1–3.8 keV (top panel), in the 3.8–8 keV (middle panel) energy band, and the corresponding HR (bottom panel) are shown. The bin time is 64 s. |
| In the text | |
|
Fig. 10 EXOSAT/ME light curves of GX 13+1 between 46 187.31 and 46 187.64 MJD. Light curves in the 1–3.8 keV (top panel), in the 3.8–8 keV (middle panel) energy band, and the corresponding HR (bottom panel) are shown. The bin time is 64 s. |
| In the text | |
|
Fig. 11 RGS light curves during the XMM observation ID 0505480501, between 54 550.97 and 54 551.12 MJD. Upper panel: the 0.3–1.5 keV RGS light curve. Middle panel: the 1.5–2.5 keV RGS light curve. Lower panel: the corresponding HR. The bin time is 512 s. |
| In the text | |
|
Fig. 12 RXTE/ASM light curve of GX 13+1 in the 1.3–5 keV energy band between 54 545 and 54 555 MJD. The bin time is 1000 s. The vertical dotted lines indicate the start and stop times of the RGS observation. The vertical solid line indicates the expected dip arrival time (i.e., 54 550.78 MJD), adopting the ephemeris of Eq. (2) (see text). |
| In the text | |
|
Fig. 13 RXTE/ASM folded light curves of GX 13+1 in the 1.3–5 keV (top panels) and 5–12.1 keV energy band (middle panels) covering about 714 days. The corresponding HRs are plotted in the bottom panels. The folding period is 24.52 d and 150 phase-bins per period were adopted. The solid red line is the best-fit curve composed of a constant, plus a sinusoidal function with its period kept fixed to 24.52 d and a Gaussian profile fitting the dip. |
| In the text | |
|
Fig. 14 MAXI folded light curves of GX 13+1 in the 2–4 keV (top panels) and 4–10 keV energy band (middle panels) covering about 680 days. The folding period is 24.52 d and 150 phase-bins per period were adopted. The solid red line is defined in the text and in Fig. 13. |
| In the text | |
|
Fig. 15 Delays in units of days of the dip arrival times plotted versus the corresponding cycle number; the Chandra point is indicated with a blue open square. Left panel: trial period of 24.52 d and epoch 50 086 MJD; the solid line represents the linear ephemeris shown in Eq. (1). Right panel: trial period of 24.5277 d and epoch 50 086.72 MJD. The solid line and the dashed curve indicate the linear ephemeris shown in Eq. (2) and the quadratic ephemeris of Eq. (3), respectively. |
| In the text | |
|
Fig. 16 RXTE/ASM (left panel) and MAXI (right panel) folded light curves and the corresponding HRs using the ephemeris of Eq. (2). The RXTE/ASM and MAXI light curves are folded using 128 phase-bins per period. |
| In the text | |
Current usage metrics show cumulative count of Article Views (full-text article views including HTML views, PDF and ePub downloads, according to the available data) and Abstracts Views on Vision4Press platform.
Data correspond to usage on the plateform after 2015. The current usage metrics is available 48-96 hours after online publication and is updated daily on week days.
Initial download of the metrics may take a while.