Fig. 8
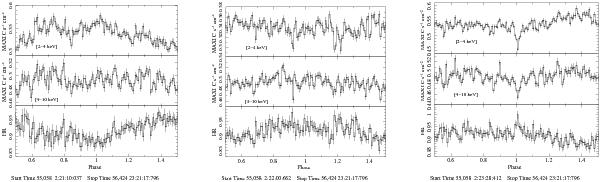
MAXI folded light curves of GX 13+1 using the folding period 24.12 d (left block), 24.27 d (middle block), and 24.53 d (right block). We show the folded light curves in the 2–4 keV and 4–10 keV energy band and the corresponding HRs for each folding period. The folded light curves are obtained using 128 phase-bins per period.
Current usage metrics show cumulative count of Article Views (full-text article views including HTML views, PDF and ePub downloads, according to the available data) and Abstracts Views on Vision4Press platform.
Data correspond to usage on the plateform after 2015. The current usage metrics is available 48-96 hours after online publication and is updated daily on week days.
Initial download of the metrics may take a while.