Fig. 3
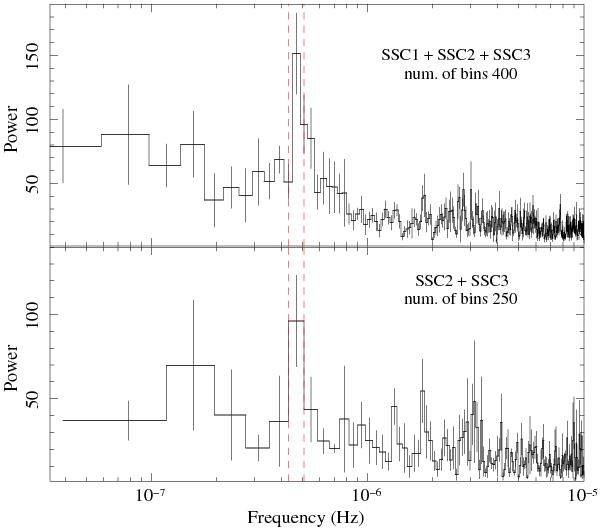
Power spectrum densities of the 1.3–12.1 keV RXTE/ASM light curve, including all the SSCs (top panel) and only SSC2 and SSC3 (bottom panel). We adopted a bin time of 50 ks for both light curves and a number of bins of 400 and 250, respectively. A periodic signal is evident in both light curves and corresponds to a period between 22.78 and 26.92 d, which are indicated with the vertical dashed red lines.
Current usage metrics show cumulative count of Article Views (full-text article views including HTML views, PDF and ePub downloads, according to the available data) and Abstracts Views on Vision4Press platform.
Data correspond to usage on the plateform after 2015. The current usage metrics is available 48-96 hours after online publication and is updated daily on week days.
Initial download of the metrics may take a while.