Fig. 15
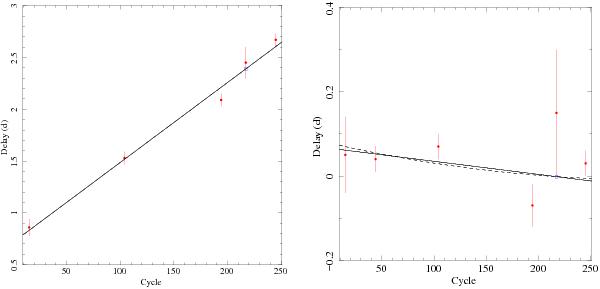
Delays in units of days of the dip arrival times plotted versus the corresponding cycle number; the Chandra point is indicated with a blue open square. Left panel: trial period of 24.52 d and epoch 50 086 MJD; the solid line represents the linear ephemeris shown in Eq. (1). Right panel: trial period of 24.5277 d and epoch 50 086.72 MJD. The solid line and the dashed curve indicate the linear ephemeris shown in Eq. (2) and the quadratic ephemeris of Eq. (3), respectively.
Current usage metrics show cumulative count of Article Views (full-text article views including HTML views, PDF and ePub downloads, according to the available data) and Abstracts Views on Vision4Press platform.
Data correspond to usage on the plateform after 2015. The current usage metrics is available 48-96 hours after online publication and is updated daily on week days.
Initial download of the metrics may take a while.