Fig. 2
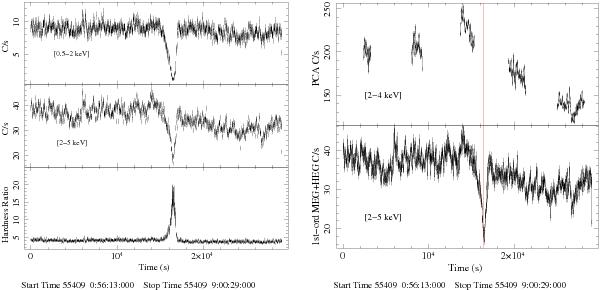
Left panel: Chandra light curve of GX 13+1 between 55 409.03 and 55 409.37 MJD. Summed first-order MEG and HEG light curves in the 0.5–2 keV energy band (top), in the 2–5 keV energy band (middle), and the corresponding hardness ratio (bottom) are shown. The bin time is 32 s. Right panel: background subtracted RXTE/PCA light curve of GX 13+1 in the 2–4 keV energy band (top) and Chandra light curve of GX 13+1 in the 2–5 keV energy band (bottom). The solid vertical line indicates the estimated dip arrival time. The bin time is 32 s.
Current usage metrics show cumulative count of Article Views (full-text article views including HTML views, PDF and ePub downloads, according to the available data) and Abstracts Views on Vision4Press platform.
Data correspond to usage on the plateform after 2015. The current usage metrics is available 48-96 hours after online publication and is updated daily on week days.
Initial download of the metrics may take a while.