Fig. 12
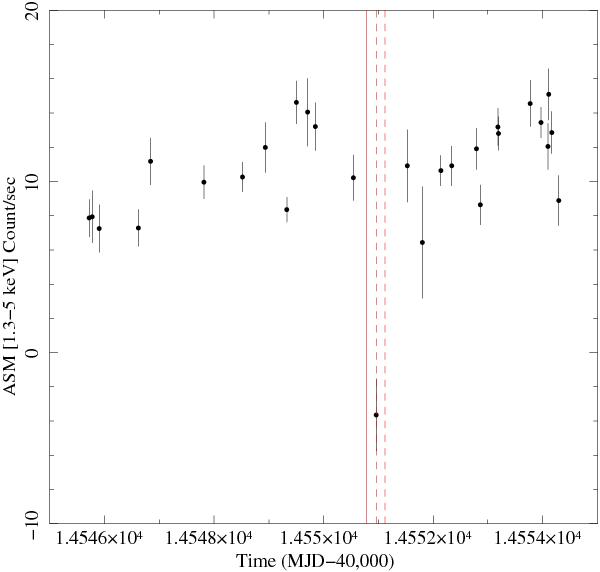
RXTE/ASM light curve of GX 13+1 in the 1.3–5 keV energy band between 54 545 and 54 555 MJD. The bin time is 1000 s. The vertical dotted lines indicate the start and stop times of the RGS observation. The vertical solid line indicates the expected dip arrival time (i.e., 54 550.78 MJD), adopting the ephemeris of Eq. (2) (see text).
Current usage metrics show cumulative count of Article Views (full-text article views including HTML views, PDF and ePub downloads, according to the available data) and Abstracts Views on Vision4Press platform.
Data correspond to usage on the plateform after 2015. The current usage metrics is available 48-96 hours after online publication and is updated daily on week days.
Initial download of the metrics may take a while.