Fig. 13
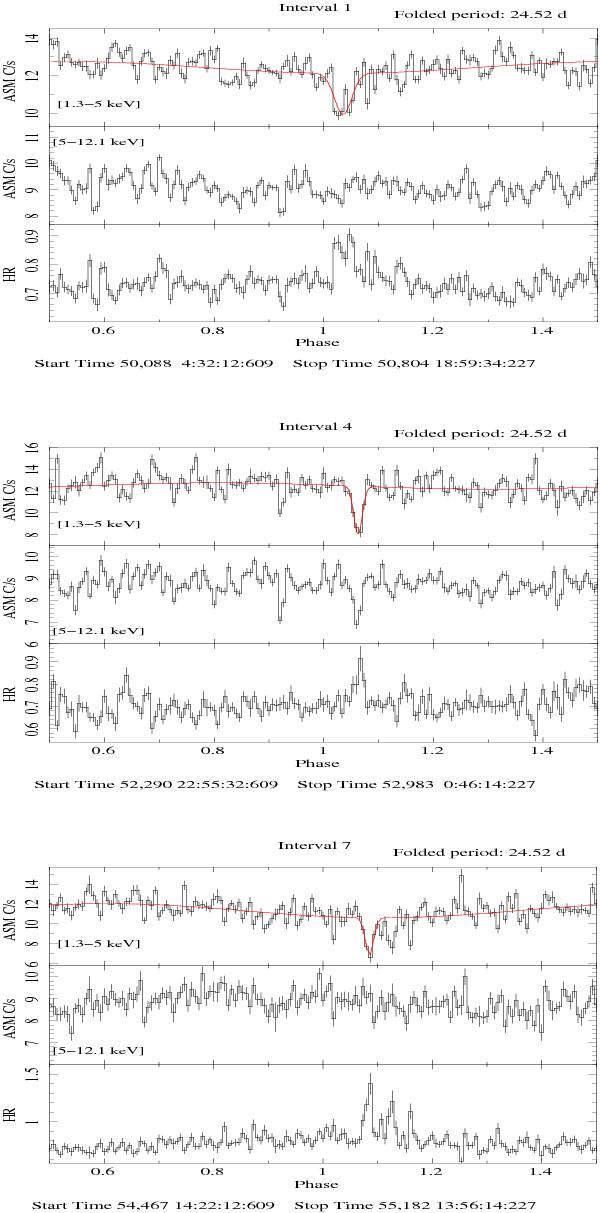
RXTE/ASM folded light curves of GX 13+1 in the 1.3–5 keV (top panels) and 5–12.1 keV energy band (middle panels) covering about 714 days. The corresponding HRs are plotted in the bottom panels. The folding period is 24.52 d and 150 phase-bins per period were adopted. The solid red line is the best-fit curve composed of a constant, plus a sinusoidal function with its period kept fixed to 24.52 d and a Gaussian profile fitting the dip.
Current usage metrics show cumulative count of Article Views (full-text article views including HTML views, PDF and ePub downloads, according to the available data) and Abstracts Views on Vision4Press platform.
Data correspond to usage on the plateform after 2015. The current usage metrics is available 48-96 hours after online publication and is updated daily on week days.
Initial download of the metrics may take a while.