Free Access
Fig. 6
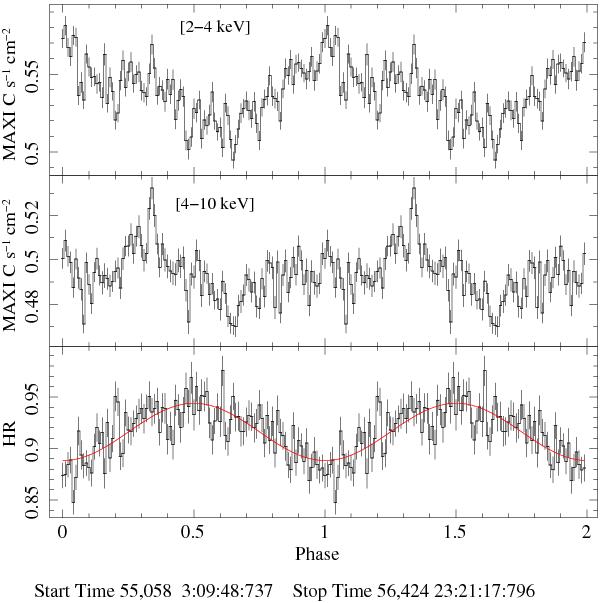
25.6 d folded 2–4 keV and 4–10 keV MAXI light curves (upper and middle panels, respectively). The HR is shown in the bottom panel. We adopted 100 phase-bins per period and epoch 55 044.77 MJD. The HR shows an evident sinusoidal modulation (red curve in bottom panel) at the folded period.
Current usage metrics show cumulative count of Article Views (full-text article views including HTML views, PDF and ePub downloads, according to the available data) and Abstracts Views on Vision4Press platform.
Data correspond to usage on the plateform after 2015. The current usage metrics is available 48-96 hours after online publication and is updated daily on week days.
Initial download of the metrics may take a while.