| Issue |
A&A
Volume 549, January 2013
|
|
|---|---|---|
| Article Number | A122 | |
| Number of page(s) | 22 | |
| Section | Interstellar and circumstellar matter | |
| DOI | https://doi.org/10.1051/0004-6361/201220497 | |
| Published online | 10 January 2013 | |
A double-jet system in the G31.41 + 0.31 hot molecular core⋆
1
INAF – Osservatorio Astrofisico di Arcetri, Largo E. Fermi 5,
50125
Firenze,
Italy
e-mail: This email address is being protected from spambots. You need JavaScript enabled to view it.
; This email address is being protected from spambots. You need JavaScript enabled to view it.
2
Purple Mountain Observatory, Chinese Academy of
Sciences, 210008
Nanjing, PR
China
e-mail: This email address is being protected from spambots. You need JavaScript enabled to view it.
; This email address is being protected from spambots. You need JavaScript enabled to view it.
3
Max-Planck-Institut für Radioastronomie,
Auf dem Hügel 69, 53121
Bonn,
Germany
e-mail: This email address is being protected from spambots. You need JavaScript enabled to view it.
4
Harvard-Smithsonian Center for Astrophysics, 60 Garden
Street, Cambridge,
MA
02138,
USA
e-mail: This email address is being protected from spambots. You need JavaScript enabled to view it.
Received: 4 October 2012
Accepted: 9 November 2012
Abstract
Context. Many aspects of massive star (≳10 M⊙) formation are still unclear. In particular, the outflow properties at close distance (100–1000 AU) from a massive young stellar object (MYSO) are not yet well established.
Aims. This work presents a detailed study of the gas kinematics toward the hot molecular core (HMC) G31.41 + 0.31.
Methods. To study the HMC 3D kinematics at milli-arcsecond angular resolution, we performed multi-epoch VLBI observations of the H2O 22 GHz and CH3OH 6.7 GHz masers, and single-epoch VLBI of the OH 1.6 GHz masers.
Results. Water masers present a symmetric spatial distribution with respect to the HMC center, where two nearby (0".2 apart), compact, VLA sources (labeled “A” and “B”) are previously detected. The spatial distribution of a first group of water masers, named “J1”, is well fit with an elliptical profile, and the maser proper motions mainly diverge from the ellipse center, with average speed of 36 km s-1. These findings strongly suggest that the “J1” water maser group traces the heads of a young (dynamical time of 1.3 × 10³ yr), powerful (momentum rate of ≃0.2 M⊙ yr-1 km s-1), collimated (semi-opening angle ≃10°) jet emerging from a MYSO located close (within ≈0".15) to the VLA source “B”. Most of the water features not belonging to “J1” present an elongated (≈2′′ in size), NE-SW oriented (PA ≈ 70°), S-shape distribution, which we denote with the label “J2”. The elongated distribution of the “J2” group and the direction of motion, approximately parallel to the direction of elongation, of most “J2” water masers suggests the presence of another collimated outflow, emitted from a MYSO placed near the VLA source “A”. The proper motions of the CH3OH 6.7 GHz masers, mostly diverging from the HMC center, also witness the expansion of the HMC gas driven by the “J1” and “J2” jets. The orientation (PA ≈ 70°) of the “J2” jet agrees well with that (PA = 68°) of the well-defined VLSR gradient across the HMC revealed by previous interferometric, thermal line observations. Furthermore, the “J2” jet is powerful enough to sustain the large momentum rate, 0.3 M⊙ yr-1 km s-1, estimated from the interferometric, molecular line data in the assumption that the VLSR gradient represents a collimated outflow. These two facts lead us to favor the interpretation of the VLSR gradient across the G31.41 + 0.31 HMC in terms of a compact and collimated outflow.
Key words: techniques: interferometric / masers / ISM: kinematics and dynamics
Tables 2–5 are available in electronic form at http://www.aanda.org
© ESO, 2013
1. Introduction
Understanding the formation of massive (OB-type) stars involves several theoretical and observational issues. From a theoretical point of view, models of massive star-formation are complicated by the need to consider the effects of the intense stellar radiation of a MYSO, which, by heating, ionizing and exerting pressure on the circumstellar gas, strongly influences the process of mass accretion. For a spherically symmetric infall, the strong radiation pressure may halt and even reverse the accreting flow and thus stop further growth of the stellar mass (Yorke 2002). Recent three-dimensional radiation-hydrodynamic models (Krumholz et al. 2009; Kuiper et al. 2010, 2011; Cunningham et al. 2011) indicate that even the most massive stars can be formed via accretion through a circumstellar disk, since the radiation pressure is decreased by conveying stellar photons along the disk axis and the ram pressure of the accreting gas increased by concentrating the accretion flow through the small disk solid angle. However, magnetohydrodynamic calculations (Seifried et al. 2011) suggest that the formation of a Keplerian disk can be suppressed by strong magnetic fields, since magnetic braking can efficiently remove the excess angular momentum of the accreting gas, lowering the centrifugal support against gravity. Another class of models (“competitive accretion”, Bonnell & Bate 2006), based on the observational evidence that massive stars are mainly found at the center of stellar clusters, predict that massive protostars accrete not only the gas of the surrounding core but also more diffuse gas from the whole molecular clump harboring the cluster. According to this theory, accretion onto the massive protostar is driven by the gravitational potential well which funnels the gas down to the cluster center. In this scenario, circumstellar disks might be transient features prone to fragmentation and dispersion owing to strong interactions with cluster members.
The most advanced simulations of massive star formation model both the accretion and the ejection of mass self-consistently. The calculations by Cunningham et al. (2011) are the first to consider also the feedback effects of protostellar outflows, as well as protostellar radiative heating and radiation pressure on the infalling, dusty gas. Previous works have considered how ionization and strong radiation pressure can affect the mass ejection, suggesting that the resulting increase in the plasma pressure and turbulence could contribute to the decollimation of molecular outflows from massive OB-type protostars (Königl 1999; Yorke & Sonnhalter 2002; Vaidya et al. 2011). Since massive stars very often belong to multiple stellar systems, strong member interactions could in principle influence the outflow properties. In particular the tidal interaction between the disk and a companion star in a non-coplanar orbit has been proposed as a viable mechanism for jet precession (Terquem et al. 1999; Bate et al. 2000).
From an observational point of view, the two main difficulties to face for a study of massive star formation are 1) the relatively large distance (typically several kiloparsec) of the targets and 2) the large extinction at visible and (often) near-infrared wavelengths. The second point precludes direct observation of the (proto)star, whose properties can be inferred only through the study of the radio to mid-infrared radiation from the circumstellar gas reprocessing the stellar photons. The first problem requires angular resolutions ≤0 1 to observe the scales (less than a few hundreds AU) relevant to the study of mass accretion and ejection. Prior to the advent of the Atacama Large Millimeter Array (ALMA), the angular resolution (≥ a few 01) of millimeter interferometers (PdBI, SMA) was in most cases inadequate both to resolve massive accretion disks (with model-predicted sizes of a few hundreds AU) and to identify the protostellar outflow emitted from a “single” MYSO system (hidden in the complex emission pattern resulting from the interaction of the cluster outflows).
The limited angular resolution can explain the failure to detect disks in O-type stars, and the small number of bona-fide detections obtained for B-type stars (Cesaroni et al. 2007). In association with the most luminous MYSOs one finds only huge (≲0.1 pc), massive (a few 100 M⊙) cores, with velocity gradients suggesting rotation. These objects, named “toroids”, are likely non-equilibrium structures, because the ratio between the accretion time scale and the rotation period is much smaller in these toroids than in accretion disks (Cesaroni et al. 2007; Beltrán et al. 2011). The general properties of molecular outflows in massive star-forming regions are presently known mainly through single-dish surveys, with ≳10′′ angular resolution (Beuther et al. 2002; Wu et al. 2005; Zhang et al. 2005; López-Sepulcre et al. 2009), of typical outflow tracers (such as CO and its isotopomer 13CO). These studies have emphasized a good correlation between the momentum rate of the outflow and the MYSO bolometric luminosity. On the other hand, Very Large Array (VLA) sub-arcsecond observations have revealed a few thermal jets (HH 80-81, Marti et al. 1998; IRAS 16547−4247, Rodríguez et al. 2008; IRAS 20126 + 4104, Hofner et al. 2007) associated with intermediate- and high-mass (proto)stars. It is interesting that these (proto)stars, although being of moderate luminosity (104–105 L⊙), eject very powerful, collimated thermal jets and molecular outflows, whose momentum rates (~0.1 M⊙ yr-1 km s-1) are close to the upper limit measured in the single-dish surveys of molecular outflows. These results call for high-angular resolution (≲01) observations of a larger sample of outflows from MYSOs to ascertain if the most compact and youngest flows (not observed in the single-dish surveys) are intrinsically more powerful and collimated. If this were confirmed, the outflow evolution for high-mass (proto)stars would proceed similarly to the low-mass case, where outflows from Class 0 objects are more intense and collimated than for Class I sources (Bontemps et al. 1996).
Since several years, we are conducting a campaign of multi-epoch Very Long Baseline Interferometry (VLBI) observations of the strongest interstellar molecular masers (OH at 1.6 GHz, CH3OH at 6.7 GHz, and H2O at 22 GHz) toward a small sample of massive star-forming regions (Moscadelli et al. 2007, 2011; Sanna et al. 2010a; Goddi et al. 2011; Li et al. 2012). Multi-epoch VLBI observations, achieving angular resolutions of 1–10 mas, permit to measure the proper motions of the maser emission centers, and, knowing the source distance and the maser VLSR (from Doppler effect), one can reconstruct the 3D kinematics of the masing gas. Our results demonstrate the ability of maser emission to trace kinematic structures close to (within tens/hundreds AU from) the MYSO, revealing the presence of fast wide-angle and/or collimated outflows, traced by the H2O masers, and of rotation and infall, indicated by the CH3OH masers. This work reports on our recent VLBI observations of the molecular masers associated with the HMC G31.41 + 0.31, whose gas kinematics has been investigated in the last years using the best available cm and mm interferometers (VLA, SMA, PdBI).
Maser positions, brightnesses, and corresponding synthesized beams.
G31.41 + 0.31 is located at a kinematic distance of 7.9 kpc, and its high bolometric luminosity of 3 × 10⁵ L⊙ (Cesaroni et al. 1994b) hints at the presence of embedded high-mass (proto)stars. The HMC in G31.41 + 0.31 (at a systemic LSR velocity, Vsys = 97.0 km s-1) was originally imaged with the VLA in the high-excitation (4, 4) inversion transition of ammonia by Cesaroni et al. (1994a), and successively mapped by Beltrán et al. (2004) and Cesaroni et al. (2011), using the PdBI and SMA interferometers, respectively, in the (12–11) rotational transitions of methyl cyanide (CH3CN). These latter observations, achieving an angular resolution of 08, reveal a well-defined velocity gradient across the HMC, oriented in the NE-SW direction. Considering the large size (≈0.1 pc) and mass (several 100 M⊙) of this structure, Beltrán et al. (2004) and Cesaroni et al. (2011) interpret the velocity gradient in terms of a toroid in pseudo-Keplerian rotation around a stellar cluster of ≈103 M⊙, tightly packed at the center of the HMC. In contrast to this interpretation, Araya et al. (2008) explain the velocity gradient in terms of a compact outflow on the basis of the NE-SW bipolar morphology of thermal methanol (at 44 GHz), observed with the VLA at an angular resolution of ≈05. In an attempt to decipher the gas kinematics inside the G31.41 + 0.31 HMC, we have observed the OH 1.6 GHz, CH3OH 6.7 GHz, and H2O 22 GHz masers associated with the core, using the VLBI. The observational details are given in Sect. 2, while the results are illustrated in Sect. 3 and discussed in Sects. 4 and 5. The conclusions are drawn in Sect. 6.
2. VLBI maser observations and data reduction
We conducted VLBI observations of the H2O 22 GHz and CH3OH 6.7 GHz masers (at four epochs) and of the OH 1.665/1.667 GHz masers (at a single epoch) toward G31.41 + 0.31. Table 1 lists observing epochs and beams, and reports the derived maser positions. To determine the maser absolute positions, we performed phase-referencing observations in fast switching mode between the maser source and the calibrator J1834−0301. This calibrator has an angular offset from the maser source of 3 8 and belongs to the list of sources of the International Celestial Reference Frame 2 (ICRF2). Its absolute position is known with a precision better than ±1.0 mas, and its flux measured at S and X bands is 250 and 280 mJy beam-1, respectively. Four fringe finders, J1642 + 3948, J1751 + 0939, J1800 + 3848 and J2253 + 1608, were observed for bandpass, single-band delay, and instrumental phase-offset calibration.
Data were reduced with AIPS following the VLBI spectral line procedures. For a description of the general data calibration and the criteria used to identify individual masing clouds, derive their parameters (position, intensity, flux and size), and measure their (relative and absolute) proper motions, we refer to the recent paper on VLBI observations of H2O and CH3OH masers by Sanna et al. (2010a). For each VLBI epoch, except for the fourth epoch on CH3OH masers (see Sect. 2.3), H2O and CH3OH maser absolute positions have been derived by using two ways, direct phase-referencing and inverse phase-referencing, and the two procedures always gave consistent results. For the weak OH masers, we only use direct phase-referencing to determine their absolute positions, because inverse phase-referencing is hindered by the insufficient number of maser (phase calibration) solutions. The derived absolute proper motions have been corrected for the apparent proper motion due to the Earth’s orbit around the Sun (parallax), the Solar Motion and the differential Galactic Rotation between our LSR and that of the maser source. We have adopted a flat Galaxy rotation curve (R0 = 8.3 ± 0.23 kpc, Θ0 = 239 ± 7 km s-1) (Brunthaler et al. 2011), and the Solar motion ( ,
,  , and
, and  km s-1) by Schönrich et al. (2010), who have recently revised the Hipparcos satellite results. We antecipate that the absolute proper motions of water and methanol masers are dominated by a large systematic effect due to the uncertainties in the source distance and Solar and Galactic motion, and/or by a peculiar velocity of the maser source with respect to its LSR reference system. Being severely affected by this systematic deviation, the absolute proper motions cannot be used to describe the maser kinematics around the MYSO, to which purpose we employ the relative proper motions.
2.1. VLBA: 22.2 GHz H2O masers
We observed G31.41+0.31 (tracking center: RA (J2000) = 18h47m34.35s and Dec (J2000) = −01°12′45.6′′) with the NRAO1 Very Long Baseline Array (VLBA) in the 616−523 H2O transition (rest frequency 22.235079 GHz). The observations (program code: BM286) consisted of 4 epochs: 2008 November 23, 2009 January 18, 2009 March 18, and 2009 May 18. Following Reipurth et al. (1999), to reduce systematic errors owing to correlator atmospheric mismodeling, we observed three “geodetic” blocks, each lasting about 40 min, before the start, in the middle, and after the end of our phase-reference observations. The “geodetic-type” data were taken in left circular polarization with eight 4 MHz bands spanning a bandwidth of 480 MHz. The fast-switching phase-referenced observations consisted of two ≈3 h blocks, during which we recorded the dual circular polarization through a 16 MHz bandwidth centered at VLSR = 96 km s-1. The data were processed with the VLBA FX correlator in Socorro (New Mexico) using an averaging time of 1 s and 1024 spectral channels.
Images were produced with natural weighting, cleaned and restored with the naturally-weighted beam, having a full width at half maximum (FWHM) size of about 1.6 mas × 1.0 mas at a position angle (PA) of 6° (east of north), showing small variations from epoch to epoch (see Table 1). The interferometer instantaneous field of view was limited to ~25. In each observing epoch the on-source integration time was ~2.5 h, resulting in an effective rms noise level on the channel maps (1σ) in the range 6–10 mJy beam-1. The spectral resolution was 0.21 km s-1.
2.2. VLBA: 1.665/7 GHz OH masers
We observed G31.41 + 0.31 (tracking center: RA (J2000) = 18h47m34.3s and Dec (J2000) = −01°12′46.0″) with the VLBA in the “main” lines (rest frequencies of 1.665401 GHz and 1.667359 GHz) of the hyperfine splitting of the  OH level on September 26 2008 (program code: BM286E). During a run of ~8 h, we alternated the observations of either “main” lines, recording the dual circular polarization with one bandwidth of 1 MHz (centered at the maser VLSR of 97.0 km s-1) and three 4 MHz bandwidths. The 4 MHz bandwidths were used to increase the signal to noise ratio (S/N) of the weak L-band signal of the continuum calibrator. The data were processed with the VLBA FX correlator in two correlation passes using 1024 and 128 spectral channels for the 1 MHz and 4 MHz bands, respectively. In each correlator pass, the data averaging time was 2 s.
Images were produced with natural weighting, cleaned and restored with the naturally-weighted beam, having a FWHM size of 19 mas × 11 mas at a PA of −3°, and 24 mas × 15 mas at a PA of 35°, for the 1665 and 1667 MHz masers, respectively. The interferometer instantaneous field of view was limited to 72. The on-source integration time was ~1.2 h, resulting in an effective rms noise level in each velocity channel of ~17 mJy beam-1. The spectral resolution attained across the maser 1 MHz band was 0.18 km s-1.
2.3. EVN: 6.7 GHz CH3OH masers
We observed G31.41 + 0.31 (tracking center: RA (J2000) = 18h47m34.33s and Dec (J2000) = −01°12′47.0′′) with the European VLBI Network2 (EVN) in the 51−60A + CH3OH transition (rest frequency 6.668519 GHz). Data were taken at 4 epochs (program code: EM071) separated by ~1 year: 2009 March 15, 2010 March 11, 2011 March 2, and 2012 February 24. In the first two epochs, the antennae involved in the observations were Cambridge, Jodrell2, Effelsberg, Onsala, Medicina, Noto, Torun, Westerbork and Yebes. Because of technical problems, the Noto antenna could not take part to the observations of the third and fourth epochs. The Knockin antenna replaced the Cambridge antenna in the third epoch, and the Cambridge antenna did not observe the fourth epoch. During a run of ~8 h, we recorded the dual circular polarization through eight adjacent bandwidths of 2 MHz, one of them centered at the maser VLSR of 99.0 km s-1. The eight 2 MHz bandwidths were used to increase the S/N of the weak continuum calibrator. The data were processed with the MKIV correlator at the Joint Institute for VLBI in Europe (JIVE-Dwingeloo, The Netherlands) in two correlation passes, using 1024 and 128 spectral channels to correlate the maser 2 MHz bandwidth and the whole set of eight 2 MHz bandwidths, respectively. In each correlator pass, the data averaging time was 1 s.
In addition to the absence of Cambridge and Noto, the fourth observing epoch was also severely affected by other problems: the Jodrell2 receiver was warm (Tsys ≈ 250 K); Medicina suffered a computer problem, after which the fringe amplitudes were much reduced; because of strong winds, Onsala was stowed half of the observing time. The good data were not sufficient to reliably measure the maser absolute position, which has been merely estimated from a linear fit of the positions of the first three epochs (see Table 1).
Reflecting the changes in the antennae taking part in the observations, the FWHM size of the naturally-weighted beam varied over the four epochs from about 8 mas × 5 mas (PA = −17°) to about 12 mas × 3.5 mas (PA = −37°) (see Table 1). At the first two epochs, the maser images have been cleaned and restored using the naturally-weighted beam. At the third and fourth epoch, to prevent apparent changes in the maser structure owing to the variation of the naturally-weighted beam, we have restored the maser images using a beam, 8.3 mas × 4.8 mas at PA = −17°, average of the naturally-weighted beams of the first and second epochs. The interferometer instantaneous field of view was limited to ~33′′. Using an on-source integration time of ~2.3 h, the effective rms noise level on the channel maps (1σ) varied in the range 5–13 mJy beam-1. The spectral resolution attained across the maser 2 MHz band was 0.09 km s-1.
3. Results
3.1. 22 GHz water masers
The lower panel of Fig. 1 shows absolute positions and LSR velocities of the detected water maser features, whose parameters (derived by fitting a 2D elliptical Gaussian to the maser intensity distribution) are listed in Table 4. Over four epochs, we detected 173 distinct maser features, whose intensity ranges from the detection threshold of ≈50 mJy beam-1 up to ≈100 Jy beam-1, and with VLSR varying from 84 km s-1 to 128 km s-1. Interestingly, the distribution of the water masers is approximately symmetric with respect to the position of the two nearby, compact VLA continuum sources “A” and “B”, observed by Cesaroni et al. (2010) roughly at the center of the G31.41 + 0.31 HMC. At comparable offsets to the north and south of the continuum sources, one observes two similar clusters of water masers (enclosed in the white dotted rectangles in Fig. 1), both clusters having the shape of acute bows, with the bow tip pointing to the north (south) for the northern (southern) cluster. In the following, we will refer to these two maser clusters with the name “J1”, and will denote the northern and southern “J1” clusters with “J1-N” and “J1-S”, respectively. Most of the water features not belonging to “J1” present a NE-SW oriented, S-shape distribution (inside the white dashed polygon of Fig. 1), which consists of a NE-SW extended (≈2′′ in size, PA ≈ 70°) strip of features, and two smaller (≈05 in size), SE-NW oriented lines of masers at the ends of the NE-SW strip. In the following, we refer to this S-shape pattern of maser features as “J2”, and use the names “J2-SW” and “J2-NE” to indicate the water maser clusters at the southwestern and northeastern ends of the “J2” distribution, respectively. We note that while the VLSR of the “J2” masers are relatively close (within ±10 km s-1) to Vsys, “J1” includes the most blue- and red-shifted water features (up to 30 km s-1 away from Vsys).
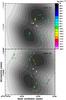 |
Fig. 1 Lower and upper panels show the absolute position and LSR velocity of the 22 GHz water (filled triangles) and 6.7 GHz methanol (dots) maser features, respectively. Colors denote the maser VLSR according to the color–velocity conversion code shown on the right-hand side of the upper panel. Symbol area is proportional to the logarithm of the feature intensity. In both panels, the gray-scale map reproduces the integrated emission of the CH3CN (12-11) K = 4 line (at ≈221 GHz) observed with the SMA (beam ≈0 |
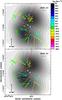 |
Fig. 2 Upper and lower panels show the relative (referred to the “center of motion”) and (methanol-corrected) absolute proper motions of the 22 GHz water masers, respectively. Colored vectors indicate the direction and the amplitude of the proper motions. The black vector in the bottom left corner of the panels indicates the amplitude scale of proper motions in kilometer per second. Dotted vectors are used for the most uncertain proper motions. Colors, symbols, the gray-scale map, the white big dots, the dotted rectangles, and the S-shape dashed polygon, have the same meaning as in Fig. 1. |
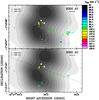 |
Fig. 3 Lower and upper panels show the absolute position and LSR velocity of the 1665 MHz and 1667 MHz OH masers, respectively. For the 1665 MHz masers, the LCP and RCP features are indicated with empty pentagons and stars, respectively. Empty squares and empty triangles indicate the LCP and RCP features of the 1667 MHz masers, respectively. Symbol area is proportional to the logarithm of the feature intensity. The black dashed line in the lower panel shows the axis of projection of the OH maser positions to produce the position-velocity plot of Fig. 6. Colors, the gray-scale map, and the white big dots, have the same meaning as in Fig. 1. |
We calculated the geometric center (hereafter “center of motion”, identified with label #0 in Table 4) of the features with a stable spatial and spectral structure, persisting over the four observing epochs, and refer our measurements of proper motions to this point. The upper panel of Fig. 2 presents the proper motions of the water masers relative to their “center of motion”. The magnitude of the relative proper motions (measured for 70 features and listed in Table 4) ranges from ≈10 km s-1 to ≈120 km s-1, with a mean value of 34.0 km s-1, and a mean error of 7.0 km s-1. The proper motions of the water masers belonging to the “J1-N” and “J1-S” clusters indicate expansion, since most of the proper motion vectors diverge from the HMC center and are oriented approximately perpendicular to the pattern outlined by the water masers. Concerning the velocity distribution of the “J2” water masers, the few measured proper motions for the features found in the NE-SW strip suggest that the masers are receding from the HMC center moving along directions at close angle with the strip orientation. The water features in the “J2-SW” cluster appear to move consistently toward SW, parallel to the strip orientation. In contrast, the proper motions of the “J2-NE” maser features present a more scattered distribution, with the direction of motion rotating from NE to NW with the maser position varying from SE to NW. Finally, we note that the water maser features not belonging to “J1” and “J2” groups, clustered to the SE of the whole maser distribution, present motions to the north.
To check the reliability of the relative, water maser proper motions we follow the same procedure applied in previous studies. Assuming that in G31.41 + 0.31 (as verified in several sources, Moscadelli et al. 2010, 2011; Sanna et al. 2010a,b) methanol masers move (with respect to the star) significantly slower than the water masers, we can use the absolute proper motion of the methanol masers to correct the absolute proper motion of the water masers. The result should be a good approximation of the water maser velocities with respect to the reference system comoving with the star. The lower panel of Fig. 2 shows the absolute water maser proper motions after subtracting the average absolute, methanol maser proper motion (evaluated in Sect. 3.3). Note that, within the errors, the methanol-corrected absolute proper motions of the water masers are consistent with the relative proper motions calculated with respect to the “center of motion” (upper panel of Fig. 2). This result supports our assumption that the “center of motion” can be a suitable reference system to calculate water maser velocities. In the following discussion, we use the relative velocities of the water masers to describe the gas kinematics close to the MYSO.
The methanol-corrected absolute proper motions reported in the lower panel of Fig. 2 should not be confused with the absolute proper motions of the water maser features, derived from the measured absolute proper motion (corrected for the apparent motion) of feature #1 (see Table 1). The absolute proper motions differ from the relative proper motions presented in the upper panel of Fig. 2 by a vector of amplitude ≈60 km s-1 pointing to NE, which seems to be the dominant component of all proper motions and reflect the large systematic deviation affecting the measurement of the absolute proper motions.
3.2. 1.6 GHz hydroxyl masers
The lower and upper panels of Fig. 3 show absolute positions and LSR velocities of the detected 1665 MHz and 1667 MHz OH maser features, respectively, whose parameters are listed in Tables 2 and 3. The number of detected features is significantly higher at 1667 MHz (52) than at 1665 MHz (17), consistent with the fact that the average OH maser intensity is higher at 1667 MHz (0.9 Jy beam-1) than at 1665 MHz (0.7 Jy beam-1). For both OH maser transitions, the detections are similarly distributed between RCP and LCP components, which also show comparable intensities. The overall OH maser VLSR interval extends from 89 km s-1 to 111 km s-1. The 1665 MHz and 1667 MHz OH maser spatial distributions are similar, both extending more along the east-west (3″– ) than along the north-south (≈1′′) direction. In particular, we note that the spatial distribution of both the 1665 MHz and 1667 MHz OH masers is not symmetrical with respect to the two VLA continuum sources found at the center of the HMC. Both maser transitions populate preferentially the region to the west of the VLA sources, spreading more or less uniformly up to a maximum offset of ≈2′′. Instead, to the east of the VLA sources, the observed OH maser features concentrate at relatively small (≤05) offsets and very few features are found at large (≈15) separation from the HMC center. The OH masers present also a regular change in VLSR with the position, with VLSR increasing from west to east. We discuss further the properties of the OH maser spatial and velocity field in Sect. 4.3.
3.3. 6.7 GHz methanol masers
The upper panel of Fig. 1 shows absolute positions and LSR velocities of the detected methanol maser features, whose parameters are listed in Table 5. Over four epochs, we detected 85 distinct maser features, whose intensity ranges from the detection threshold of ≈40 mJy beam-1 up to ≈10 Jy beam-1, and with VLSR varying from 90 km s-1 to 107 km s-1. 6.7 GHz masers distribute at distances ≲1′′ from the two compact VLA continuum sources (at the HMC center), mainly clustering to the SE, SW, and NW of the continuum positions, with no 6.7 GHz features detected to the east of the VLA sources. Comparing the methanol and water maser spatial distributions, we find two clusters of 6.7 GHz features (red- and blue-shifted and placed inside the northern and the southern dotted rectangles of Fig. 1, respectively) which have positions and VLSR similar to 22 GHz features belonging to the north-south oriented, “J1” group. A resemblance in positions and VLSR between the two maser species is also observed to the SW of the VLA continuum sources, where methanol masers are spread nearby the “J2-SW” water maser group. We find, however, also a small cluster of 6.7 GHz features to the NW of the continuum sources (inside a dotted ellipse in Fig. 1), detached from the area of water maser detection. In the following, we will refer to this 6.7 GHz maser cluster with the name “F”.
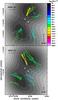 |
Fig. 4 Upper and lower panels show the relative (referred to the “center of motion”) and absolute (corrected for the apparent motion, see Sect. 2) proper motions of the 6.7 GHz methanol masers, respectively. Colored vectors indicate the direction and the amplitude of the proper motions. The black vector in the bottom right corner of the panels indicates the amplitude scale of proper motions in kilometer per second. Dotted vectors are used for the most uncertain proper motions. Colors, symbols, the gray-scale map, the white big dots, the dotted rectangles, the S-shape dashed polygon, and the dotted ellipse, have the same meaning as in Fig. 1. |
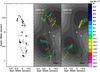 |
Fig. 5 Each of the three panels shows the same area of the sky around the “J1” water maser group. Maser positions are always refered to the VLA source “B” (see text). In each panel, the dashed line shows the best-fit ellipse to the distribution of the “J1” water masers. Left panel: black triangles denote the positions of the “J1” water masers. The dotted lines trace the major (labeled “P-axis”) and minor (“T-axis”) axis of the best-fit ellipse. Black dots give the positions of the VLA sources “A” and “B”. Central and right panels: colored triangles and dots show the positions of the water (central panel) and methanol (right panel) masers, respectively. Symbol area is proportional to the logarithm of the feature intensity. Colors, the gray-scale map, the white big dots have the same meaning as in Fig. 1. Colored vectors indicate the direction and the amplitude of the maser proper motions. The black vector in the bottom right corner of the panels indicates the amplitude scale of proper motions in kilometer per second. Dotted vectors are used for the most uncertain proper motions. |
We calculated the geometric center (hereafter “center of motion”, identified with label #0 in Table 5) of the features with a stable spatial and spectral structure, persisting over the 4 observing epochs, and refer our measurements of proper motions to this point. The upper panel of Fig. 4 presents the proper motions of the methanol masers relative to their “center of motion”. The magnitude of the relative proper motions (measured for 40 features and listed in Table 5) ranges from ≈5 km s-1 to ≈30 km s-1, with a mean value of 13.0 km s-1, and a mean error of 4.0 km s-1. It is interesting to compare the proper motions of the water and methanol masers. The two clusters of 6.7 GHz features in proximity of the “J1” H2O maser structure (inside the dotted rectangles of Fig. 4, upper panel) have proper motions similarly oriented as the nearby water masers, with CH3OH features in correspondence of the northern (southern) “J1” lobe, moving to NW (SE) (see Fig. 5, right panel). The “J1” water masers, however, move on average faster than the adjacent methanol masers. Proper motions of only ≈5 km s-1 (pointing to N-NE) are measured for the group of 6.7 GHz masers offset 01–05 to the west of the the “J1-N” water maser cluster. The methanol masers with positions intermediate between the “J1-S” and the “J2-SW” water maser clusters move preferentially to south, while the motion of the closeby, “J2” water masers is mainly oriented to SW. Finally, we note that the features in the 6.7 GHz maser cluster “F” (inside a dotted ellipse in Fig. 4, upper panel) present proper motions in opposite directions.
The lower panel of Fig. 4 shows the absolute proper motions of the 6.7 GHz CH3OH masers. These differ from the relative proper motions (presented in the upper panel of Fig. 4) by a vector, corresponding to the average absolute proper motion of the 6.7 GHz masers, with components of 29 ± 4 km s-1 along the right-ascension axis and 29 ± 7 km s-1 along the declination. As it is clear from Fig. 4, the dispersion (≈10 km s-1 in each Equatorial coordinate) of the 6.7 GHz maser, absolute proper motions from the mean is small, suggesting, as noted in Sect. 3.1, that a large systematic effect dominates our measurement of absolute proper motions. Since for the 6.7 GHz CH3OH masers, this systematic deviation (with amplitude of ≈41 km s-1) overwhelms the average amplitude (13 km s-1) of the relative proper motions, its value can be adequately estimated as the average of the 6.7 GHz maser, absolute proper motions. As already explained in Sect. 3.1, the absolute proper motions of the 22 GHz H2O masers presented in the lower panel of Fig. 2 have been corrected for this systematic effect.
4. A double-jet system inside the G31.41 + 0.31 HMC
4.1. The “J1” water maser group
In Sect. 3.1, we noted the symmetrical spatial and velocity distributions of the water masers belonging to the “J1-N” and “J1-S” clusters. Figure 5 (left panel) shows that these distributions can be well fit with an ellipse. The fit parameters are: 1) the position on the sky of the ellipse center; 2) the major and minor axes; 3) the PA (east from north) of the major axis. The best-fit position of the ellipse center is determined to be 014 ± 003 south (PA = 177° ± 5°) of the VLA source “B” (i.e. the NE source; see Fig. 1), which is closer to the “J1” center than the VLA source “A”. The best-fit major and minor axes are 144 ± 01 and 024 ± 002, respectively, with PA = 8° ± 1°.
An elliptical spatial distribution is expected if the masers traced a circular ring inclined with respect to the plane of the sky. However, assuming that the masers also move on the ring plane (as, for instance, in an expanding ring), this scenario is clearly to be ruled out on the basis of the comparison of the fit ellipse eccentricity and the 3D maser velocities. The ratio between the minor and the major axis of the best-fit ellipse to the “J1” maser distribution gives an inclination angle of the plane of the putative maser ring with respect to the plane of the sky of icir = arccos(024/144) ≃ 80°, indicating that the maser circle should be seen close to edge-on. On the other hand, if masers move on the ring plane, the ring inclination angle can be also evaluated by the ratio of maser velocity components projected along the line-of-sight, Vz, and along the ellipse minor axis, VT. Averaging on all the (39) “J1” features with measured proper motions, since in general VT ≫ Vz, the ring inclination angle as determined from the maser velocities is 2° ± 2°, implying that the maser motion should be seen face-on. That contrasts with the elongated maser spatial distribution, and we have to rule out the ring interpretation (with masers moving on the ring plane).
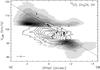 |
Fig. 6 Position-velocity plots of the 12CO(2–1) (gray scale) and CH3CN(12–11) K = 4 line emission obtained with the SMA by Cesaroni et al. (2011). The offset is measured along the direction with PA = 68° passing through the HMC (see Fig. 3) and is measured from the phase center of the SMA observations (α(J2000) = 18h47m34 |

If the H2O masers in “J1” are accelerated by a bipolar jet directed approximately north-south, that could explain the elongated elliptical distribution of the masers and the pattern of proper motions mainly diverging from the ellipse center. The putative location of the MYSO driving this jet likely coincides with the ellipse center. As previously noted, the best-fit position of the ellipse center lies only ≈014 to the south of source “B” (see Fig. 5, left panel). Moreover, based on the cm-wavelength SED analysis, Cesaroni et al. (2010) reason that the source “B” could be a thermal jet rather than a compact H II region. We conclude that source “B” could be excited by the same (proto)stellar jet driving the “J1” water maser motions.
One can estimate the momentum rate of the jet from the average distance of the H2O masers from the MYSO and the average maser velocity. Assuming a H2 pre-shock density nH2 = 108 cm-3, as predicted by excitation models of 22 GHz masers (Elitzur et al. 1989), the momentum rate in the water maser jet is given by the expression:  (1)Here V10 is the average maser velocity in units of 10 km s-1, R100 the average distance of water masers from the YSO in units of 100 AU, and Ω the solid angle of the jet. This expression has been obtained by multiplying the momentum rate per unit surface transferred to the ambient gas (nH2 mH2 V2), by ΩR2, under the assumption that the jet is emitted from a source at a distance R from the masers within a beaming angle Ω. To estimate the average distance and velocity of the water masers tracing the jet, we use all the (39) maser features with measured proper motions belonging to the “J1” group. The resulting average distance is 047 (or ≈3700 AU) and the average speed is 36 km s-1. Using these values, the jet momentum rate is Ṗ ≃ 27 (Ω/4π) M⊙ yr-1 km s-1.
The ratio between the minor and the major axis of the best-fit ellipse can be used to estimate the jet semi-opening angle θj ≃ 10°, which, assuming that the jet is symmetric about its axis, corresponds to a jet solid angle Ω ≃ 0.1 sterad. Using such a value for Ω, the jet momentum rate results Ṗ ≃ 0.2 M⊙ yr-1 km s-1.
Figures 1 and 2 show that, in both the “J1-N” and “J1-S” clusters, most of the water maser features are found projected close to the peaks of the bulk CH3CN (12-11) line emission. A possible interpretation is that the H2O masers are excited at the interface between the jet and the surrounding dense molecular core. The profile outlined by the water masers in the “J1-N” and “J1-S” clusters reminds that of the bow-shocks associated with Herbig-Haro objects (Hartigan et al. 2011), produced by protostellar jets when they impinge against the dense circumstellar material. This scenario suggests that the “J1” jet is still confined inside a dense cocoon of dust and gas within a distance ≤1′′ from the MYSO, which is further indicated by the fact that, despite our sensitive observations, we have failed to reveal a molecular outflow along the “J1” (north-south) direction up to angular scales of several 10′′ (Cesaroni et al. 2011). Using the average value of ≈20 km s-1 for the jet-parallel component of maser velocities, and the jet major semi-axis of 07, one derives a short dynamical time scale of 1.3 × 10³ yr.
4.2. The “J2” water maser group
Looking at the “J2” water maser distribution (see Figs. 1 and 2), the NE-SW elongated strip of water masers and the motion of the water features in the “J2-SW” cluster, parallel to the strip orientation, suggests the presence of another collimated outflow, at PA ≈ 70°. We speculate that the water masers in the strip mark an ionized jet, amplifying the free-free continuum on the background: in this view the emission from source “A”, which lies along the maser strip (see Fig. 1), could be tracing the jet close to the MYSO. However, the proposed scenario cannot readily account for the direction of motion of water masers in the “J2-NE” group, where several maser features move to the north rather than parallel to the direction (PA ≈ 70°) of the putative jet. Note also that to the south (offset by ≈1′′) of the “J2-NE” cluster, another cluster of water maser features (inside the dashed circle in Fig. 7, lower panel) with proper motions directed close to north is found. The motion of these features do not seem to be consistent with the jet interpretation for the “J2” masers. Section 5.2 propones a qualitative explanation of the more scattered velocity distribution for the masers to the east of the VLA source “A”, considering the dynamical interaction of the HMC gas with its environment. In the following we discuss the scenario that the “J2” masers trace a jet.
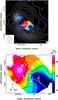 |
Fig. 7 The G31.41 + 0.31 HMC (lower panel) and its environment (upper panel). Upper panel: the blue-tone image reproduces the VLA B-Array 1.3 cm continuum observed by Cesaroni et al. (1998), with blue hue varying logarithmically from a minimum level of 2 mJy beam-1 to a maximum of 7 mJy beam-1. The white contour plot gives the VLA combined C- & D-Array, 1.3 cm continuum from Cesaroni et al. (1994a): plotted contours range from 5 mJy beam-1 to 70 mJy beam-1 by steps of 5 mJy beam-1. The beams of the VLA B-Array and the merged C- & D-Array are shown in the inserts in the bottom right and left corner of the panel, respectively. Lower panel: zoom on the HMC. Overlay of the map of the 1.3 mm continuum emission (contours) on that of the CH3CN(12-11) line velocity (color scale). Contour levels range from 0.1 Jy beam-1 to 2 Jy beam-1 by steps of 0.2 Jy beam-1. The white dots denote the two VLA compact sources detected by Cesaroni et al. (2010). White filled triangles and white vectors give the absolute positions and relative proper motions (with respect to the “center of motion”, see Sect. 3.1) of the 22 GHz water masers. Triangle area is proportional to the logarithm of the maser intensity. The amplitude scale for proper motions is indicated by the black arrow in the bottom left corner of the panel. The S-shape dashed polygon encompasses the “J2” water maser distribution and the dotted circle surrounds the isolated cluster of water masers belonging to neither the “J2” nor the “J1” group. |
Repeating the calculation performed for the “J1” maser group in Sect. 4.1, one can estimate the momentum rate of the “J2” outflow from the average maser distance and velocity. Using the peak of the SMA 1.3 mm continuum (see Fig. 7, lower panel), which, within the measurement error, is coincident with the VLA source “A”, as the best-guess position of the MYSO, and considering only the “J2-SW” water masers, tracing a collimated flow, the average distance and speed are 062 and 38 km s-1, respectively. Taking the water masers of the “J2-NE” group, with more scattered direction of motion, the average distance and speed are 11 and 19 km s-1. In deriving these values, we have averaged over a similar number of persistent maser features, 12 and 13 for the southwestern and northeastern cluster, respectively. For the “J2-NE” maser group, the separation from the MYSO is about twice as great as that of the masers in the “J2-SW” cluster, and the average speed is approximately half as much. Then, using Eq. (1) for the jet momentum rate, the values determined using the southwestern and northeastern maser clusters are in good agreement. That lends support to our argument that the same jet is driving the motion of both “J2” maser lobes. The momentum rate of the “J2” jet is Ṗ ≈ 50 (Ω/4π) M⊙ yr-1 km s-1, where Ω is the solid angle of the jet.
In an attempt to search for outflows emerging from the HMC in G31.41 + 0.31, Cesaroni et al. (2011) have used the SMA to map the emission of the CO(2–1) line with an angular resolution of ≈08. The high-velocity (10 km s-1 ≤ |VLSR − Vsys| ≤ 20 km s-1) 12CO(2–1) emission presents a bipolar structure, with red- and blue-shifted emission peaks offset to the east and the west of the HMC, respectively (see Cesaroni et al. 2011, Fig. 11). The line crossing the two 12CO(2–1) emission peaks forms a small angle (≤20°) with the elongation axis (at PA ≈ 70°) of the “J2” water maser distribution. The separation on the sky of the two emission lobes, ≈5′′, is larger than the extension, ≈2′′, of the “J2” maser group along its major axis. That suggests that the water masers in “J2” trace the root of a collimated outflow which has propagated throughout the HMC accelerating the core gas up to 20 km s-1 (along the line-of-sight) at separations of ~104 AU from the powering MYSO. That the observed bipolar (east-west) distribution of the high-velocity 12CO(2–1) emission could mark a collimated outflow has been also discussed by Cesaroni et al. (2011). Using the CH CN(12–11) lines, which show a well defined VLSR gradient (at PA = 68°) consistent in orientation and amplitude with that seen in 12CO(2–1) and, in addition, being optically thin, permit a reliable estimate of the whole flow mass, these authors derive a value for the outflow momentum rate of Ṗ = 0.3 M⊙ yr-1 km s-1. From the expression quoted above for the momentum rate of the jet driving the “J2” water masers, such a jet would require only a small solid angle Ω ≈ 0.07 sterad (corresponding to a semi-opening angle θj ≈ 9°), to be powerful enough to sustain the molecular flow observed at larger scales.
The momentum rate derived for both the “J1” and “J2” water maser jets is on the order of a few tenths of M⊙ yr-1 km s-1. Single-dish studies with 10′′ angular resolution of molecular outflows in massive star-forming regions indicate that such values of momentum rates are close to the upper limits measured for outflows from MYSOs (López-Sepulcre et al. 2009, and refs. therein). On the other hand, interferometric observations at sub-arcsecond angular resolution have identified a small sample of MYSOs (HH 80-81, Marti et al. 1998; IRAS 16547−4247, Rodríguez et al. 2008; IRAS 20126 + 4104, Moscadelli et al. 2011) which, although being of moderate luminosity (bolometric luminosity in the range 104–105 L⊙), eject very powerful, collimated thermal jets and molecular outflows (momentum rates on the order of 0.1 M⊙ yr-1 km s-1). These results suggest that the most compact and youngest (dynamical time ≤104 yr) outflows in massive star-forming regions (observable only with sub-arcsecond angular resolution) are also among the most powerful and collimated ones observed. Note that the dynamical time scale derived for the “J1” jet using the water masers is only of 1.3 × 10³ yr, and that of the “J2” jet deduced from the (spatial and velocity) separation of the 12CO(2–1) lobes is 4 × 10³ yr (Cesaroni et al. 2011).
4.3. Methanol and OH maser dynamics: jet-driven expansion of the HMC
As noted in Sect. 3.3, from the comparison of the positions and proper motions of the 6.7 GHz methanol (Fig. 4) and 22 GHz water (Fig. 2) masers, one sees that the two clusters of 6.7 GHz masers near the “J1” jet (see Fig. 5, central and right panels) show consistent velocities with the adjacent water masers, despite the lower speeds. The positions and velocities of the 6.7 GHz masers near the “J1” jet suggest that this maser emission also traces gas entrained in the jet. To explain the lower velocities, one could argue that the 6.7 GHz masers would emerge from gas at larger separation from the jet axis than the water masers. Concerning the overall distribution of the 6.7 GHz masers, Fig. 4 (upper panel) evidences that most of them are found within a few tenths of arcsec (or a few 1000 AU) from the “J1” water masers (inside the two dotted rectangles of Fig. 4); in particular, 6.7 GHz masers are also detected at intermediate positions between the “J1-S” and the “J2-SW” clusters (see Fig. 1) The proximity to the jets may indicate that the 6.7 GHz maser excitation could be favored by the outflow activity. One can speculate that the mid-infrared photons, required for pumping the 6.7 GHz masers (Cragg et al. 2002), could more easily penetrate into the dense HMC gas in proximity of the outflows, taking advantage of the cavities induced by the outflowing gas. The proposed association of the 6.7 GHz masers with outflows, based on the similarity of the 3D velocities of the methanol and water masers, agrees with the results by De Buizer (2003) and De Buizer et al. (2009), which find that in most cases the methanol masers are elongated parallel to jets traced by the H2 and SiO emissions, suggesting a physical association of the 6.7 GHz masers with the corresponding outflows.
Looking at the overall distribution of 6.7 GHz maser velocities, Fig. 4 (upper panel) shows that most of the 6.7 GHz maser proper motions are diverging from the HMC center, with minor deviations from the radial direction. We have assumed the HMC center to be the midpoint between the VLA sources “A” and “B”. Altogether, the pattern of 6.7 GHz proper motions marks the expansion (at an average speed of ≈10 km s-1) of the HMC gas close to the “J1” and “J2” jets. Observing the G31.41 + 0.31 HMC with SMA at sub-arcsecond angular resolution, Girart et al. (2009) detected an inverse P-Cygni profile in the spectrum of the C34S (7–6) line, suggesting infall at velocity of a few km s-1 of the core envelope at radii of ≈104 AU. Although the 6.7 GHz masers trace comparable radial distances, in the range 103–104 AU, the pattern of their 3D velocities presents very limited clues to infall. It may be significant that the only inward motions of the 6.7 GHz masers are observed for the two features with the largest distance from the water maser jets (inside the dotted ellipse in Fig. 4, upper panel). If the 6.7 GHz masers are excited mostly in proximity of the “J1” and “J2” jets, their average, outward motion might not be representative of the motion of the HMC bulk gas, since the gas kinematics at large separation from the jets is not adequately sampled.
Figure 3 illustrates that the OH 1.6 GHz masers have an east-west elongated distribution with an enough regular increase of maser VLSR with position varying from west to east. The VLSR gradient traced by the OH masers has a similar orientation as the CH3CN VLSR gradient across the G31.41 + 0.31 HMC revealed by Cesaroni et al. (2011). Figure 6 presents the OH maser VLSR versus the corresponding positions projected along the direction of the CH3CN gradient (PA = 68°). The maser velocities are well correlated with the positions (correlation coefficient = 0.8) with a gradient of 4.7 ± 1.6 km s-1 arcsec-1. Inspecting the position-velocity plot of the 12CO(2–1) line, observed with the SMA by Cesaroni et al. (2011), one notes that a similar (both in orientation and in amplitude) VLSR gradient is traced by the high-velocity wings of the 12CO(2–1) emission (offset in projected position by 4′′–5′′ in correspondence of the maximum VLSR separation of 20–30 km s-1, see Fig. 6). Since, as discussed in Sect. 4.2, the 12CO(2–1) line is likely excited in the collimated, east-west oriented, molecular outflow driven by the “J2” water maser jet, we postulate that the observed OH 1.6 GHz masers originate from the same outflow. The similarity of the VLSR gradient detected in the high-velocity 12CO(2–1) emission wings and in the OH masers can indicate that the OH masers are excited relatively close to the outflow axis (with respect to the transverse size of the outflow), where the HMC gas is pushed by the jet to relatively higher velocities. That could explain why in Fig. 6 the OH maser VLSR are offset from those of the CH3CN, which should trace the velocity of the HMC bulk gas.
It is interesting to note that, whereas the “J1” jet appears to be responsible for the excitation and the motion of most of the 6.7 GHz masers (as discussed above), the OH 1.6 GHz masers seem to be mainly associated with the “J2” jet. These two maser types are both radiatively excited and models predict similar physical excitation conditions (Cragg et al. 2002), except for relatively high gas temperature (≈150 K), and densities (107 cm-3 ≤ nH2 ≤ 108 cm-3), for which OH 1.6 GHz masers are predicted to thermalize. From CH3CN observations, Beltrán et al. (2005) derive a temperature and a density for the HMC gas of ≳100 K and ~107 cm-3, which is close to the predictions of the models for OH 1.6 GHz maser quenching. In Sect. 4.1, on the basis of the size and the shape of the water maser distribution, we have postulated that the “J1” jet has not yet emerged from the MYSO natal cocoon, which could be too dense and warm for efficient pumping of the OH 1.6 GHz masers. On the other hand, the more extended and evolved “J2” jet could have blown the densest portions of the HMC gas away from its axis, reducing the average gas density to nH2 < 107 cm-3, suitable for exciting the OH 1.6 GHz masers. A reduced gas density, however, cannot explain the relatively few 6.7 GHz masers observed toward the “J2” jet, since this maser emission should be strong even at densities ≲107 cm-3. One possibility is that the environments of the “J1” and “J2” jets present chemical differences affecting the abundance rates between CH3OH and OH.
5. Discussion
5.1. “J1” and “J2” jets and the VLSR gradient across the HMC
One of the most notable findings of previous interferometric (PdBI, SMA) observations toward G31.41 + 0.31 is the discovery of a well defined VLSR gradient traced in several transitions of high-density tracers (remarkably CH3CN, see Fig. 7) and also in the 12CO(2–1) line, a typical outflow tracer. The interpretation of this velocity gradient, in terms either of a rotating toroid or a collimated outflow, is still under debate. In the following, we discuss the relevance of the VLBI observations of the water masers to shed light on this issue.
5.1.1. The origin of the “J1” jet
One of the main difficulty to interpret the VLSR gradient in terms of (pseudo-)Keplerian rotation is the absence of a jet oriented perpendicular to the VLSR gradient, as predicted by star-formation models. We have detected however the “J1” water maser distribution, which traces a collimated jet traveling along a direction forming an angle of ≈60° with the gradient orientation. According to the interpretation by Cesaroni et al. (2011), the G31.41 + 0.31 HMC is a massive (several 100 M⊙), large rotating toroid feeding a cluster of MYSOs embedded at the center of the core. One could expect that the accrection disks of these MYSOs are aligned along directions at close angle with the VLSR gradient orientation. Then it is plausible that the “J1” jet, forming an angle of ≈30° with the direction perpendicular to the VLSR gradient, is associated with one of these MYSO. Osorio et al. (2009) have recently reproduced the dust spectrum and the ammonia line emission of the G31.41 + 0.31 HMC with a model of an infalling envelope onto a massive star undergoing an intense accretion phase, deriving a central star mass of 20–25 M⊙ and an age of 3–4 × 10⁴ yr. Note that the modeled protostar age is more than one order of magnitude larger than the dynamical time derived for the “J1” jet of 1.3 × 10³ yr. That would lead us to rule out the hypothesis that the “J1” jet is associated with the accreting protostar, unless our estimate of the “J1” dynamical time is not severely underestimated.
If the “J1” jet is precessing, that would explain both the underestimation of the jet time scale and why the “J1” jet is not oriented perpendicular to the VLSR gradient. In the literature, it exists at least one, well-studied case, the MYSO IRAS 20126+4104, which emits a jet precessing at an angle as large as 45° (Shepherd et al. 2000). The observation of the two VLA compact sources “A” and “B” at the center of the G31.41 + 0.31 HMC might be hinting at a massive binary system, and the tidal interaction between the disk and a companion star in a non-coplanar orbit is one possible mechanism for jet precession (Terquem et al. 1999; Bate et al. 2000). We do not find any hint of a jet along “J1” in the SMA CO maps by Cesaroni et al. (2011). The present data toward G31.41 + 0.31 do not allow to discuss the case for precession in a more quantitative way. Future ALMA observations in thermal continuum and line emissions, achieving an angular resolution 
 , could permit to identify the circumstellar disk around each component of the (putative) binary system, to verify if the disk planes are misaligned with respect to the binary orbit, and to determine the binary separation.
5.1.2. “J2” jet interaction with the HMC
The “J2” water maser distribution (see Figs. 1 and 2) is elongated along a direction (PA ≈ 70°) in good agreement with the orientation (PA = 68°) of the VLSR gradient detected in G31.41 + 0.31 with the SMA in different lines of CH3CN (Cesaroni et al. 2011). When discussing the outflow interpretation for the VLSR gradient, Cesaroni et al. (2011) derive a momentum rate of Ṗ = 0.3 M⊙ yr-1 km s-1 from the optically thin CHCN(12–11) line. This value is consistent with our estimate of Ṗ for the “J2” water maser jet (see Sect. 4.2) for a beaming angle Ω ≈ 0.07 sterad. We thus favor the interpretation of the CH3CN VLSR gradient in terms of a compact and collimated outflow.
Cesaroni et al. (2011) point out two major difficulties for the outflow interpretation of the VLSR gradient. The first one is associated with the too large flow parameters (in particular the momentum rate) if compared with the results of single-dish surveys of massive outflows. As already discussed in Sect. 4.2, high-angular resolution observations of a few, well studied MYSOs suggest that, analogously to what observed in low-mass protostars, the youngest and most compact outflows of massive (proto)stars are also intrinsically more powerful. Thus, the results of single-dish surveys, biased toward more evolved outflows, could systematically underestimate the flow parameters at the earliest evolutionary phases (dynamical time ≤104 yr). The second concern of Cesaroni et al. (2011) is that the flow dynamical time (4 × 10³ yr) would be too short with respect to the time needed to form typical hot core species – such as methyl cyanide – according to some theoretical models (Charnley et al. 1992). The formation route of these models requires that the gas spends at least several 103 yr at temperatures above 100 K, since the process is powered by the evaporation of H2O and other non-refractory species at 100 K, followed by a chain of high-temperature gas-phase reactions to transform simple carbon-bearing molecules into second-generation complex organics. However, these high-temperature models are presently challenged by the grain-surface models, which predict that the organics may be formed abundantly on the grain surfaces through mild photochemistry at 20–40 K (Garrod & Herbst 2006; Garrod 2008). The grain-surface pathway takes several 104 yr at 20–40 K, and such timescales and temperatures are attainable both in the envelope before the material approaches the star and inside the disk (should it be present). Once formed on the grains, these first-generation organics can be returned to the gas phase by thermal evaporation or liberated by non-thermal processes such as shocks in the outflow walls. The whole formation route requires that the material spends only a few 100 yr at high-temperatures, an order of magnitude less than the dynamical time scale of the outflow supposed to be at the origin of the observed VLSR gradient in the G31.41 + 0.31 HMC.
Although the observed water maser kinematics is consistent with the outflow scenario, the maser data themselves are not clear-cut enough to rule out alternative interpretations. In Sect. 4.2, we noted that the water maser velocities to the east of the VLA sources “A” and “B” are not collimated along the axis of the “J2” maser distribution, which might cast some doubts on these masers to belong to a collimated outflow, and on the efficacy of the “J2” flow to produce a well-defined VLSR gradient across the HMC. We postpone the discussion of this problem to Sect. 5.2, where we show how also the anomalous velocities of these features can be explained in the contest of the jet interpretation for the “J2” masers.
5.2. Interaction of the HMC with its environment
In the upper panel of Fig. 7, we compare the velocity map of the HMC obtained from the CH3CN molecule with the free-free continuum emission imaged at 1.3 cm by Cesaroni et al. (1994b, 2010). Two continuum maps are shown: one obtained by merging the C and D configurations of the VLA, the other with the B configuration. Two peaks of emission are seen in the former image, with the one to the SE being located very close to the HMC. In the B-array map only the peak to the NE is still visible: this is very likely tracing the position of the O6 star (2 × 10⁵ L⊙; Cesaroni et al. 2010) responsible for the extended free-free emission seen in Fig. 7, upper panel. The UV photons escaping from the surroundings of the star could also ionize the surface of the HMC, thus causing the second, more shallow peak of free-free continuum observed with the C+D arrays. This scenario strongly suggest that the star ionizing the HII region and the HMC are close in space and not only in projection on the plane of the sky. Further support to this hypothesis is lent by the shape of the millimeter continuum emission, shown in the bottom panel of Fig. 7. Clearly, the contour map looks slightly elongated in the NE-SW direction, with the emission extending toward NE and decreasing more sharply to the SW. Such an asymmetry can be explained with heating of dust on the side of the HMC facing the luminous star ionizing the HII region.
We believe that the proximity between the ionizing star and the HMC, besides explaining the morphology of both the free-free and thermal dust continuum emission, can also justify the directions of proper motions in the “J2-NE” H2O maser group. If the “J2” masers are tracing a bipolar outflow, the NE lobe of this can be strongly affected by the interaction with the stellar photons, possibly enhancing the level of turbulence of the outflowing molecular gas through heating and photoevaporation (Henney et al. 2009). Albeit impossible to quantify on the basis of the available data, the effect of these phenomena on the velocity field of the outflowing gas is likely significant and could explain the anomalous maser proper motions observed.
It is also interesting to note that a significant enhancement of turbulence could also explain why no CH3OH maser and only few OH masers are detected on the NE side of the HMC. These types of masers have measured diameters ≳10 mas, much greater than those of H2O masers (~0.5 mas), which suggests that also the typical amplification paths are larger. Therefore, OH and CH3OH masers are also those most affected by an alteration of the gas velocity field, consistent with the observed lack of emission.
In conclusion, we believe that scattered proper motions of the “J2-NE” cluster of water masers cannot be used to discard the hypothesis that such masers are tracing the NE lobe of a bipolar outflow oriented NE-SW.
6. Conclusions
This work reports on multi-epoch VLBI observations of the H2O 22 GHz and CH3OH 6.7 GHz masers, and single-epoch VLBA of the OH 1.6 GHz masers toward the HMC in G31.41 + 0.31. Distributed over the HMC, we detect 173 H2O, 85 CH3OH, and 69 OH maser features; proper motions are measured for 70 H2O and 40 CH3OH, persistent features. The magnitude of the water maser, relative proper motions ranges from ≈10 km s-1 to ≈120 km s-1, with a mean value of 34.0 km s-1, and a mean error of 7.0 km s-1. The magnitude of the methanol maser, relative proper motions ranges from ≈5 km s-1 to ≈30 km s-1, with a mean value of 13.0 km s-1, and a mean error of 4.0 km s-1.
Water masers present a symmetric spatial distribution with respect to the HMC center, where two nearby (02 apart), compact, VLA sources (named “A” and “B”) are detected by Cesaroni et al. (2010). A first group of water masers, named “J1”, consists of two bow-shape distributions, offset to the north and the south of the VLA sources by ≈05, with the bow tip pointing to the north (south) for the northern (southern) cluster. The “J1” distribution is well fit with an elliptical profile (major and minor axis of 144 ± 01 and 024 ± 002, respectively, with the major axis PA (east from north) = 8° ± 1°), and the maser proper motions mainly diverge from the ellipse center, with average speed of 36 km s-1. These findings strongly suggest that the “J1” water maser group traces the heads of a young (dynamical time of 1.3 × 10³ yr), powerful (momentum rate of ≃0.2 M⊙ yr-1 km s-1), collimated (semi-opening angle ≃10°) jet emerging from a MYSO located close (within ≈015) to the VLA source “B”.
Most of the water features not belonging to “J1” present a NE-SW oriented, S-shape distribution, which consists of an NE-SW extended (≈2′′ in size, PA ≈ 70°) strip of features, and two smaller (≈05 in size), SE-NW oriented lines of masers at the ends of the NE-SW strip. We denote this S-shape, water maser group with “J2”. The few measured proper motions for water masers belonging to the NE-SW elongated strip indicate a motion receding from the two VLA continuum sources (located approximately at the center of the strip), along directions at close angle with the strip orientation. The water features distributed at the southwestern “J2” end move all to the SW, parallel to the strip orientation. Instead, at the northeastern end of the strip, the velocities of the water maser features point in different directions. The elongated distribution of the “J2” group and the direction of motion, approximately parallel to the direction of elongation, of most “J2” water masers suggests that the masers are tracing another collimated outflow, emitted from a MYSO placed near the VLA source “A”. The more scattered distribution of proper motions of the water masers at the “J2” northeastern end could reflect turbulence induced by the heating and photoevaporation of the northeastern side of the HMC, which is facing the O-type star responsible for the H II region observed 5′′ to NE of the HMC.
The orientation (PA ≈ 70°) of the “J2” jet agrees well with that (PA = 68°) of the VLSR gradient across the HMC revealed in several transitions of CH3CN and also in the 12CO(2–1) line by Cesaroni et al. (2011). Besides, the “J2” jet is powerful enough to explain the large momentum rate, 0.3 M⊙ yr-1 km s-1, estimated from CH CN by Cesaroni et al. (2011) under the hypothesis that the VLSR gradient represents a collimated outflow. These two facts lead us to favor the interpretation of the CH3CN VLSR gradient in terms of a compact and collimated outflow. The proper motions of the CH3OH 6.7 GHz masers, mostly diverging from the HMC center, also witness the expansion of the HMC gas driven by the “J1” and “J2” jets.
As already indicated by previous results for other MYSOs, this work on the G31.41 + 0.31 HMC confirms that VLBI maser, 3D kinematics can be relevant for the study of massive star-formation. This technique is presently the only one which enables to resolve the typical sizes (several 100 AU) of massive stellar clusters, and to study in 3D the process of mass accretion and ejection around a single MYSO.
Online material
1665 MHz OH maser parameters.
1667 MHz OH maser parameters.
22 GHz H2O maser parameters.
6.7 GHz CH3OH maser parameters.
The National Radio Astronomy Observatory is operated by Associated Universities, Inc., under cooperative agreement with the National Science Foundation.
The European VLBI Network is a joint facility of European, Chinese and other radio astronomy institutes founded by their national research councils.
Acknowledgments
“J. J. Li were supported by the Chinese National Science Foundation, through grants NSF 11203082, NSF 11133008, NSF 11073054, BK2012494, and the Key Laboratory for Radio Astronomy, CAS. A. Sanna acknowledges the financial support by the European Research Council for the ERC Advanced Grant GLOSTAR under contract No. 247078.”
References
- Araya, E., Hofner, P., Kurtz, S., Olmi, L., & Linz, H. 2008, ApJ, 675, 420 [NASA ADS] [CrossRef] [Google Scholar]
- Bate, M. R., Bonnell, I. A., Clarke, C. J., et al. 2000, MNRAS, 317, 773 [NASA ADS] [CrossRef] [Google Scholar]
- Beltrán, M. T., Cesaroni, R., Neri, R., et al. 2004, ApJ, 601, L187 [NASA ADS] [CrossRef] [Google Scholar]
- Beltrán, M. T., Cesaroni, R., Neri, R., et al. 2005, A&A, 435, 901 [NASA ADS] [CrossRef] [EDP Sciences] [Google Scholar]
- Beltrán, M. T., Cesaroni, R., Neri, R., & Codella, C. 2011, A&A, 525, A151 [NASA ADS] [CrossRef] [EDP Sciences] [Google Scholar]
- Beuther, H., Schilke, P., Sridharan, T. K., et al. 2002, A&A, 383, 892 [NASA ADS] [CrossRef] [EDP Sciences] [Google Scholar]
- Bonnell, I. A., & Bate, M. R. 2006, MNRAS, 370, 488 [NASA ADS] [CrossRef] [Google Scholar]
- Bontemps, S., Andre, P., Terebey, S., & Cabrit, S. 1996, A&A, 311, 858 [NASA ADS] [Google Scholar]
- Brunthaler, A., Reid, M. J., Menten, K. M., et al. 2011, Astron. Nachr., 332, 461 [NASA ADS] [CrossRef] [Google Scholar]
- Cesaroni, R., Churchwell, E., Hofner, P., Walmsley, C. M., & Kurtz, S. 1994a, A&A, 288, 903 [NASA ADS] [Google Scholar]
- Cesaroni, R., Olmi, L., Walmsley, C. M., Churchwell, E., & Hofner, P. 1994b, ApJ, 435, L137 [NASA ADS] [CrossRef] [Google Scholar]
- Cesaroni, R., Hofner, P., Walmsley, C. M., & Churchwell, E. 1998, A&A, 331, 709 [NASA ADS] [Google Scholar]
- Cesaroni, R., Galli, D., Lodato, G., Walmsley, C. M., & Zhang, Q. 2007, Protostars and Planets V, 197 [Google Scholar]
- Cesaroni, R., Hofner, P., Araya, E., & Kurtz, S. 2010, A&A, 509, A50 [NASA ADS] [CrossRef] [EDP Sciences] [Google Scholar]
- Cesaroni, R., Beltrán, M. T., Zhang, Q., Beuther, H., & Fallscheer, C. 2011, A&A, 533, A73 [NASA ADS] [CrossRef] [EDP Sciences] [Google Scholar]
- Charnley, S. B., Tielens, A. G. G. M., & Millar, T. J. 1992, ApJ, 399, L71 [NASA ADS] [CrossRef] [Google Scholar]
- Cragg, D. M., Sobolev, A. M., & Godfrey, P. D. 2002, MNRAS, 331, 521 [NASA ADS] [CrossRef] [Google Scholar]
- Cunningham, A. J., Klein, R. I., Krumholz, M. R., & McKee, C. F. 2011, ApJ, 740, 107 [NASA ADS] [CrossRef] [Google Scholar]
- De Buizer, J. M. 2003, MNRAS, 341, 277 [NASA ADS] [CrossRef] [Google Scholar]
- De Buizer, J. M., Redman, R. O., Longmore, S. N., Caswell, J., & Feldman, P. A. 2009, A&A, 493, 127 [NASA ADS] [CrossRef] [EDP Sciences] [Google Scholar]
- Elitzur, M., Hollenbach, D. J., & McKee, C. F. 1989, ApJ, 346, 983 [NASA ADS] [CrossRef] [Google Scholar]
- Garrod, R. T. 2008, A&A, 491, 239 [NASA ADS] [CrossRef] [EDP Sciences] [Google Scholar]
- Garrod, R. T., & Herbst, E. 2006, A&A, 457, 927 [NASA ADS] [CrossRef] [EDP Sciences] [Google Scholar]
- Girart, J. M., Beltrán, M. T., Zhang, Q., Rao, R., & Estalella, R. 2009, Science, 324, 1408 [NASA ADS] [CrossRef] [PubMed] [Google Scholar]
- Goddi, C., Moscadelli, L., & Sanna, A. 2011, A&A, 535, L8 [NASA ADS] [CrossRef] [EDP Sciences] [Google Scholar]
- Hartigan, P., Frank, A., Foster, J. M., et al. 2011, ApJ, 736, 29 [Google Scholar]
- Henney, W. J., Arthur, S. J., de Colle, F., & Mellema, G. 2009, MNRAS, 398, 157 [NASA ADS] [CrossRef] [Google Scholar]
- Hofner, P., Cesaroni, R., Olmi, L., et al. 2007, A&A, 465, 197 [NASA ADS] [CrossRef] [EDP Sciences] [Google Scholar]
- Königl, A. 1999, New Astron. Rev., 43, 67 [Google Scholar]
- Krumholz, M. R., Klein, R. I., McKee, C. F., Offner, S. S. R., & Cunningham, A. J. 2009, Science, 323, 754 [NASA ADS] [CrossRef] [PubMed] [Google Scholar]
- Kuiper, R., Klahr, H., Beuther, H., & Henning, T. 2010, ApJ, 722, 1556 [CrossRef] [Google Scholar]
- Kuiper, R., Klahr, H., Beuther, H., & Henning, T. 2011, ApJ, 732, 20 [NASA ADS] [CrossRef] [Google Scholar]
- Li, J. J., Moscadelli, L., Cesaroni, R., et al. 2012, ApJ, 749, 47 [NASA ADS] [CrossRef] [Google Scholar]
- López-Sepulcre, A., Codella, C., Cesaroni, R., Marcelino, N., & Walmsley, C. M. 2009, A&A, 499, 811 [NASA ADS] [CrossRef] [EDP Sciences] [Google Scholar]
- Marti, J., Rodriguez, L. F., & Reipurth, B. 1998, ApJ, 502, 337 [NASA ADS] [CrossRef] [Google Scholar]
- Moscadelli, L., Goddi, C., Cesaroni, R., Beltrán, M. T., & Furuya, R. S. 2007, A&A, 472, 867 [NASA ADS] [CrossRef] [EDP Sciences] [Google Scholar]
- Moscadelli, L., Xu, Y., & Chen, X. 2010, ApJ, 716, 1356 [NASA ADS] [CrossRef] [Google Scholar]
- Moscadelli, L., Cesaroni, R., Rioja, M. J., Dodson, R., & Reid, M. J. 2011, A&A, 526, A66 [NASA ADS] [CrossRef] [EDP Sciences] [Google Scholar]
- Osorio, M., Anglada, G., Lizano, S., & D’Alessio, P. 2009, ApJ, 694, 29 [NASA ADS] [CrossRef] [Google Scholar]
- Reipurth, B., Rodríguez, L. F., & Chini, R. 1999, AJ, 118, 983 [NASA ADS] [CrossRef] [Google Scholar]
- Rodríguez, L. F., Moran, J. M., Franco-Hernández, R., et al. 2008, AJ, 135, 2370 [NASA ADS] [CrossRef] [Google Scholar]
- Sanna, A., Moscadelli, L., Cesaroni, R., et al. 2010a, A&A, 517, A71 [NASA ADS] [CrossRef] [EDP Sciences] [Google Scholar]
- Sanna, A., Moscadelli, L., Cesaroni, R., et al. 2010b, A&A, 517, A78 [NASA ADS] [CrossRef] [EDP Sciences] [Google Scholar]
- Schönrich, R., Binney, J., & Dehnen, W. 2010, MNRAS, 403, 1829 [NASA ADS] [CrossRef] [Google Scholar]
- Seifried, D., Banerjee, R., Klessen, R. S., Duffin, D., & Pudritz, R. E. 2011, MNRAS, 417, 1054 [NASA ADS] [CrossRef] [Google Scholar]
- Shepherd, D. S., Yu, K. C., Bally, J., & Testi, L. 2000, ApJ, 535, 833 [Google Scholar]
- Terquem, C., Eislöffel, J., Papaloizou, J. C. B., & Nelson, R. P. 1999, ApJ, 512, L131 [NASA ADS] [CrossRef] [EDP Sciences] [Google Scholar]
- Vaidya, B., Fendt, C., Beuther, H., & Porth, O. 2011, ApJ, 742, 56 [NASA ADS] [CrossRef] [Google Scholar]
- Wu, Y., Zhang, Q., Chen, H., et al. 2005, AJ, 129, 330 [NASA ADS] [CrossRef] [Google Scholar]
- Yorke, H. W. 2002, in Hot Star Workshop III: The Earliest Phases of Massive Star Birth, ed. P. Crowther, ASP Conf. Ser., 267, 165 [Google Scholar]
- Yorke, H. W., & Sonnhalter, C. 2002, ApJ, 569, 846 [NASA ADS] [CrossRef] [Google Scholar]
- Zhang, Q., Hunter, T. R., Brand, J., et al. 2005, ApJ, 625, 864 [NASA ADS] [CrossRef] [Google Scholar]
All Tables
All Figures
|
Fig. 1 Lower and upper panels show the absolute position and LSR velocity of the 22 GHz water (filled triangles) and 6.7 GHz methanol (dots) maser features, respectively. Colors denote the maser VLSR according to the color–velocity conversion code shown on the right-hand side of the upper panel. Symbol area is proportional to the logarithm of the feature intensity. In both panels, the gray-scale map reproduces the integrated emission of the CH3CN (12-11) K = 4 line (at ≈221 GHz) observed with the SMA (beam ≈0 |
| In the text | |
|
Fig. 2 Upper and lower panels show the relative (referred to the “center of motion”) and (methanol-corrected) absolute proper motions of the 22 GHz water masers, respectively. Colored vectors indicate the direction and the amplitude of the proper motions. The black vector in the bottom left corner of the panels indicates the amplitude scale of proper motions in kilometer per second. Dotted vectors are used for the most uncertain proper motions. Colors, symbols, the gray-scale map, the white big dots, the dotted rectangles, and the S-shape dashed polygon, have the same meaning as in Fig. 1. |
| In the text | |
|
Fig. 3 Lower and upper panels show the absolute position and LSR velocity of the 1665 MHz and 1667 MHz OH masers, respectively. For the 1665 MHz masers, the LCP and RCP features are indicated with empty pentagons and stars, respectively. Empty squares and empty triangles indicate the LCP and RCP features of the 1667 MHz masers, respectively. Symbol area is proportional to the logarithm of the feature intensity. The black dashed line in the lower panel shows the axis of projection of the OH maser positions to produce the position-velocity plot of Fig. 6. Colors, the gray-scale map, and the white big dots, have the same meaning as in Fig. 1. |
| In the text | |
|
Fig. 4 Upper and lower panels show the relative (referred to the “center of motion”) and absolute (corrected for the apparent motion, see Sect. 2) proper motions of the 6.7 GHz methanol masers, respectively. Colored vectors indicate the direction and the amplitude of the proper motions. The black vector in the bottom right corner of the panels indicates the amplitude scale of proper motions in kilometer per second. Dotted vectors are used for the most uncertain proper motions. Colors, symbols, the gray-scale map, the white big dots, the dotted rectangles, the S-shape dashed polygon, and the dotted ellipse, have the same meaning as in Fig. 1. |
| In the text | |
|
Fig. 5 Each of the three panels shows the same area of the sky around the “J1” water maser group. Maser positions are always refered to the VLA source “B” (see text). In each panel, the dashed line shows the best-fit ellipse to the distribution of the “J1” water masers. Left panel: black triangles denote the positions of the “J1” water masers. The dotted lines trace the major (labeled “P-axis”) and minor (“T-axis”) axis of the best-fit ellipse. Black dots give the positions of the VLA sources “A” and “B”. Central and right panels: colored triangles and dots show the positions of the water (central panel) and methanol (right panel) masers, respectively. Symbol area is proportional to the logarithm of the feature intensity. Colors, the gray-scale map, the white big dots have the same meaning as in Fig. 1. Colored vectors indicate the direction and the amplitude of the maser proper motions. The black vector in the bottom right corner of the panels indicates the amplitude scale of proper motions in kilometer per second. Dotted vectors are used for the most uncertain proper motions. |
| In the text | |
|
Fig. 6 Position-velocity plots of the 12CO(2–1) (gray scale) and CH3CN(12–11) K = 4 line emission obtained with the SMA by Cesaroni et al. (2011). The offset is measured along the direction with PA = 68° passing through the HMC (see Fig. 3) and is measured from the phase center of the SMA observations (α(J2000) = 18h47m34 |
| In the text | |
|
Fig. 7 The G31.41 + 0.31 HMC (lower panel) and its environment (upper panel). Upper panel: the blue-tone image reproduces the VLA B-Array 1.3 cm continuum observed by Cesaroni et al. (1998), with blue hue varying logarithmically from a minimum level of 2 mJy beam-1 to a maximum of 7 mJy beam-1. The white contour plot gives the VLA combined C- & D-Array, 1.3 cm continuum from Cesaroni et al. (1994a): plotted contours range from 5 mJy beam-1 to 70 mJy beam-1 by steps of 5 mJy beam-1. The beams of the VLA B-Array and the merged C- & D-Array are shown in the inserts in the bottom right and left corner of the panel, respectively. Lower panel: zoom on the HMC. Overlay of the map of the 1.3 mm continuum emission (contours) on that of the CH3CN(12-11) line velocity (color scale). Contour levels range from 0.1 Jy beam-1 to 2 Jy beam-1 by steps of 0.2 Jy beam-1. The white dots denote the two VLA compact sources detected by Cesaroni et al. (2010). White filled triangles and white vectors give the absolute positions and relative proper motions (with respect to the “center of motion”, see Sect. 3.1) of the 22 GHz water masers. Triangle area is proportional to the logarithm of the maser intensity. The amplitude scale for proper motions is indicated by the black arrow in the bottom left corner of the panel. The S-shape dashed polygon encompasses the “J2” water maser distribution and the dotted circle surrounds the isolated cluster of water masers belonging to neither the “J2” nor the “J1” group. |
| In the text | |
Current usage metrics show cumulative count of Article Views (full-text article views including HTML views, PDF and ePub downloads, according to the available data) and Abstracts Views on Vision4Press platform.
Data correspond to usage on the plateform after 2015. The current usage metrics is available 48-96 hours after online publication and is updated daily on week days.
Initial download of the metrics may take a while.