| Issue |
A&A
Volume 673, May 2023
|
|
|---|---|---|
| Article Number | A60 | |
| Number of page(s) | 12 | |
| Section | Stellar structure and evolution | |
| DOI | https://doi.org/10.1051/0004-6361/202346023 | |
| Published online | 05 May 2023 | |
Nature of continuum emission in the source of the water maser super-flare G25.65+1.04⋆
1
INAF – Osservatorio Astrofisico di Arcetri, Largo E. Fermi 5, 50125 Firenze, Italy
e-mail: This email address is being protected from spambots. You need JavaScript enabled to view it.
2
National Astronomical Observatory of Japan, 2-21-1 Osawa, Mitaka-shi, Tokyo 181-8588, Japan
3
Korea Astronomy and Space Science Institute, 776 Daedeokdaero, Yuseong, Daejeon 34055, Republic of Korea
4
Instituto de Radioastronomía y Astrofísica, Universidad Nacional Autónoma de México, Antig. Carr. a Patzcuaro 8701, Morelia 58089, Mexico
5
Ural Federal University, 51 Lenin Str., 620051 Ekaterinburg, Russia
6
Thüringer Landessternwarte, Sternwarte 5, 07778 Tautenburg, Germany
7
Astro Space Center, P.N. Lebedev Physical Institute of RAS, 84/32 Profsoyuznaya st., Moscow 117997, Russia
Received:
30
January
2023
Accepted:
9
March
2023
Abstract
Context. The G25.65+1.04 source is one of the few known ‘super-flare’ water masers in the Milky Way, but in contrast to other super-flare sources, it remains the least studied. In fact, even the nature of the source driving the water maser is still unclear.
Aims. With this project, we aim to clarify the composition and properties of the G25.65+1.04 region by means of examining the parameters of the continuum sources and establishing their association with masers of different types.
Methods. Our previous VLA (Karl G. Jansky Very Large Array) observation detected four continuum peaks (VLA 1-4), three of which (VLA 1-3) were closely spaced and presented a linear orientation. However, the observation, which used the VLA B configuration, lacked the spatial resolution to resolve individual sources. A higher-resolution (A configuration) VLA observation of the continuum and spectral lines was conducted in 2019 using the L, S, C, and Ku bands.
Results. For the first time, the continuum source VLA 1 – associated with the flaring water maser – is resolved into two components: VLA 1A and 1B. The component VLA 1A and the water maser are found to spatially coincide and are thought to be powered by the same source, a protostar at an early stage of evolution showing active ejection. We argue that VLA 2 pinpoints an actively ejecting high-mass protostar, as it is associated with a 6.7 GHz methanol maser and a magnetised jet traced by a 22 GHz H2O maser. Highly polarised OH maser emission is detected in the vicinity of VLA 1-2, with the brightest OH maser found in VLA 2. The magnetic field, identified from the OH maser emission, ranges from ∼ + 0.4 mG in VLA 1A to ∼ − 8 mG in VLA 2.
Conclusions. The G25.65+1.04 region is found to consist of at least two young stellar objects: VLA 1A and VLA 2. Both sources are found to be at an active accretion and ejection stage of evolution.
Key words: stars: formation / masers / stars: individual: G25.65+1.04
Full Tables 4 and 5 are only available at the CDS via anonymous ftp to cdsarc.cds.unistra.fr (130.79.128.5) or via https://cdsarc.cds.unistra.fr/viz-bin/cat/J/A+A/673/A60
© The Authors 2023
 Open Access article, published by EDP Sciences, under the terms of the Creative Commons Attribution License (https://creativecommons.org/licenses/by/4.0), which permits unrestricted use, distribution, and reproduction in any medium, provided the original work is properly cited.
This article is published in open access under the Subscribe to Open model. This email address is being protected from spambots. You need JavaScript enabled to view it. to support open access publication.
1. Introduction
Cosmic masers are one of the key tracers of massive star formation. Masers not only trace morphological elements and kinematics of protostellar systems (e.g., Moscadelli et al. 2020) but also provide information about the system’s evolutionary status (Ellingsen et al. 2007) and the physical parameters of the environment (e.g., Cragg et al. 2005). Moreover, all this is while the maser emission is able to escape dense protostellar shells (a feat beyond the reach of a young protostar itself), and masers are compact and bright enough for interferometric studies (up to space-ground baselines, e.g., Sobolev et al. 2018).
A particular phenomenon that reveals a detailed picture of a star formation region and the nature of masers themselves is a ‘maser flare’. During such an event, the maser flux density increases significantly compared to its stable state (e.g., Liljeström & Gwinn 2000; Hirota et al. 2014; Sugiyama et al. 2019; Colom et al. 2021 and works of the Maser Monitoring Organisation (M2O1)) and traces a variety of phenomena related to the star formation process.
Maser flares vary in brightness and duration and are associated with different types of masers, depending on the nature of the flaring mechanism. For example, the rarest but most outstanding in the sense of providing information on star formation mechanisms are maser flares associated with accretion bursts in massive stars (e.g., Caratti o Garatti et al. 2017; Hunter et al. 2017; Burns et al. 2020b). During an accretion burst, the luminosity of the central protostar increases, perturbing the entire surrounding region. In the process, different maser species brighten, and new, previously undetected masers are excited (e.g., Breen et al. 2019; Brogan et al. 2019; MacLeod et al. 2019).
Surprisingly, flares caused by such ‘global’ events are not the brightest. On the contrary, much brighter flares can be caused by a localised and compact phenomenon: overlapping of maser cloudlets along the line of sight of the observer. This type of maser flare is thought to be exclusively associated with water masers. Notably, the flux density of the flare can reach 104–105 Jy, with Orion KL being the prototypical example (Shimoikura et al. 2005; Hirota et al. 2011). This ‘eclipse’ of clouds does not obscure the maser emission but instead amplifies it like a magnifying glass, thanks to the increase in the maser path length along the line of sight to the observer (Deguchi & Watson 1989).
For many years Orion KL was the only known case, but recently the M2O has found at least three more (G25.65+0.05 (Bayandina et al. 2019; Burns et al. 2020a), G34.196−0.592, and G81.174−00.100 (M2O publications, in prep.), suggesting that this type of local maser flare is more common than originally thought. However, the sample is still small, and it is not clear if there is anything special (i.e. rare) about the host sources or if the small number of detections results from a lack of observational effort.
One of the maser super-flares2, G25.65+0.05, stands out because it showed multiple flares of increasing flux density with a decreasing time interval between the flares. In the monitoring of Lekht et al. (2018), three flares were detected in 2002, 2010, and 2016 with flux densities increasing from ∼3 kJy for the first flare to ∼46 kJy for the last. But the most powerful flares of water emission were detected in 2017, when the source reached flux densities of ∼70 kJy (Volvach et al. 2017b,a). The source also showed one of the most short-lived bright flares ever detected. Within half a day the flux density of the source changed from ∼20 to 76 kJy and then in about two days faded back to ∼20 kJy (Ashimbaeva et al. 2017).
Notably, the distance to the source is an open issue. No trigonometric parallax observations have been made, and distances estimated by less accurate methods range from 2.7 kpc (Sunada et al. 2007) to 12.5 kpc (Green & McClure-Griffiths 2011). The latter value would make the water maser flare in G25.65+0.05 the brightest ever detected in the Galaxy (BeSSeL Survey3 (Reid et al. 2014)).
The G25.65+0.05 region is not only a host of bright H2O maser flares but also a valuable example of an active star-forming region that has been extensively reported in the literature. The region is perhaps better known as RAFGL 7009S and as Mol 62. The radio continuum emission of the source has been studied multiple times (e.g., Kurtz et al. 1994; Zavagno et al. 2002; Bayandina et al. 2019), but observations have failed to resolve the individual sources constituting the region. It has been established that G25.65+1.05 harbours several protostars, with at least one of them being at the UCHII stage. The VLA observation of the source conducted in response to the H2O maser flare of 2017 (B configuration, project code 17B-408) resolved the cm-continuum emission into four partly blended components, indexed as VLA 1-4 (Bayandina et al. 2019). However, the exact morphology of the region and the nature of the individual components are still to be established.
Initially, the water maser super-flare was suspected to be a sign of an accretion burst in the region since it was accompanied by a rise in the brightness of the 6.7 GHz methanol maser (Sugiyama et al. 2017). However, the flux density of the near-infrared emission at the water maser position was discovered to decrease (Sobolev et al. 2017, 2019; Stecklum 2017), not increase, and the NEOWISE 3.4 and 4.6 μm magnitudes remained constant. Moreover, no apparent change in the spatial distribution of 6.7 GHz methanol masers was found at the post-flare epoch (Bayandina et al. 2019). Neither of these facts support the accretion burst hypothesis.
The source is known to show signs of both infall and outflow. The presence of a 6.7 GHz methanol maser emission and strong ice absorption features was interpreted to be caused by an accretion disc (Zavagno et al. 2002). A bipolar outflow was first detected in the CO (1-0) line by Shepherd & Churchwell (1996). Later works indicated that there is either a single but periodic outflow or multiple outflows from multiple sources (Todd & Ramsay Howat 2006; Sánchez-Monge et al. 2013; Navarete et al. 2015). The systemic velocity of the source is VLSR ∼ +42.2 km s−1 based on ammonia line emission (Molinari et al. 1996).
The VLA observation of Bayandina et al. (2019) revealed a water maser cluster elongated in the east-west direction in the vicinity of VLA 1. The flaring maser spots were found to be extremely compact and to reside in a crowded maser cluster near the apex of a grouping of blue-shifted masers (Bayandina et al. 2019; Burns et al. 2020b). The lateral ‘V’ shape seen on the VLA spot map gave a key to the maser flare interpretation, according to which the masers trace two linear maser ‘sheets’, and from the viewpoint of the observer, they intersect at a position in the skyplane corresponding to the position of the flaring maser. However, the central source driving the water maser was not detected.
With this work, we present new, higher-resolution VLA observations of the continuum and maser emission in G25.65+0.05 in an attempt to clarify the protostellar population of the region and the origin of water maser flares.
2. Observations and data reduction
We observed G25.65+1.04 on August 1, 2019, with the Karl G. Jansky Very Large Array (VLA) in the A configuration (project 19A-423). The observation took two hours, with ∼20 min of integration time at each of the four (L, S, C, and Ku) bands.
Continuum emission was observed in the S band with 64 channels of 2 MHz width, and the L, C, and Ku bands were observed with 128 channels of 1 MHz width. Additionally, OH masers at 1665 and 1667 MHz were observed in the L band (1024 channels of 0.244 kHz each), and the class II methanol maser at 6.7 GHz was observed in the C band (1024 channels of 0.977 kHz each). The source 3C 286 was observed as the flux, delay, and bandpass calibrator. We used two phase calibrator sources: J1851+0035, in the S and L bands, and J1832−1035, in the C and Ku bands. A summary of the observation parameters for the continuum and maser data is presented in Tables 1 and 2.
Observation parameters: Continuum.
Observation parameters: Spectral line.
Data reduction was performed using the Common Astronomy Software Applications4 (CASA; CASA Team 2022). For the initial data calibration, we used the VLA CASA Calibration Pipeline. Calibrated data were imaged with the CASA task ‘tclean’. We used natural weighting for continuum imaging and Briggs weighting for maser imaging. Gaussian fitting of the images was performed with the CASA task ‘imfit’. A multi-component Gaussian fit was performed on the continuum images for flux densities above the 3σ level (see Table 1 for the 1σ-levels) to accurately estimate positions and flux densities of individual sources.
A two-dimensional Gaussian brightness distribution was fit to all maser emission peaks with a flux density above 3σ (Table 2). We note that we present results for ‘maser spots’, that is, maser emission detected in a single velocity channel of a data cube. The maser spectra were obtained with the CASA Spectral Profile Tool by integrating over an area encompassing all the maser spots.
3. Results
3.1. Continuum
Continuum emission was detected in all observed frequency bands (L, S, C, Ku). The continuum images made using the full UV range at each band are presented in Fig. 1, and the parameters of the detected sources are listed in Table 3. Source names follow the convention of Bayandina et al. (2019).
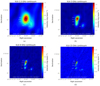 |
Fig. 1. VLA continuum images of G25.65+1.04 at 1.5, 3, 6, and 15 GHz. The contour levels are indicated in each panel. White crosses and labels mark the detected Ku-band continuum peaks from Table 3. The VLA synthesised beam size of each image is shown by the white ellipses in the lower-left corner of the panels. We note that the full UV range was used at each band. |
Parameters of the detected continuum peaks.
The continuum emission is unresolved at the L band and consists of one ∼2 mJy peak covering the positions of VLA 1-3 and a fainter blended peak of ∼0.8 mJy at the position of VLA 4 (Fig. 1a). In the S-band image, the position of VLA 4 is easily distinguishable, while VLA 1-3 are still blended, with VLA 1-2 forming a single peak of ∼2.8 mJy and VLA 3 showing no clear peak (Fig. 1b). In the C-band image, VLA 1-2 remain largely unresolved, whereas VLA 3 and 4 show clear peaks of ∼0.7 and 0.5 mJy, respectively (Fig. 1c). The highest-resolution image (Ku band, Fig. 1d) revealed five continuum peaks. In addition to the peaks from VLA 2-4, VLA 1 was resolved into two peaks: VLA 1A (∼0.6 mJy) and VLA 1B (∼1 mJy). This is the first credible confirmation of VLA 1A and 1B. Our previous lower-resolution Q-band VLA image hinted at the double structure of VLA 1, but the emission was still heavily blended between the two peaks (Bayandina et al. 2019).
When deconvolved from the A-configuration Ku-band beam of ∼0.15″, all detected sources appeared to be point-like. However, the integrated flux density of VLA 1B is about three times higher than its peak flux density (Fig. 1d and Table 3), suggesting that it may be slightly extended. To examine the spatial extent of the continuum sources in more detail, we prepared a Ku-band image using a round restoring beam of 0.109 arcsec (Fig. 2). In this image, VLA 1A and 1B appeared to be slightly extended, while VLA 2-4 appeared unresolved.
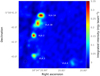 |
Fig. 2. VLA Ku-band continuum image of G25.65+1.04 deconvolved with a round beam. |
Because the continuum emission of VLA 1 and 2 is blended at almost all observed frequencies, evaluation of spectral indices is not possible for these sources. Only VLA 3 and 4 are clearly distinguishable in more than one frequency band (Fig. 1). To estimate the spectral indices of VLA 3 and 4, we prepared C- and Ku-band continuum images with a round beam of 0.4″ for VLA 3. For VLA 4, we used S-, C-, and Ku-band fluxes and a round beam of 0.8″. In both cases, the beam size was determined by the resolution of the lowest frequency image (C band for VLA 3 and S band for VLA 4; see Table 1). To ensure a proper comparison of flux densities, these images were prepared with identical UV ranges: 0.5–943 kλ for VLA 3 (the longest baseline common to the C and Ku bands in which VLA 3 is clearly distinguishable from the other continuum peaks) and 0.25–481 kλ for VLA 4 (the longest baseline common to the S, C, and Ku bands in which the VLA 4 peak is distinguishable). The resulting normalised flux densities are listed in Table 3. In the previous VLA observation of the source, problems were reported with regard to amplitude calibration due to a flare in the flux calibration source (Bayandina et al. 2019). Thus, the integrated flux densities reported in that paper may be overestimated, and we do not include them in our spectral index calculation. A linear least-squares fit to the data points shown in Fig. 3 gives almost the same spectral index of approximately 0.04 for both VLA 3 and VLA 4.
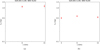 |
Fig. 3. Spectral energy distribution for the continuum sources (a) VLA 3 and (b) VLA 4. The filled circles represent the normalised integrated flux densities with error bars (see Table 3). The presented flux density values were obtained using round beams and UV ranges of 0–943 kλ for VLA 3 and of 0–481 kλ for VLA 4 (for details see the text of Sect. 3.1). |
3.2. Masers
3.2.1. The 6.7 GHz methanol maser
The 6.7 GHz methanol maser emission was detected in the velocity range VLSR ∼ 38–44 km s−1, with a peak of ∼120 Jy at VLSR = 41.82 km s−1 (Fig. 4). Gaussian fits of the 6.7 GHz methanol maser data cube are presented in Table 4. The maser spots’ spatial distribution agrees well with that of previous epochs (Hu et al. 2016; Bayandina et al. 2019). Three clearly distinguishable maser groups were found in the vicinity of VLA 2, with each group separated from the continuum emission by ∼0.2 arcsec. The maser spots with the highest flux densities and broadest velocity range (VLSR = 41.5–43.8 km s−1) were found to the north-west of the continuum peak and show a linear extent in the southeast-northwest direction. The maser spots to the south-east of VLA 2 show a narrower velocity range VLSR = 40–41 km s−1 and have fluxes of ∼2 Jy. Within this group, there seems to be some structure, with higher-velocity spots to the south and lower-velocity spots to the north. Finally, the maser spots to the south of VLA 2 have velocities more distant from the systemic velocity of the source (42.4 km s−1). This group shows the smallest range of velocities (VLSR = 38.3–38.9 km s−1) and the lowest flux densities (∼1.5 Jy). Following Bayandina et al. (2019), we designated the three spatial groups of the maser spots as ‘S’ for the southern group of the maser spots with VLSR ∼ 38–39 km s−1, ‘NE’ for the northeastern group with VLSR ∼ 40–41 km s−1, and ‘NW’ for the northwestern group with VLSR ∼ 41–44 km s−1 (see Table 4 and Fig. 4).
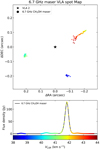 |
Fig. 4. VLA spot map of the 6.7 GHz maser. The spot map is centred on the position of VLA 2 (see Table 3). |
Parameters of the 6.7 GHz CH3OH maser.
3.2.2. The 1665 MHz and 1667 MHz OH masers
The OH maser emission was detected in the velocity range VLSR = ∼36–46 km s−1 at 1665 MHz and VLSR = ∼36–42 km s−1 at 1667 MHz (Fig. 5). Both 1665 and 1667 MHz masers show complex, multi-component spectra. The flux density of the 1665 MHz maser reaches ∼14 Jy (VLSR = 41.6 km s−1), while the strongest 1667 MHz maser is only ∼0.5 Jy, without a clearly dominant component. The OH emission was detected over a region of ∼1.4 arcsec in diameter. The 1667 MHz masers extend over a slightly wider area than the 1665 MHz masers, but this may be a consequence of the larger fitting errors of the low-flux 1667 MHz maser spots (Table 5).
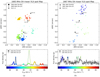 |
Fig. 5. VLA spot maps of the (a) 1665 MHz and (b) 1667 MHz OH maser. The spot map is centred on the position of the brightest OH(1665) maser (see Table 5). |
Parameters of the 1665 and 1667 MHz OH masers.
Polarisation of OH masers can provide information on magnetic field strength, so we analysed the right (RCP) and left circular polarisation (LCP) data separately. The parameters we obtained for the 1665 and 1667 MHz OH maser data fits are presented in Table 5.
The brightest spectral feature at 1665 MHz (VLSR = 41.6 km s−1) shows strong (86%) LCP. In contrast, the other strong lines in the spectrum, which are at VLSR = 37.1, 43.1 and 45.5 km s−1, are almost 100% right polarised. The 1665 MHz masers show a velocity gradient, as maser spots with blue-shifted velocities are found to the south, while spots with red-shifted velocities are to the north. The 1665 maser spots fall into four spatial groups, each one with a different velocity range. The brightest and the most polarised 1665 MHz maser features (RCP at VLSR = 41.6 km s−1 and LCP at VLSR = 37.7 km s−1) arise in the same region ∼0.2 arcsec to the south of VLA 2 (see Fig. 5). The south-west cluster, with velocities VLSR ∼ 40 km s−1, shows about equal RCP and LCP fluxes. To the north are two maser groups: VLSR ∼ 43 (to the east) and ∼45 km s−1 (to the west). The eastern clump is more compact and consists of RCP spots only, while the western group is more extended and hosts RCP and LCP spots of almost equal intensity.
Considering the low flux densities of the 1667 MHz spectral features, we can provide only a rough estimate of their polarisation. The 1667 MHz maser feature at VLSR ∼ 38 km s−1 seems to show strong right circular polarisation, while the feature at VLSR ∼ 40.5 km s−1 is mostly left polarised. The 1667 MHz masers, although spatially separated in velocity, do not show a uniform trend as the 1665 MHz masers do (see Fig. 5). The northern-most 1667 MHz masers have blue-shifted velocities of ∼36 km s−1 and show no significant level of polarisation. We note that no 1665 MHz masers were detected in this northern region. The southern-most group of the OH masers at 1667 MHz with VLSR ∼ 38 km s−1 shows strong right circular polarisation. And the group between them, with VLSR ∼ 40–42 km s−1, is left circularly polarised. Although there are no spectral features detected at the same velocities at both 1665 and 1667 MHz, it is noteworthy that the features with VLSR ∼ 38 km s−1 show dominant RCP emission at both frequencies, and the features with VLSR ∼ 42 km s−1 are both LCP.
4. Discussion
4.1. General comments
To provide an overview of the continuum and maser emission in the G25.65+1.04 region, we collected the results obtained in this work and the 22 GHz H2O maser data from Bayandina et al. (2019) and Burns et al. (2020a) in Fig. 6. The inclusion of the water maser data in the analysis makes it possible to consider maser flares in the context of the region. The water maser data from Burns et al. (2020a) was obtained with the European VLBI Network (EVN) with the synthesised beam 1.2 × 0.7 mas in October 2017 right after the brightest water maser flare of that year (Volvach et al. 2017a,b), while the data from Bayandina et al. (2019) was obtained with the VLA synthesised beam 0.35 × 0.25 arcsec in December 2017 (about two months after the flare).
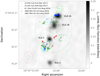 |
Fig. 6. Centimetre continuum sources and masers detected with the VLA (this paper and Bayandina et al. 2019) and EVN (Burns et al. 2020a) in G25.65+1.04. Black, red, and green ellipses show the VLA synthesised beams of the continuum, the 6.7 GHz methanol maser, and the 1665/1667 MHz OH maser data, respectively. We note that the EVN data from Burns et al. (2020a) was obtained with a synthesised beam of 1.2 × 0.7 mas. |
A wider view of the region, including the large-scale outflow (Shepherd & Churchwell 1996; Sánchez-Monge et al. 2013; Todd & Ramsay Howat 2006) and 44 GHz methanol maser data (Bayandina et al. 2019), is shown in Fig. 7. We note that in Fig. 7 we indicate the orientation of the molecular outflows but not their origin or physical extent. Determining the exact source of an outflow was beyond the scope of the works in which these outflows were identified (Shepherd & Churchwell 1996; Todd & Ramsay Howat 2006; Sánchez-Monge et al. 2013). The central source of G25.65+1.04 was assumed to be the single UCHII region reported in Kurtz et al. (1994). According to Shepherd & Churchwell (1996), the outflow traced by 12CO (J = 1–0) shows a well-defined red lobe to the north-west and a blue lobe to the south-east, with a projected length of ∼0.5 pc. The H2 outflow described in (Todd & Ramsay Howat 2006) shows a similar length of ∼70 arcsec (∼0.7 pc at 2.08 pc) and a northeast-southwest orientation between the largest H2 knots (Fig. 7). However, the latest molecular line study of the region revealed almost north-south SiO (2–1), SiO (5–4), and HCO+ (1–0) outflows of about 0.7 pc size using a 3.1 kpc distance to the source (Sánchez-Monge et al. 2013). It is unclear whether the listed outflow tracers track different outflows or different spatial parts and/or evolutionary stages of the same large-scale outflow. Nonetheless, we note that SiO emission is known to be a reliable jet tracer (e.g., Guillet et al. 2009), while CO and HCO mark the low-velocity extended component of outflow (e.g., Cesaroni et al. 1999).
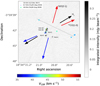 |
Fig. 7. Outflow activity in G25.65+1.04. The 12CO data is from Shepherd & Churchwell (1996), SiO(2-1) data is from Sánchez-Monge et al. (2013), and H2 data is from Todd & Ramsay Howat (2006). Red arrows mark red-shifted outflow lobes, and blue arrows highlight blue-shifted lobes. The arrows indicate the orientation of the outflows but not their extent or origin. |
Additionally, we used our OH data to examine magnetic fields associated with the centimetre continuum peaks. The large VLA beam at the L and, in conjunction with the moderate flux density of the OH maser emission, leads to relatively large positional uncertainties that prohibit a robust identification of Zeeman pairs. Thus, we consider our OH-Zeeman analysis to provide only a rough estimate of the magnetic field strength. We searched the OH data (Table 5) for spatially coincident RCP and LCP maser spots, which are indicative of Zeeman pairs. The maser spots were considered to be a Zeeman pair if their positions matched within the average positional uncertainty of the data (∼0.05 arcsec; see Table 5). The strength of the corresponding magnetic field was calculated assuming the Zeeman splitting coefficients reported by Davies et al. (1974). Because the positional uncertainty of the OH data is relatively large, in the figures below we indicate the average magnetic field strength estimates based on the data of several Zeeman pairs in a particular region. The spectral resolution of the OH data is 0.04 km s−1. Thus, we considered the uncertainty of the magnetic field to be 0.1 mG. Considering all these data, in the next sections we discuss the nature of each centimetre continuum source detected in our VLA observation.
4.2. VLA 1A
Since resolving the continuum emission of G25.65+1.04 into four separate sources (Bayandina et al. 2019), the nature of VLA 1 has attracted the most interest because this source is associated with the extraordinary 22 GHz water maser flare of 2017. In the present VLA A configuration observation, for the first time, we reliably resolved VLA 1 into two sources: VLA 1A and VLA 1B.
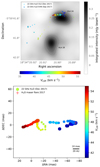 |
Fig. 8. Zoom in on the H2O maser activity in the VLA 1 region. Upper panel: H2O masers detected in the vicinity of VLA 1A and 1B with VLA (Bayandina et al. 2019) and EVN (Burns et al. 2020a). Lower panel: part of the 22 GHz H2O maser emission detected in the vicinity of VLA 1A with VLA (Bayandina et al. 2019). |
As the centimetre continuum emission from VLA 1 was resolved in only one band, we cannot confidently estimate the spectral index of the two components and establish their nature solely based on the continuum data. Thus, we review source models based on the additional data we have collected in this study and from the literature.
The most active site of water maser emission in the region is found in the vicinity of VLA 1A (Bayandina et al. 2019; Burns et al. 2020a). The water masers occupy a ∼0.2 arcsec region and velocity range of 35–55 km s−1 (Fig. 8, upper panel). The brightest H2O maser emission resides north-east from VLA 1A and shows the same east-west extent as the VLA 1A centimetre continuum data deconvolved with a round beam. Water maser emission is also found between VLA 1A and 1B. The extended part of the water maser emission detected with the VLA (Bayandina et al. 2019) is arranged in two northwest-southeast elongated clusters, with VLSR ∼ 41.5 km s−1 (G1 in Bayandina et al. 2019) and ∼47.5 km s−1 (G3 in Bayandina et al. 2019), and located to the east of VLA 1A and 1B. The compact emission detected with the EVN (Burns et al. 2020a) marks the base and the ends of these elongated clusters.
Centimetre radio continuum alongside water masers is often associated with jets; thus, the continuum source VLA 1A may mark a radio jet. The east-west extent of VLA 1A is ∼0.2 arcsec (Fig. 8, upper panel), while the water maser emission comes from a region almost two times smaller, and it may mark the inner, compact base of a jet (Fig. 8, lower panel). The east-west orientation of this presumed jet coincides with the extent of the 44 GHz methanol maser emission (Bayandina et al. 2019), which is usually associated with large-scale outflows (see Fig. 7a). A few weak H2 knots are found in the same direction quite close to the centimetre continuum peaks (Todd & Ramsay Howat 2006; Navarete et al. 2015).
The cluster with velocities of ∼42–54 km s−1 (Fig. 8, lower panel) hosting the flaring 22 GHz water maser is elongated in the east-west direction and consists of three spatial structures showing velocity gradients. The maser spots with red-shifted (VLSR ∼ 51 km s−1) and blue-shifted (VLSR ∼ 44 km s−1) velocities were found to the east and north, respectively, and they form two V-shaped structures. The central part of the emission with VLSR ∼ 49 km s−1 shows a round shape and low flux density. The water maser flare of 2017 was found to originate in the western V-shaped region of the cluster (see red cross in the lower panel of Fig. 8) Bayandina et al. (2019); Burns et al. (2020a). Taking into account the V-shape of the blue- and red-shifted clusters as well as their symmetrical orientation relative to one other, the water maser emission may trace jet-driven bow shocks. Assuming the angular separation between the supposed red and blue lobes of ∼200 AU (∼0.1 arcsec at ∼2.08 kpc), the dynamic age of the jet driving them would be ∼80 yr. Accretion is known to be closely correlated with ejection (e.g., Caratti o Garatti et al. 2015; Cesaroni et al. 2018); thus, the presence of such a young ejection event would indicate that the accretion in VLA 1A is non-steady or episodic.
The possibility that the east-west elongation of the water maser spots with VLSR ∼ 42–54 km s−1 (Fig. 8) trace an accretion disc around a protostar seems unlikely. Considering the spatial extent of the maser emission in the east-west direction of ∼200 AU and its velocity range of ∼12 km s−1 (Fig. 8, lower panel), we estimate the mass of an assumed central source to be ∼30 M⊙.
Notably, only 1667 MHz OH masers were found in the vicinity of VLA 1A, and no OH emission at 1665 MHz was detected. The OH(1667) emission is weak (∼0.5 Jy), has blue-shifted velocities (∼36.5 km s−1), and consists of both left- and right-polarised spots. The OH masers at 1667 MHz are known to be the dominant maser in regions of Tk = 50–75 K and OH densities of 25–60 cm−3, but importantly, they have smaller velocity shifts over the propagation length than the 1665 MHz OH masers (Gray et al. 1992). Consequently, following Gray et al. (1992), OH masers at 1665 and 1667 MHz arise under similar physical conditions, but OH(1667) forms in the absence of a well-defined velocity gradient. In the case of G25.65+1.04, we can assume that the region to the north-west of VLA 1A is the least affected by the large-scale outflow, and the northern OH masers at 1667 MHz arise in more quiescent gas due to the screen offered by the envelope around VLA 1A. In contrast, the most turbulent region is located to the south of VLA 1A where the flow from VLA 2 impacts with the southern portion of the VLA 1A envelope.
Using the OH data, we evaluated the magnetic field associated with VLA 1A (Fig. 9). Two Zeeman pairs located to the south of the VLA 1A peak position yield about the same value of magnetic field strength: ∼+0.35 mG. The results obtained for the remaining pairs identified in the vicinity of VLA 1A are less reliable. The calculated magnetic field changes from ∼+1.2 mG to the north-west of VLA 1A to ∼−0.4 mG to the north-east. In summary, we find that the VLA 1A region shows a weak positive magnetic field.
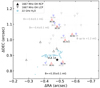 |
Fig. 9. Possible Zeeman pairs of the 1667 MHz OH masers in the vicinity of VLA 1A. The RCP maser spots of a Zeeman pair are marked with, red and LCP pairs are blue. Position errors are marked by crosses (RCP in black; LCP in grey). The average values of the estimated magnetic fields are indicated next to the possible Zeeman pairs. The more robust values, that is, those with close spatial association of a pair and/or multiple pairs that provide the same number, are in black, and less robust values are in grey. |
4.3. VLA 1B
In contrast to VLA 1A, the centimetre continuum of VLA 1B shows a north-south extent (Fig. 2). The elongated and irregular shape of the source suggests a more complex (possibly double) structure that remains unresolved by the VLA beam.
The only maser activity found in the vicinity of VLA 1B is the OH maser emission at 1665 MHz. These maser spots were found to the north of VLA 1B, with a ∼0.3 arcsec (∼600 AU) cluster of red-shifted maser spots (VLSR ∼ 44–46 km s−1; red cluster in Fig. 5a) stretching from VLA 1B to the north and a more compact cluster (∼0.15 arcsec or ∼300 AU) of maser spots with VLSR ∼ 43 km s−1 (yellow cluster in Fig. 5a) about 0.3 arcsec to the north-east of VLA 1B. The emission of the ‘red’ cluster (VLSR ∼ 44–46 km s−1; Fig. 5a) overlaps with the centimetre continuum (Fig. 6), has a low flux density (∼2 Jy), and shows almost equal RCP and LCP fluxes. The ‘yellow’ cluster (VLSR ∼ 43 km s−1; Fig. 5a) is approximately two times brighter (∼4 Jy) and 100% RCP. We note that the apparent compactness of the yellow cluster is at least in part due to its higher flux density. A few weak OH masers at 1667 MHz were found to the south of VLA 1B (Fig. 5b).
The OH(1665) masers in the vicinity of VLA 1B intersect with the G1 and G2 H2O maser groups of VLA 1A (Fig. 6). The G1 H2O maser group (VLSR ∼ 41.5 km s−1) resides to the north-west from the ‘yellow’ OH group (VLSR ∼ 43 km s−1). The string of water maser spots composing G1 connects VLA 1A and the yellow OH group, and it may mark a region of interaction of shock waves with the interstellar medium, while the OH cluster may trace a denser OH-rich region. The G2 H2O maser group (VLSR ∼ 47.5 km s−1) shows spatial and kinematic association with the red OH maser group (VLSR ∼ 44–46 km s−1).
In contrast to VLA 1A, VLA 1B is predominantly associated with 1665 MHz OH emission. According to the model of Gray et al. (1992), dominant OH(1665) maser emission forms in expanding gas characterised by low temperatures (Tk ≤ 75 K) and large velocity shifts. Considering the irregular shape of the centimetre continuum emission of VLA 1B and the presence of shock-excited H2O masers as well as 1665 MHz OH masers (which require a velocity gradient), VLA 1B could trace the interaction of a large-scale outflow from VLA 2 with the dense material around VLA 1A (Fig. 7).
The red OH maser group provides an opportunity to evaluate the magnetic field in the vicinity of VLA 1B. As for VLA 1A, we plotted the maser spots considering their positional uncertainties (Table 5) and velocities (Fig. 10). The assumed Zeeman pairs yielded a positive magnetic field of ∼1 mG with uncertainty of 0.07 mG (corresponding to the spectral resolution of 0.04 km s−1). The magnetic field around VLA 1B appears to be approximately uniform across the OH condensation.
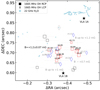 |
Fig. 10. Possible Zeeman pairs of the 1665 MHz OH masers in the vicinity of VLA 1B. The RCP maser spots of a Zeeman pair are marked with red, and LCP spots are in blue. Positional errors are marked by crosses (RCP in black; LCP in grey). The average values of the estimated magnetic fields are indicated next to the possible Zeeman pairs. More robust values, that is, those with close spatial association of a pair and/or multiple pairs that provide the same number, are in black, and less robust values are in grey. |
4.4. VLA 2
In contrast to the previously discussed continuum sources, the Ku-band emission of VLA 2 is compact, point-like, and has a flux density of ∼0.5 mJy. Compared to the other centimetre continuum sources, VLA 2 shows the most maser activity. In the vicinity of VLA 2, 22 GHz water, 6.7 GHz methanol, and 1665/1667 MHz OH masers were detected (Fig. 6).
The three 6.7 GHz methanol maser clusters around VLA 2 (S, NE, and NW; see Table 4 and Fig. 4) were found at almost equal separations, ∼0.2″, from the continuum source (Fig. 4). One possible explanation of this configuration is that the three groups trace a spherical region of maser excitation around the central source of VLA 2.
Previous studies of the source suggested the presence of an accretion disc (e.g., Zavagno et al. 2002), and 6.7 GHz methanol masers are known to be common tracers of discs around massive protostars. Thus, we consider the possibility that the methanol emission arises from a disc structure around VLA 2. We posit that the two northern maser groups (NE and NW; see Table 4) trace an edge-on accretion disc around VLA 2 (Fig. 4). Considering the separation between these two maser groups of ∼400 AU and the velocity gradient of ∼4 km s−1 (Fig. 4), the central source must be ∼7 M⊙. This estimate of the mass of the central protostar is reasonable in view of the maser and outflow activity associated with the source. However, an attempt to fit a Keplerian profile to the 6.7 GHz methanol maser data of the NE and NW groups failed. Although the more red-shifted methanol maser spots are closer to the YSO, suggesting Keplerian rotation, the overall profile is found to be non-Keplerian.
Additionally, taking into account the methanol maser groups NE and NW, the disc model fails to explain the origin of the S maser group. The position of this methanol maser group is perpendicular to the proposed methanol maser disc. Since the accretion disc is proposed to be edge-on, the S group cannot be directly linked to it. On the contrary, the blue-shifted velocities of the group coincide with the blue lobe of the large-scale outflow detected in thermal lines (Sánchez-Monge et al. 2013) (Fig. 7), suggesting a common origin. Moreover, the 6.7 GHz methanol maser was found in the same region as the shock-excited 22 GHz water maser to the south of VLA 2 (Fig. 6). Under this assumption, the southern 6.7 GHz methanol maser is formed not in an accretion disc but rather at the edge of an outflow cavity similar to those described by De Buizer (2006), Sanna et al. (2015).
Water masers were also found to the south-east of VLA 2. The extended component of the water maser emission detected with the VLA in Bayandina et al. (2019) forms a linearly elongated ∼0.2 arcsec stripe of emission, while the compact emission observed with the EVN in Burns et al. (2020a) marks the base and end of the extended emission (Fig. 6). The H2O maser cluster is surrounded by OH maser emission, with an OH(1665) maser cluster to the east of the water maser showing strong LCP, while the OH(1665) maser cluster to the west has RCP. The edges of the OH clusters are in turn marked by the 6.7 GHz maser emission (groups NE and S). Notably, the 22 GHz H2O, OH(1665), and 6.7 GHz methanol masers to the south-east of VLA 2 all have blue-shifted velocities and coincide with the blue lobe of the large-scale outflow (Sánchez-Monge et al. 2013) (Fig. 7). The close association of the H2O and OH masers, in conjunction with the high flux density and polarisation of the OH emission, indicates that the OH maser emission arises in a strongly magnetised environment around an H2O maser jet.
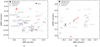 |
Fig. 11. Possible Zeeman pairs in the 1665 MHz OH maser (a) to the north and (b) to the west of VLA 2. The RCP maser spots of a Zeeman pair are marked red and LCP in blue. Position errors are marked by crosses (RCP in black; LCP in grey). The average values of the estimated magnetic fields are indicated next to the possible Zeeman pairs. More robust values, that is, those with close spatial association of a pair and/or a few pairs that provide the same number, are in black, and less robust values are in grey. |
The OH(1665) data were used to characterise the magnetic field in the vicinity of VLA 2. We considered the regions to the south-west (see Fig. 11a) and to the east (Fig. 11b) of VLA 2 separately. The south-west OH region is located between the NE and S groups of 6.7 GHz methanol maser and crossed by the strip of 22 GHz water maser spots. The high flux density of the OH emission (the brightest in G25.65+1.04) allowed us to identify many maser spots with a relatively low positional uncertainty. Consequently, the highest number of possible Zeeman pairs was found here. These Zeeman pairs yield moderately homogeneous results with a strong negative magnetic field. The only Zeeman pair associated with a positive magnetic field was identified to the south of the NE methanol maser group. Notably, only RCP OH maser spots were detected in the plane of the putative 6.7 GHz methanol maser disc. The Zeeman pairs in the vicinity of the 22 GHz water masers show a magnetic field strength as high as −8.5±0.07 mG. This is the strongest magnetic field found in G25.65+1.04. The eastern OH region consists of a smaller number of maser spots with lower flux densities. Thus, the identified Zeeman pairs are less reliable. The magnetic field here seems to be ∼0.5 mG, while its orientation is not clear.
Taking into account all of the above, we consider VLA 2 to be a site of high ejection activity. We propose that all 22 GHz water masers, the NE and S methanol maser groups, and the OH masers southeast of VLA 2 (Fig. 6) are associated with the blue lobe of the jet and/or outflow. But the NW methanol maser group is associated with the red lobe. The 22 GHz water masers seem to trace the red lobe of a magnetised jet surrounded by OH masering gas, while the 6.7 GHz masers are associated with the cavity walls. To verify the proposed model, proper motion measurements of the 6.7 GHz methanol masers are required.
4.5. VLA 3
In contrast to the previously described sources, VLA 3 lacks maser emission at any of the observed frequencies. The source is clearly seen at 6 and 15 GHz (Fig. 1) with an integrated flux density of ∼1 mJy. Based on the two data points we have, the object has a flat spectral index (Fig. 3). We note that in Bayandina et al. (2019), similar values of the integrated flux density of ∼1 mJy were reported at 22 and 45 GHz.
We highlight that VLA 3 is at the southern end of the line formed by the sources VLA 1-3. If we assume VLA 2 to be the source driving the large-scale outflows, VLA 3 may mark a knot in a jet driving the northwest-southeast large-scale outflow. However, our study does not have any additional evidence suitable for verifying the nature of this source.
4.6. VLA 4
The source VLA 4 is located west of VLA 1-3, making it the only continuum source not aligned with the others. The separation between VLA 4 and the other continuum peaks suggests that it may not have any direct physical association with the latter. Of all the sources in the field, VLA 4 has the weakest integrated flux densities (∼0.5 mJy). However, the source is detected at all observed frequencies (Fig. 1), and its isolated position allows us to obtain reliable flux densities without the complication of blending.
Similar to VLA 3, VLA 4 has a flat spectral index (Fig. 3). In Bayandina et al. (2019), the source showed a similar flux of ∼0.5 mJy at 22 GHz but was not detected in the higher-resolution 44 GHz image. The source has a slightly elongated structure in the north-south direction (Fig. 2), but the low signal-to-noise ratio prevents us from drawing any conclusions based on the source morphology.
5. Conclusions
The centimetre continuum in the L, S, C, and Ku bands as well as the 6.7 GHz methanol and 1665/1667 MHz OH masers were observed in G25.65+1.04 with the VLA A configuration. We obtained centimetre continuum images of the source with the highest spatial resolution to date. For the first time, centimetre continuum emission of the source VLA 1 has been resolved into two separate sources: VLA 1A and VLA 1B.
Previously, and based on prior VLA observations, the OH masers were thought to be associated with VLA 3. Our new, higher-resolution VLA observations show that the OH emission is found over a larger area, including the positions of VLA 1-2, with the brightest maser spots detected in the vicinity of VLA 2.
In addition, VLA 1A is found to be associated with the 22 GHz water maser that showed super-flares in 2017. Both the centimetre continuum emission and the water masers show the same east-west elongation. We interpret this elongation of the water masers as a tracer of jet-driven shocks. The dynamic age of the putative jet is estimated to be approximately 80 years. In the vicinity of VLA 1A, an OH maser emission is detected only at 1667 MHz, which indicates the absence of a well-defined velocity gradient (i.e. a lower-velocity environment compared to the OH(1665) regions). Thus, the north-west region from VLA 1A seems to be the least affected by a large-scale outflow from VLA 2 due to the screening provided by VLA 1A’s envelope. The magnetic field, identified through the OH maser emission, is positive and has a strength of ∼+0.4 mG in the vicinity of the VLA 1A continuum peak and water masers.
Regarding VLA 1B, it is primarily associated with OH masers. This OH maser emission shows both RCP and LCP spots around the continuum peak and a highly right-polarised maser cluster to the east. The estimated magnetic field in VLA 1B is ∼+1 mG. Notably, VLA 1B may mark an interaction region between an outflow from VLA 2 and a higher density medium in the vicinity of VLA 1A.
Finally, VLA 2 is associated with 6.7 GHz methanol masers, 22 GHz water masers, and the strongest OH masers. The 6.7 GHz methanol masers are assumed to trace the cavity walls of an outflow driven by VLA 2. The previously reported water masers are interpreted to be associated with a jet surrounded by highly polarised OH emission, which suggests that the jet is magnetised. The magnetic field of ∼ − 8 mG found in the vicinity of the 22 GHz water maser jet in VLA 2 is the strongest in the region.
A global co-operative of maser monitoring programmes, https://masermonitoring.org
We use the term ‘super-flare’ instead of ‘super-burst’ to avoid confusion with accretion bursts.
Acknowledgments
This paper reports data from VLA program 19A-423. The National Radio Astronomy Observatory is a facility of the National Science Foundation operated under cooperative agreement by Associated Universities, Inc. O.B. acknowledges financial support from the Italian Ministry of University and Research - Project Proposal CIR01_00010. The work of AMS was supported by the Ministry of science and higher education of the Russian Federation, agreement FEUZ-2023-0019.
References
- Ashimbaeva, N. T., Platonov, M. A., Rudnitskij, G. M., & Tolmachev, A. M. 2017, ATel, 11042, 1 [NASA ADS] [Google Scholar]
- Bayandina, O. S., Burns, R. A., Kurtz, S. E., Shakhvorostova, N. N., & Val’tts, I. E. 2019, ApJ, 884, 140 [NASA ADS] [CrossRef] [Google Scholar]
- Breen, S. L., Sobolev, A. M., Kaczmarek, J. F., et al. 2019, ApJ, 876, L25 [NASA ADS] [CrossRef] [Google Scholar]
- Brogan, C. L., Hunter, T. R., Towner, A. P. M., et al. 2019, ApJ, 881, L39 [NASA ADS] [CrossRef] [Google Scholar]
- Burns, R. A., Sugiyama, K., Hirota, T., et al. 2020a, Nat. Astron., 4, 506 [Google Scholar]
- Burns, R. A., Orosz, G., Bayandina, O., et al. 2020b, MNRAS, 491, 4069 [NASA ADS] [CrossRef] [Google Scholar]
- Caratti o Garatti, A., Stecklum, B., Linz, H., Garcia Lopez, R., & Sanna, A. 2015, A&A, 573, A82 [NASA ADS] [CrossRef] [EDP Sciences] [Google Scholar]
- Caratti o Garatti, A., Stecklum, B., & Garcia Lopez, R. 2017, Nat. Phys., 13, 276 [CrossRef] [Google Scholar]
- CASA Team (Bean, B., et al.) 2022, PASP, 134, 114501 [NASA ADS] [CrossRef] [Google Scholar]
- Cesaroni, R., Felli, M., Jenness, T., et al. 1999, A&A, 345, 949 [NASA ADS] [Google Scholar]
- Cesaroni, R., Moscadelli, L., Neri, R., et al. 2018, A&A, 612, A103 [NASA ADS] [CrossRef] [EDP Sciences] [Google Scholar]
- Colom, P., Ashimbaeva, N. T., Lekht, E. E., et al. 2021, MNRAS, 507, 3285 [CrossRef] [Google Scholar]
- Cragg, D. M., Sobolev, A. M., & Godfrey, P. D. 2005, MNRAS, 360, 533 [Google Scholar]
- Davies, R. D. 1974, in Galactic Radio Astronomy, eds. F. J. Kerr, & S. C. Simonson, 60, 275 [NASA ADS] [CrossRef] [Google Scholar]
- De Buizer, J. M. 2006, ApJ, 642, L57 [NASA ADS] [CrossRef] [Google Scholar]
- Deguchi, S., & Watson, W. D. 1989, ApJ, 340, L17 [NASA ADS] [CrossRef] [Google Scholar]
- Ellingsen, S. P., Voronkov, M. A., Cragg, D. M., et al. 2007, in Astrophysical Masers and their Environments, eds. J. M. Chapman, & W. A. Baan, 242, 213 [NASA ADS] [Google Scholar]
- Gray, M. D., Field, D., & Doel, R. C. 1992, A&A, 262, 555 [NASA ADS] [Google Scholar]
- Green, J. A., & McClure-Griffiths, N. M. 2011, MNRAS, 417, 2500 [CrossRef] [Google Scholar]
- Guillet, V., Jones, A. P., & Pineau Des Forêts, G. 2009, A&A, 497, 145 [NASA ADS] [CrossRef] [EDP Sciences] [Google Scholar]
- Hirota, T., Tsuboi, M., Fujisawa, K., et al. 2011, ApJ, 739, L59 [NASA ADS] [CrossRef] [Google Scholar]
- Hirota, T., Tsuboi, M., Kurono, Y., et al. 2014, PASJ, 66, 106 [NASA ADS] [CrossRef] [Google Scholar]
- Hu, B., Menten, K. M., Wu, Y., et al. 2016, ApJ, 833, 18 [Google Scholar]
- Hunter, T. R., Brogan, C. L., MacLeod, G., et al. 2017, ApJ, 837, L29 [NASA ADS] [CrossRef] [Google Scholar]
- Kurtz, S., Churchwell, E., & Wood, D. O. S. 1994, ApJS, 91, 659 [Google Scholar]
- Lekht, E. E., Pashchenko, M. I., Rudnitskii, G. M., & Tolmachev, A. M. 2018, Astron. Rep., 62, 213 [NASA ADS] [CrossRef] [Google Scholar]
- Liljeström, T., & Gwinn, C. R. 2000, ApJ, 534, 781 [CrossRef] [Google Scholar]
- MacLeod, G. C., Sugiyama, K., Hunter, T. R., et al. 2019, MNRAS, 489, 3981 [NASA ADS] [CrossRef] [Google Scholar]
- Molinari, S., Brand, J., Cesaroni, R., & Palla, F. 1996, A&A, 308, 573 [NASA ADS] [Google Scholar]
- Moscadelli, L., Sanna, A., Goddi, C., et al. 2020, A&A, 635, A118 [EDP Sciences] [Google Scholar]
- Navarete, F., Damineli, A., Barbosa, C. L., & Blum, R. D. 2015, MNRAS, 450, 4364 [NASA ADS] [CrossRef] [Google Scholar]
- Reid, M. J., Menten, K. M., Brunthaler, A., et al. 2014, ApJ, 783, 130 [Google Scholar]
- Sánchez-Monge, Á., López-Sepulcre, A., Cesaroni, R., et al. 2013, A&A, 557, A94 [NASA ADS] [CrossRef] [EDP Sciences] [Google Scholar]
- Sanna, A., Surcis, G., Moscadelli, L., et al. 2015, A&A, 583, L3 [NASA ADS] [CrossRef] [EDP Sciences] [Google Scholar]
- Shepherd, D. S., & Churchwell, E. 1996, ApJ, 457, 267 [NASA ADS] [CrossRef] [Google Scholar]
- Shimoikura, T., Kobayashi, H., Omodaka, T., et al. 2005, ApJ, 634, 459 [NASA ADS] [CrossRef] [Google Scholar]
- Sobolev, A. M., Bisyarina, A. P., Tatarnikov, A. M., Antokhin, I., & Volvach, A.~E. 2017, ATel, 10788, 1 [NASA ADS] [Google Scholar]
- Sobolev, A. M., Moran, J. M., Gray, M. D., et al. 2018, ApJ, 856, 60 [NASA ADS] [CrossRef] [Google Scholar]
- Sobolev, A. M., Bisyarina, A. P., Gorda, S. Y., & Tatarnikov, A. M. 2019, Res. Astron. Astrophys., 19, 038 [CrossRef] [Google Scholar]
- Stecklum, B., Caratti o Garatti, A., Klose, S., & Wiseman, P. 2017, ATel, 10842, 1 [NASA ADS] [Google Scholar]
- Sugiyama, K., Saito, Y., Akitaya, H., Yonekura, Y., & Momose, M. 2017, ATel, 10757, 1 [NASA ADS] [Google Scholar]
- Sugiyama, K., Saito, Y., Yonekura, Y., & Momose, M. 2019, ATel, 12446, 1 [Google Scholar]
- Sunada, K., Nakazato, T., Ikeda, N., et al. 2007, PASJ, 59, 1185 [NASA ADS] [Google Scholar]
- Todd, S. P., & Ramsay Howat, S. K. 2006, MNRAS, 367, 238 [CrossRef] [Google Scholar]
- Volvach, A. E., Volvach, L. N., MacLeod, G., et al. 2017a, ATel, 10853, 1 [NASA ADS] [Google Scholar]
- Volvach, A. E., Volvach, L. N., MacLeod, G., et al. 2017b, ATel, 10728, 1 [NASA ADS] [Google Scholar]
- Zavagno, A., Deharveng, L., Nadeau, D., & Caplan, J. 2002, A&A, 394, 225 [NASA ADS] [CrossRef] [EDP Sciences] [Google Scholar]
All Tables
All Figures
|
Fig. 1. VLA continuum images of G25.65+1.04 at 1.5, 3, 6, and 15 GHz. The contour levels are indicated in each panel. White crosses and labels mark the detected Ku-band continuum peaks from Table 3. The VLA synthesised beam size of each image is shown by the white ellipses in the lower-left corner of the panels. We note that the full UV range was used at each band. |
| In the text | |
|
Fig. 2. VLA Ku-band continuum image of G25.65+1.04 deconvolved with a round beam. |
| In the text | |
|
Fig. 3. Spectral energy distribution for the continuum sources (a) VLA 3 and (b) VLA 4. The filled circles represent the normalised integrated flux densities with error bars (see Table 3). The presented flux density values were obtained using round beams and UV ranges of 0–943 kλ for VLA 3 and of 0–481 kλ for VLA 4 (for details see the text of Sect. 3.1). |
| In the text | |
|
Fig. 4. VLA spot map of the 6.7 GHz maser. The spot map is centred on the position of VLA 2 (see Table 3). |
| In the text | |
|
Fig. 5. VLA spot maps of the (a) 1665 MHz and (b) 1667 MHz OH maser. The spot map is centred on the position of the brightest OH(1665) maser (see Table 5). |
| In the text | |
|
Fig. 6. Centimetre continuum sources and masers detected with the VLA (this paper and Bayandina et al. 2019) and EVN (Burns et al. 2020a) in G25.65+1.04. Black, red, and green ellipses show the VLA synthesised beams of the continuum, the 6.7 GHz methanol maser, and the 1665/1667 MHz OH maser data, respectively. We note that the EVN data from Burns et al. (2020a) was obtained with a synthesised beam of 1.2 × 0.7 mas. |
| In the text | |
|
Fig. 7. Outflow activity in G25.65+1.04. The 12CO data is from Shepherd & Churchwell (1996), SiO(2-1) data is from Sánchez-Monge et al. (2013), and H2 data is from Todd & Ramsay Howat (2006). Red arrows mark red-shifted outflow lobes, and blue arrows highlight blue-shifted lobes. The arrows indicate the orientation of the outflows but not their extent or origin. |
| In the text | |
|
Fig. 8. Zoom in on the H2O maser activity in the VLA 1 region. Upper panel: H2O masers detected in the vicinity of VLA 1A and 1B with VLA (Bayandina et al. 2019) and EVN (Burns et al. 2020a). Lower panel: part of the 22 GHz H2O maser emission detected in the vicinity of VLA 1A with VLA (Bayandina et al. 2019). |
| In the text | |
|
Fig. 9. Possible Zeeman pairs of the 1667 MHz OH masers in the vicinity of VLA 1A. The RCP maser spots of a Zeeman pair are marked with, red and LCP pairs are blue. Position errors are marked by crosses (RCP in black; LCP in grey). The average values of the estimated magnetic fields are indicated next to the possible Zeeman pairs. The more robust values, that is, those with close spatial association of a pair and/or multiple pairs that provide the same number, are in black, and less robust values are in grey. |
| In the text | |
|
Fig. 10. Possible Zeeman pairs of the 1665 MHz OH masers in the vicinity of VLA 1B. The RCP maser spots of a Zeeman pair are marked with red, and LCP spots are in blue. Positional errors are marked by crosses (RCP in black; LCP in grey). The average values of the estimated magnetic fields are indicated next to the possible Zeeman pairs. More robust values, that is, those with close spatial association of a pair and/or multiple pairs that provide the same number, are in black, and less robust values are in grey. |
| In the text | |
|
Fig. 11. Possible Zeeman pairs in the 1665 MHz OH maser (a) to the north and (b) to the west of VLA 2. The RCP maser spots of a Zeeman pair are marked red and LCP in blue. Position errors are marked by crosses (RCP in black; LCP in grey). The average values of the estimated magnetic fields are indicated next to the possible Zeeman pairs. More robust values, that is, those with close spatial association of a pair and/or a few pairs that provide the same number, are in black, and less robust values are in grey. |
| In the text | |
Current usage metrics show cumulative count of Article Views (full-text article views including HTML views, PDF and ePub downloads, according to the available data) and Abstracts Views on Vision4Press platform.
Data correspond to usage on the plateform after 2015. The current usage metrics is available 48-96 hours after online publication and is updated daily on week days.
Initial download of the metrics may take a while.