Fig. 7.
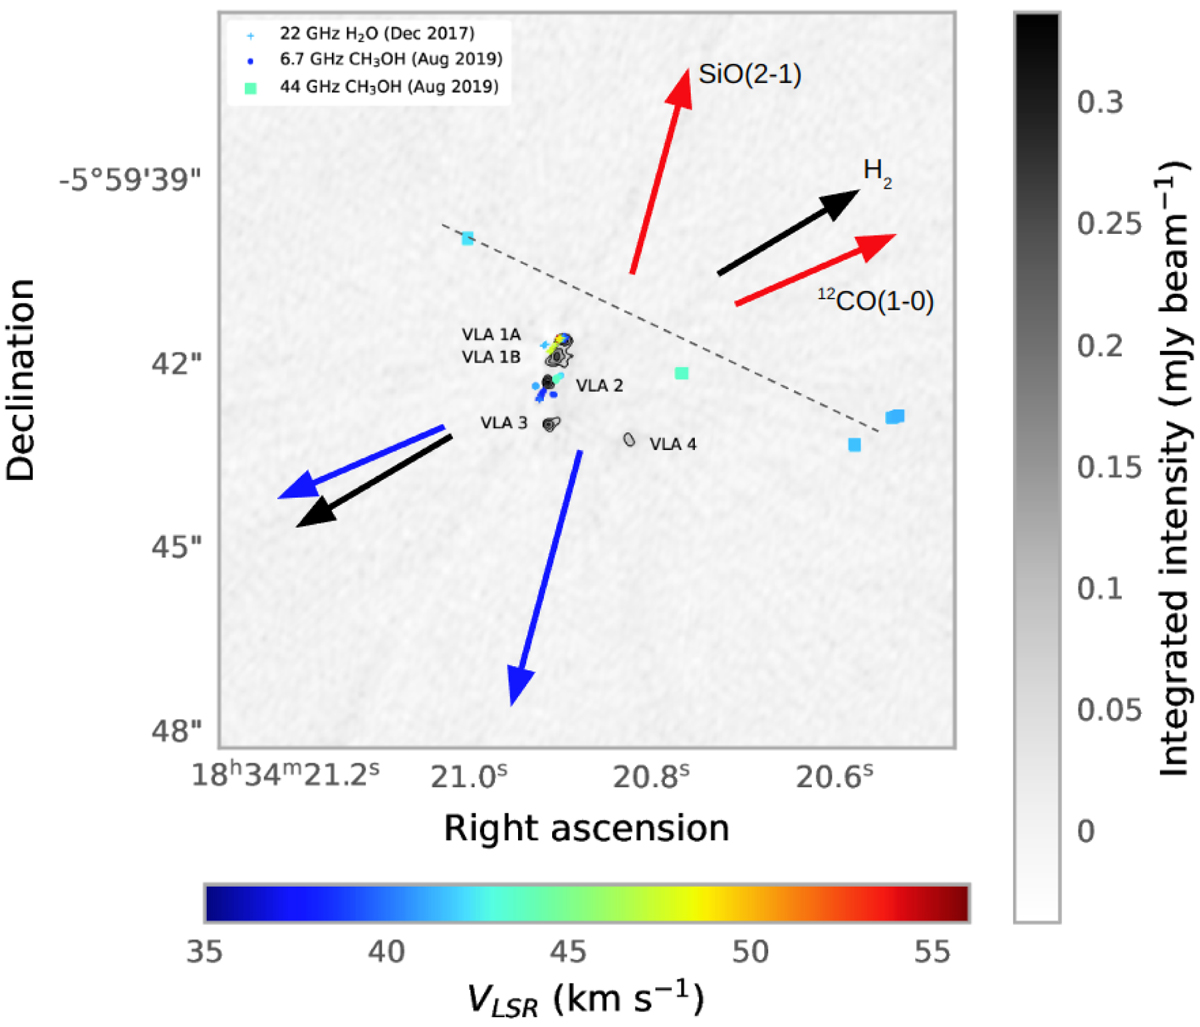
Download original image
Outflow activity in G25.65+1.04. The 12CO data is from Shepherd & Churchwell (1996), SiO(2-1) data is from Sánchez-Monge et al. (2013), and H2 data is from Todd & Ramsay Howat (2006). Red arrows mark red-shifted outflow lobes, and blue arrows highlight blue-shifted lobes. The arrows indicate the orientation of the outflows but not their extent or origin.
Current usage metrics show cumulative count of Article Views (full-text article views including HTML views, PDF and ePub downloads, according to the available data) and Abstracts Views on Vision4Press platform.
Data correspond to usage on the plateform after 2015. The current usage metrics is available 48-96 hours after online publication and is updated daily on week days.
Initial download of the metrics may take a while.