Open Access
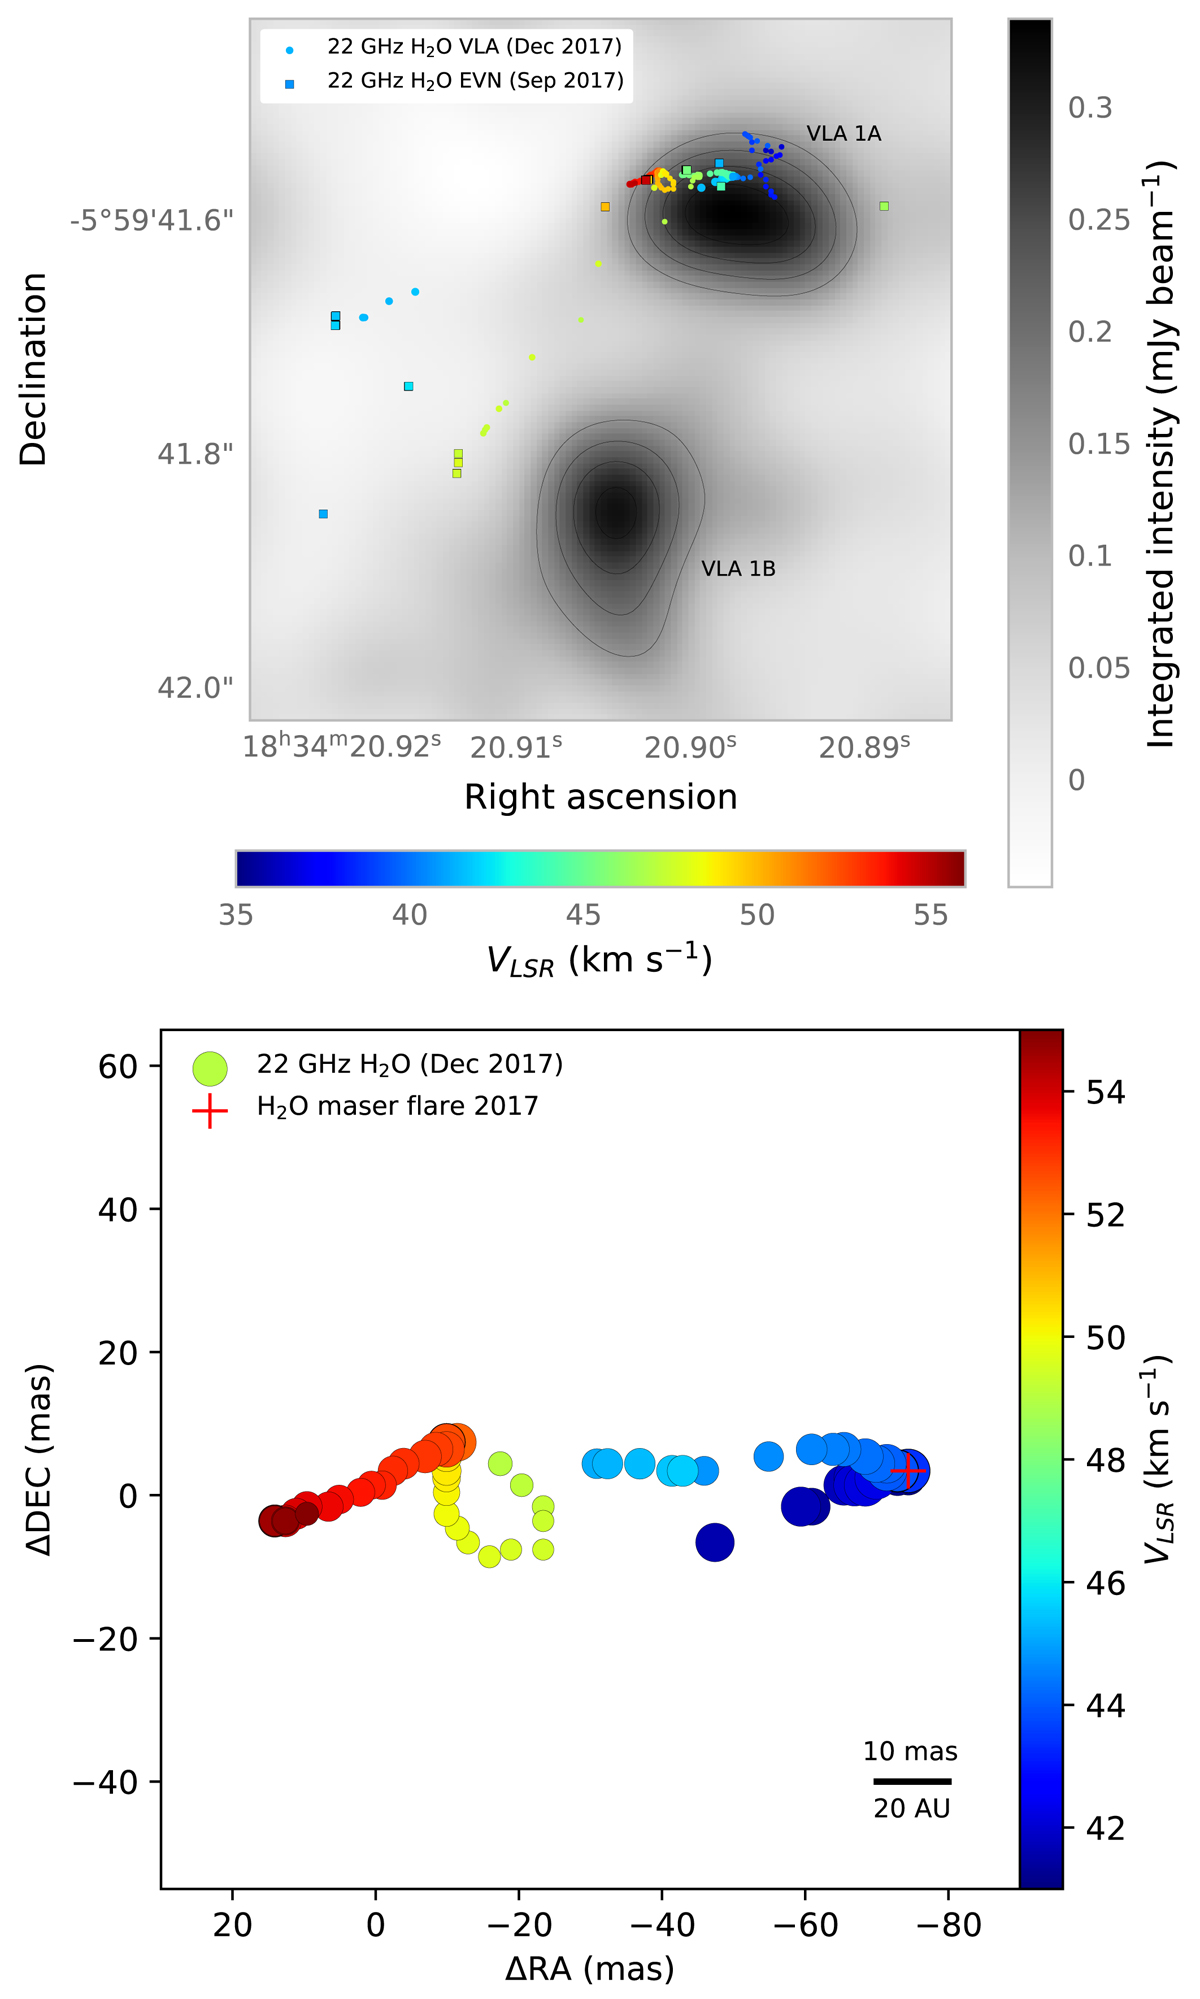
Fig. 8.
Download original image
Zoom in on the H2O maser activity in the VLA 1 region. Upper panel: H2O masers detected in the vicinity of VLA 1A and 1B with VLA (Bayandina et al. 2019) and EVN (Burns et al. 2020a). Lower panel: part of the 22 GHz H2O maser emission detected in the vicinity of VLA 1A with VLA (Bayandina et al. 2019).
Current usage metrics show cumulative count of Article Views (full-text article views including HTML views, PDF and ePub downloads, according to the available data) and Abstracts Views on Vision4Press platform.
Data correspond to usage on the plateform after 2015. The current usage metrics is available 48-96 hours after online publication and is updated daily on week days.
Initial download of the metrics may take a while.