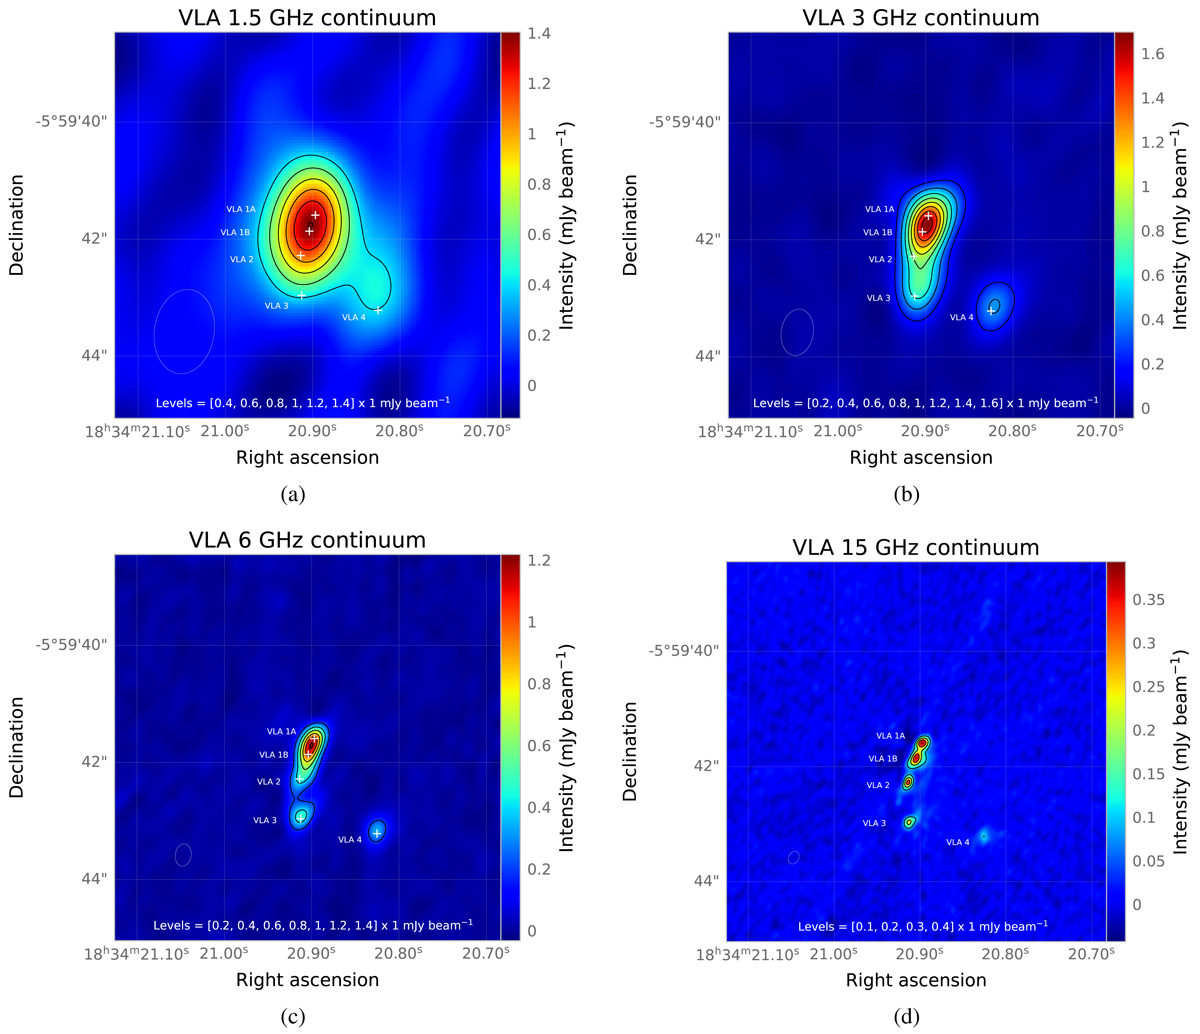
Fig. 1.
Download original image
VLA continuum images of G25.65+1.04 at 1.5, 3, 6, and 15 GHz. The contour levels are indicated in each panel. White crosses and labels mark the detected Ku-band continuum peaks from Table 3. The VLA synthesised beam size of each image is shown by the white ellipses in the lower-left corner of the panels. We note that the full UV range was used at each band.
Current usage metrics show cumulative count of Article Views (full-text article views including HTML views, PDF and ePub downloads, according to the available data) and Abstracts Views on Vision4Press platform.
Data correspond to usage on the plateform after 2015. The current usage metrics is available 48-96 hours after online publication and is updated daily on week days.
Initial download of the metrics may take a while.